
The SPDR S&P 500 (NYSE:SPY) closed 0.55% higher on Monday after opening the trading session slightly lower with an inside bar pattern.
Whether or not the market will continue in its current downtrend or reverse course, remains to be seen. However, the current trend suggests the SPY is likely to trade lower, although a positive reaction to retail-heavy earnings this week could help the market turn bullish.
Home Depot, Target and Walmart are all set to print their financial results this week and on Tuesday, the U.S. Census Bureau will release the latest retail sales data for July, which economists predict will jump to 0.4%, coming in ahead of the 0.2% increase in June.
Want direct analysis? Find me in the BZ Pro lounge! Click here for a free trial.
While the SPY has been trading in a downtrend on the daily chart, positive retail earnings could help the ETF rebound.
More experienced traders who wish to play the SPY either bullishly or bearishly may choose to do so through one of two Direxion ETFs. Bullish traders can enter a short-term position in Direxion Daily S&P 500 Bull 3X Shares (NYSE:SPXL) and bearish traders can trade the inverse ETF, Direxion Daily S&P 500 Bear 3X Shares (NYSE: SPXS
The ETFs: SPXL and SPXS are triple leveraged funds that track the movement of the SPY, seeking a return of 300% or –300% on the return of the benchmark index over a single day.
It should be noted that leveraged ETFs are meant to be used as a trading vehicle as opposed to long-term investments.
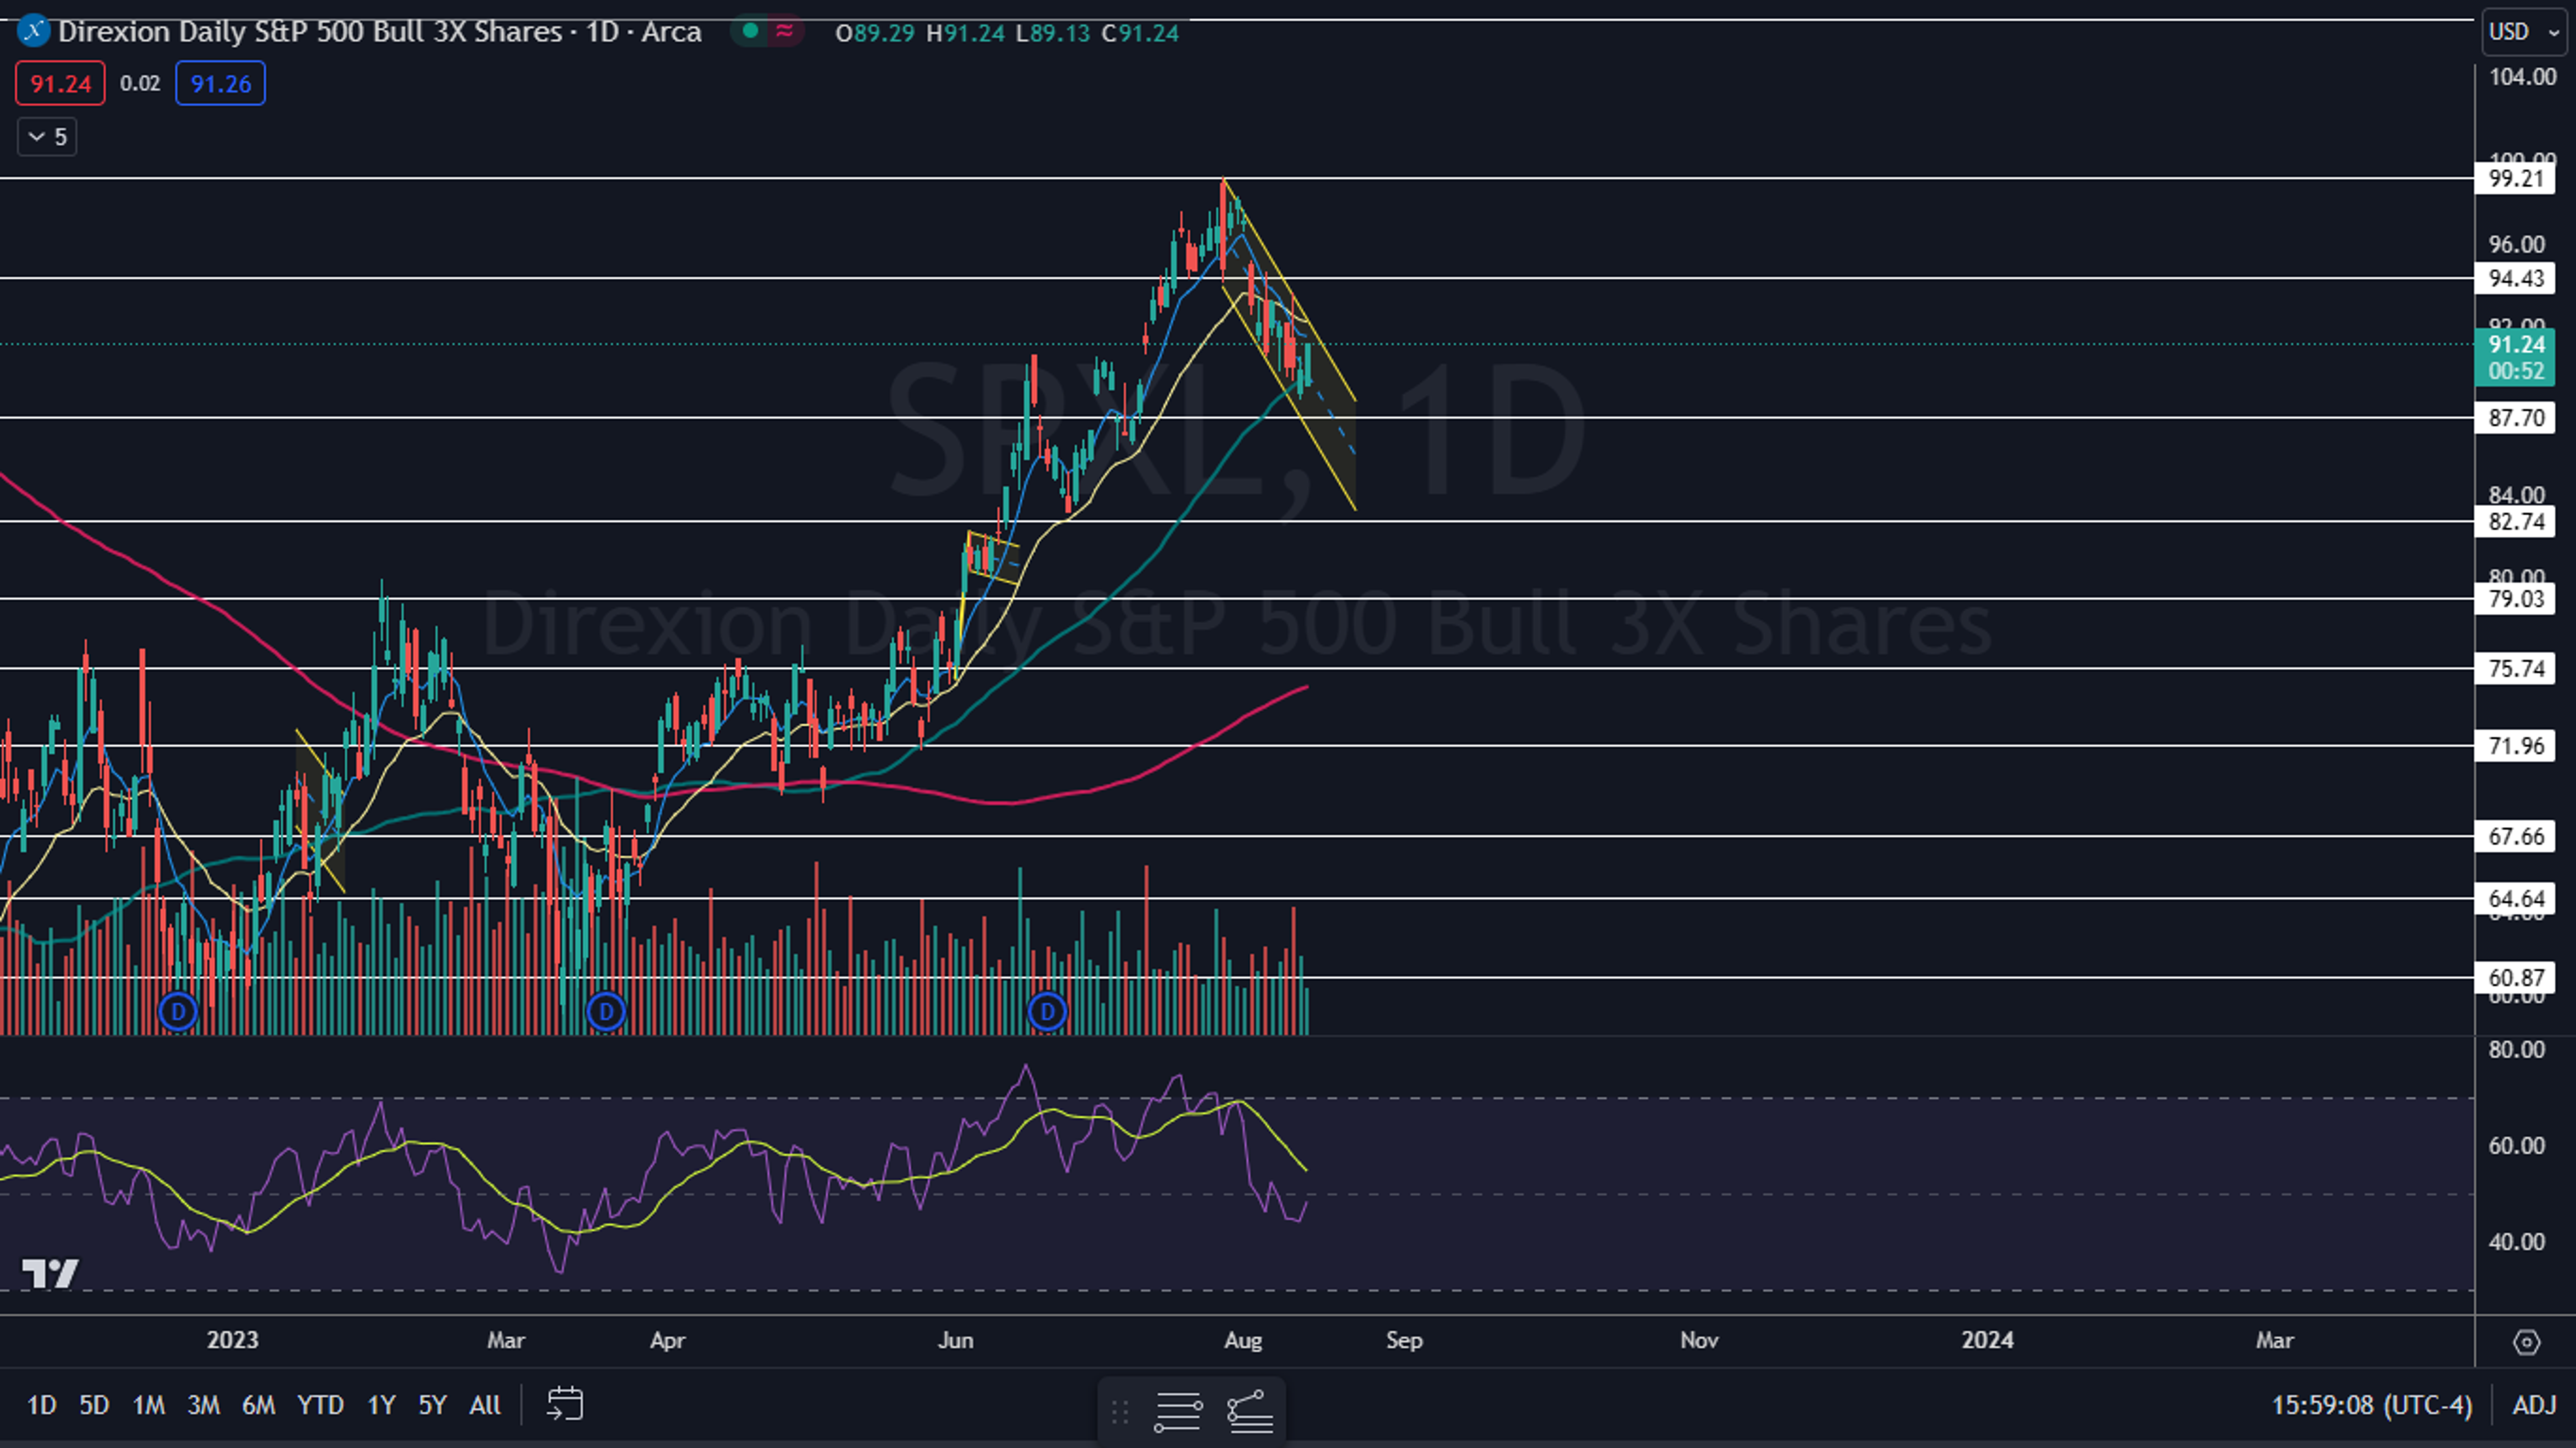
The SPXL Chart: SPXL reversed into a downtrend on July 27 and has since been trading within two descending parallel trend lines, which has settled the ETF into a falling channel pattern. The pattern leans bearish for the short term, but a break up from the upper trend line of the pattern can signal a longer-term reversal to the upside.
- On Monday, the ETF opened with an inside bar pattern but broke up above Friday’s high-of-day to close the session up 1.6%. The trading action caused SPXL to form a bullish Marubozu candlestick, which may indicate higher prices will come on Tuesday.
- Bullish traders want to see big bullish volume come in and break SPXL up from the falling channel pattern, which will negate the downtrend and push the ETF above the eight-day and 21-day exponential moving averages. Bearish traders want to see SPXL drop under the 50-day simple moving average, which will indicate the downtrend remains intact and could accelerate the downward pressure.
- SPXL has resistance above at $94.43 and at $99.21 and support below at $87.70 and at $82.74.

Featured image sourced from Shutterstock
© 2025 Benzinga.com. Benzinga does not provide investment advice. All rights reserved.