


Rivian Automotive, Inc RIVN was trading higher on Tuesday as the company heads into its second-quarter earnings print after the market close.
Analysts expect the company to report EPS of negative $1.41 on revenues of $978.88 million for the quarter ending June 30.
On Tuesday, Truist Securities analyst Jordan Levy maintained a Buy rating on Rivian and raised the price target from $28 to $30. The new price target suggests about 14% upside for the stock. Cantor Fitzgerald analyst Andres Sheppard downgraded the stock from Overweight to Neutral and bumped the price target from $27 to $29.
When Rivian printed its first-quarter earnings report on May 9, the stock ripped over 13% higher at one point the following day before closing that trading session flat.
For that quarter, Rivian reported a loss of $1.25 per share, which came in ahead of Street estimates of a loss of $1.59 per share. The company also posted a top-line beat, reporting revenues of $661 million against a $652-million consensus estimate.
From a technical perspective, Rivian looks neutral heading into the event, trading in a bearish inside bar pattern but above the 200-day simple moving average (SMA). Of course, holding a position in a stock over earnings can be akin to gambling, as stocks can rise following an earnings miss and fall after reporting a beat.
Want direct analysis? Find me in the BZ Pro lounge! Click here for a free trial.
The Rivian Chart: Rivian reversed into a downtrend on July 27 and has since printed a series of lower highs and lower lows. The most recent lower high was formed on Aug. 3 at $21.07 and the most recent lower low was printed at the $23.63 mark on Monday.
- On Tuesday, Rivian was trading in an inside bar, which leans bearish because the stock was trading lower before forming the pattern and is trading near the bottom of Monday’s range.
- Traders can watch for the stock to break up or down from the mother bar following the earnings print to gauge future direction.
- If Rivian suffers a bearish reaction to its earnings and falls lower, the stock may back test support at the 200-day SMA. When a stock is trading above the 200-day it’s considered to be in a bull cycle, and if Rivian can remain above the indicator, the 50-day SMA will cross above the 200-day SMA, which would cause a golden cross to form.
- If the stock receives a bullish reaction to the print and flies above the $28 mark, the downtrend will be negated and a new uptrend could be in the cards. If that occurs, a golden cross will appear on Rivian’s chart on Wednesday.
- Rivian has resistance above at $28.58 and at $32.84 and support below at $24.48 and at $21.

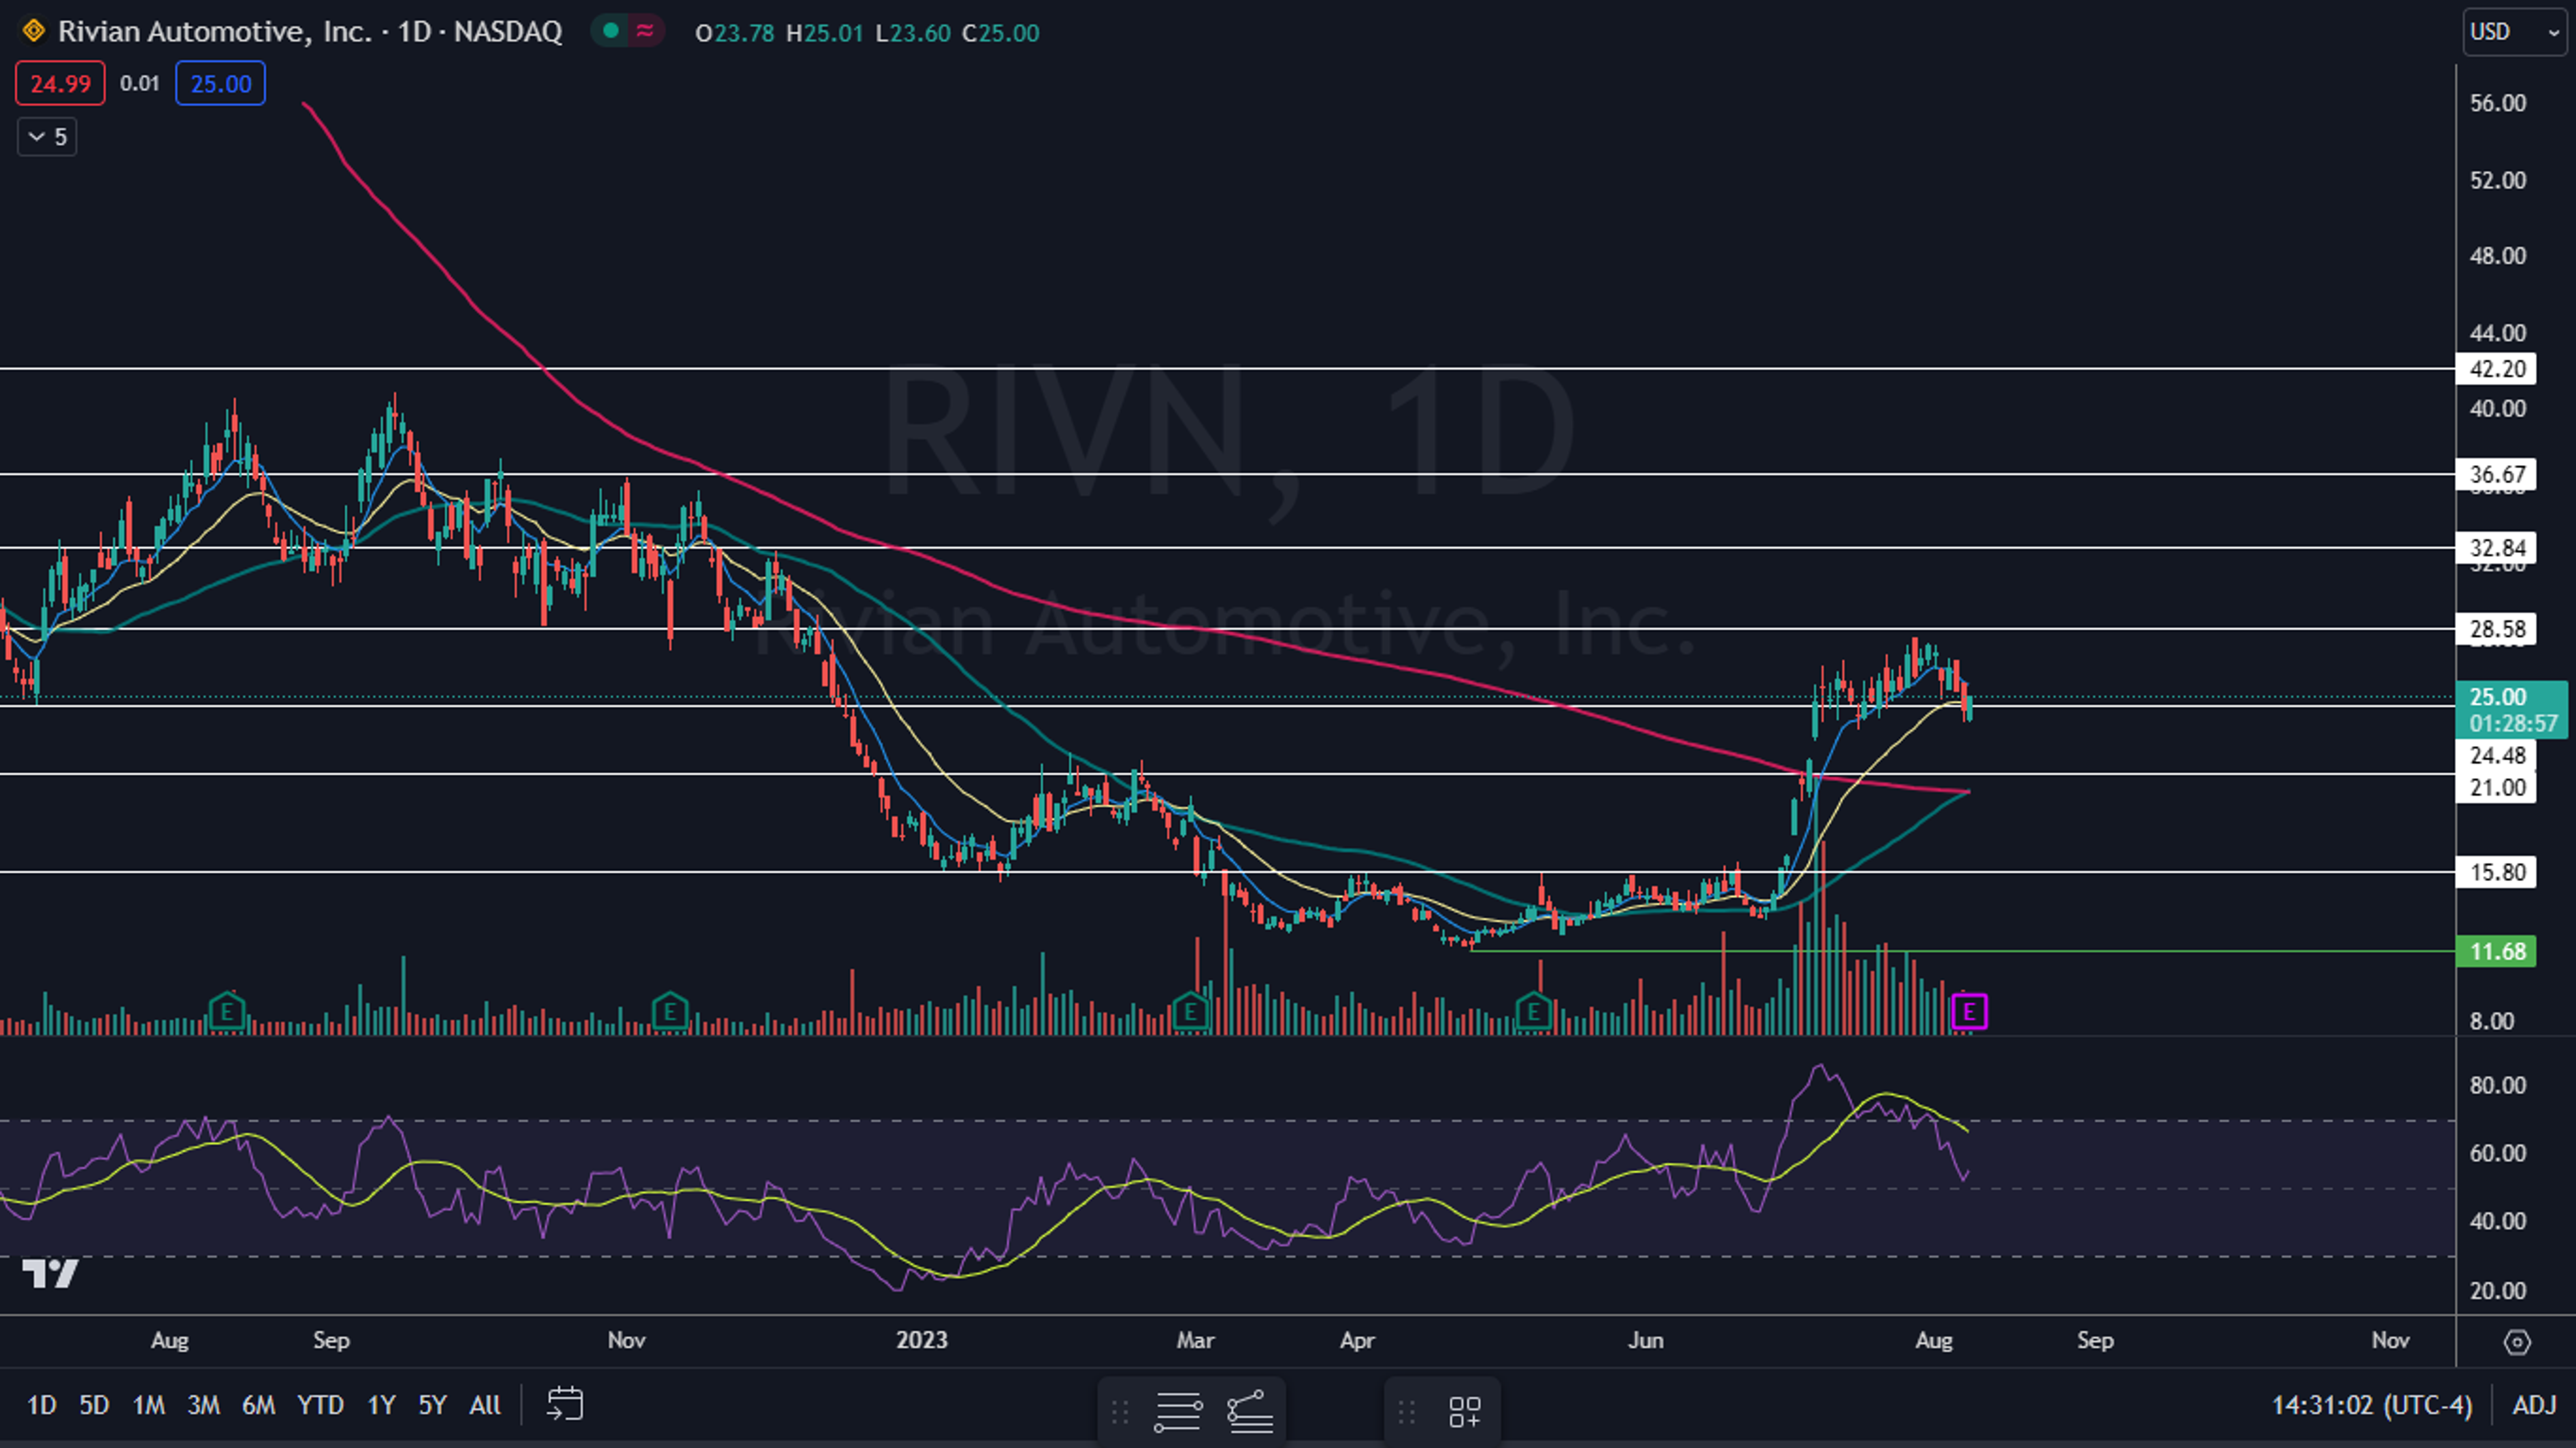
Photo courtesy of Rivian.
© 2024 Benzinga.com. Benzinga does not provide investment advice. All rights reserved.
Trade confidently with insights and alerts from analyst ratings, free reports and breaking news that affects the stocks you care about.

