


Meta Platforms, Inc META was trading slightly higher Thursday, breaking up from a rising channel amid reports the company’s artificial intelligence model is set to launch.
If the stock continues to hold support above the upper ascending trend line of the pattern, it will serve as a rarer bullish break of that type of formation.
Usually, a rising channel pattern is bullish for the short term, but bearish down the road. However, during bull cycles, stocks are more likely to break up from the pattern.
When a stock is trading within a rising channel, the "trend is your friend" (until it's not) and the stock is likely to continue upwards. Aggressive traders may decide to buy the stock at the lower trend line and exit the trade at the upper trend line.
Bearish traders will want to watch for a downward break from the lower ascending trend line, on high volume, for an entry. When a stock breaks down from a rising channel, it's a powerful reversal signal and indicates a downturn is likely in the cards.
Want direct analysis? Find me in the BZ Pro lounge! Click here for a free trial.
The Meta Chart: If Meta falls back into the channel pattern, Thursday’s bullish break will serve as a shorter-term bull trap. If that happens, the stock is likely to retrace to at least test the median line of the pattern as support.
- Meta is trading in an uptrend, making a series of higher highs and higher lows. The most recent higher high was formed on July 5 at $298.12 and the most recent higher low was printed at the $287.05 mark on July 10.
- If the stock trades lower on Friday, Thursday’s high-of-day will serve as the next higher high within the uptrend. Meta was also looking to print a shooting star or doji candlestick on Thursday, indicating lower prices are the most likely scenario.
- When Meta reached its high-of-day Thursday, the stock also rejected the top of a gap that was created on Feb. 3, 2022. Both the top and bottom ranges of gaps are likely to act as resistance and support, respectively, once the range is filled.
- Meta has resistance above at $315.88 and $325.18 and support below at $299.50 and $287.63.

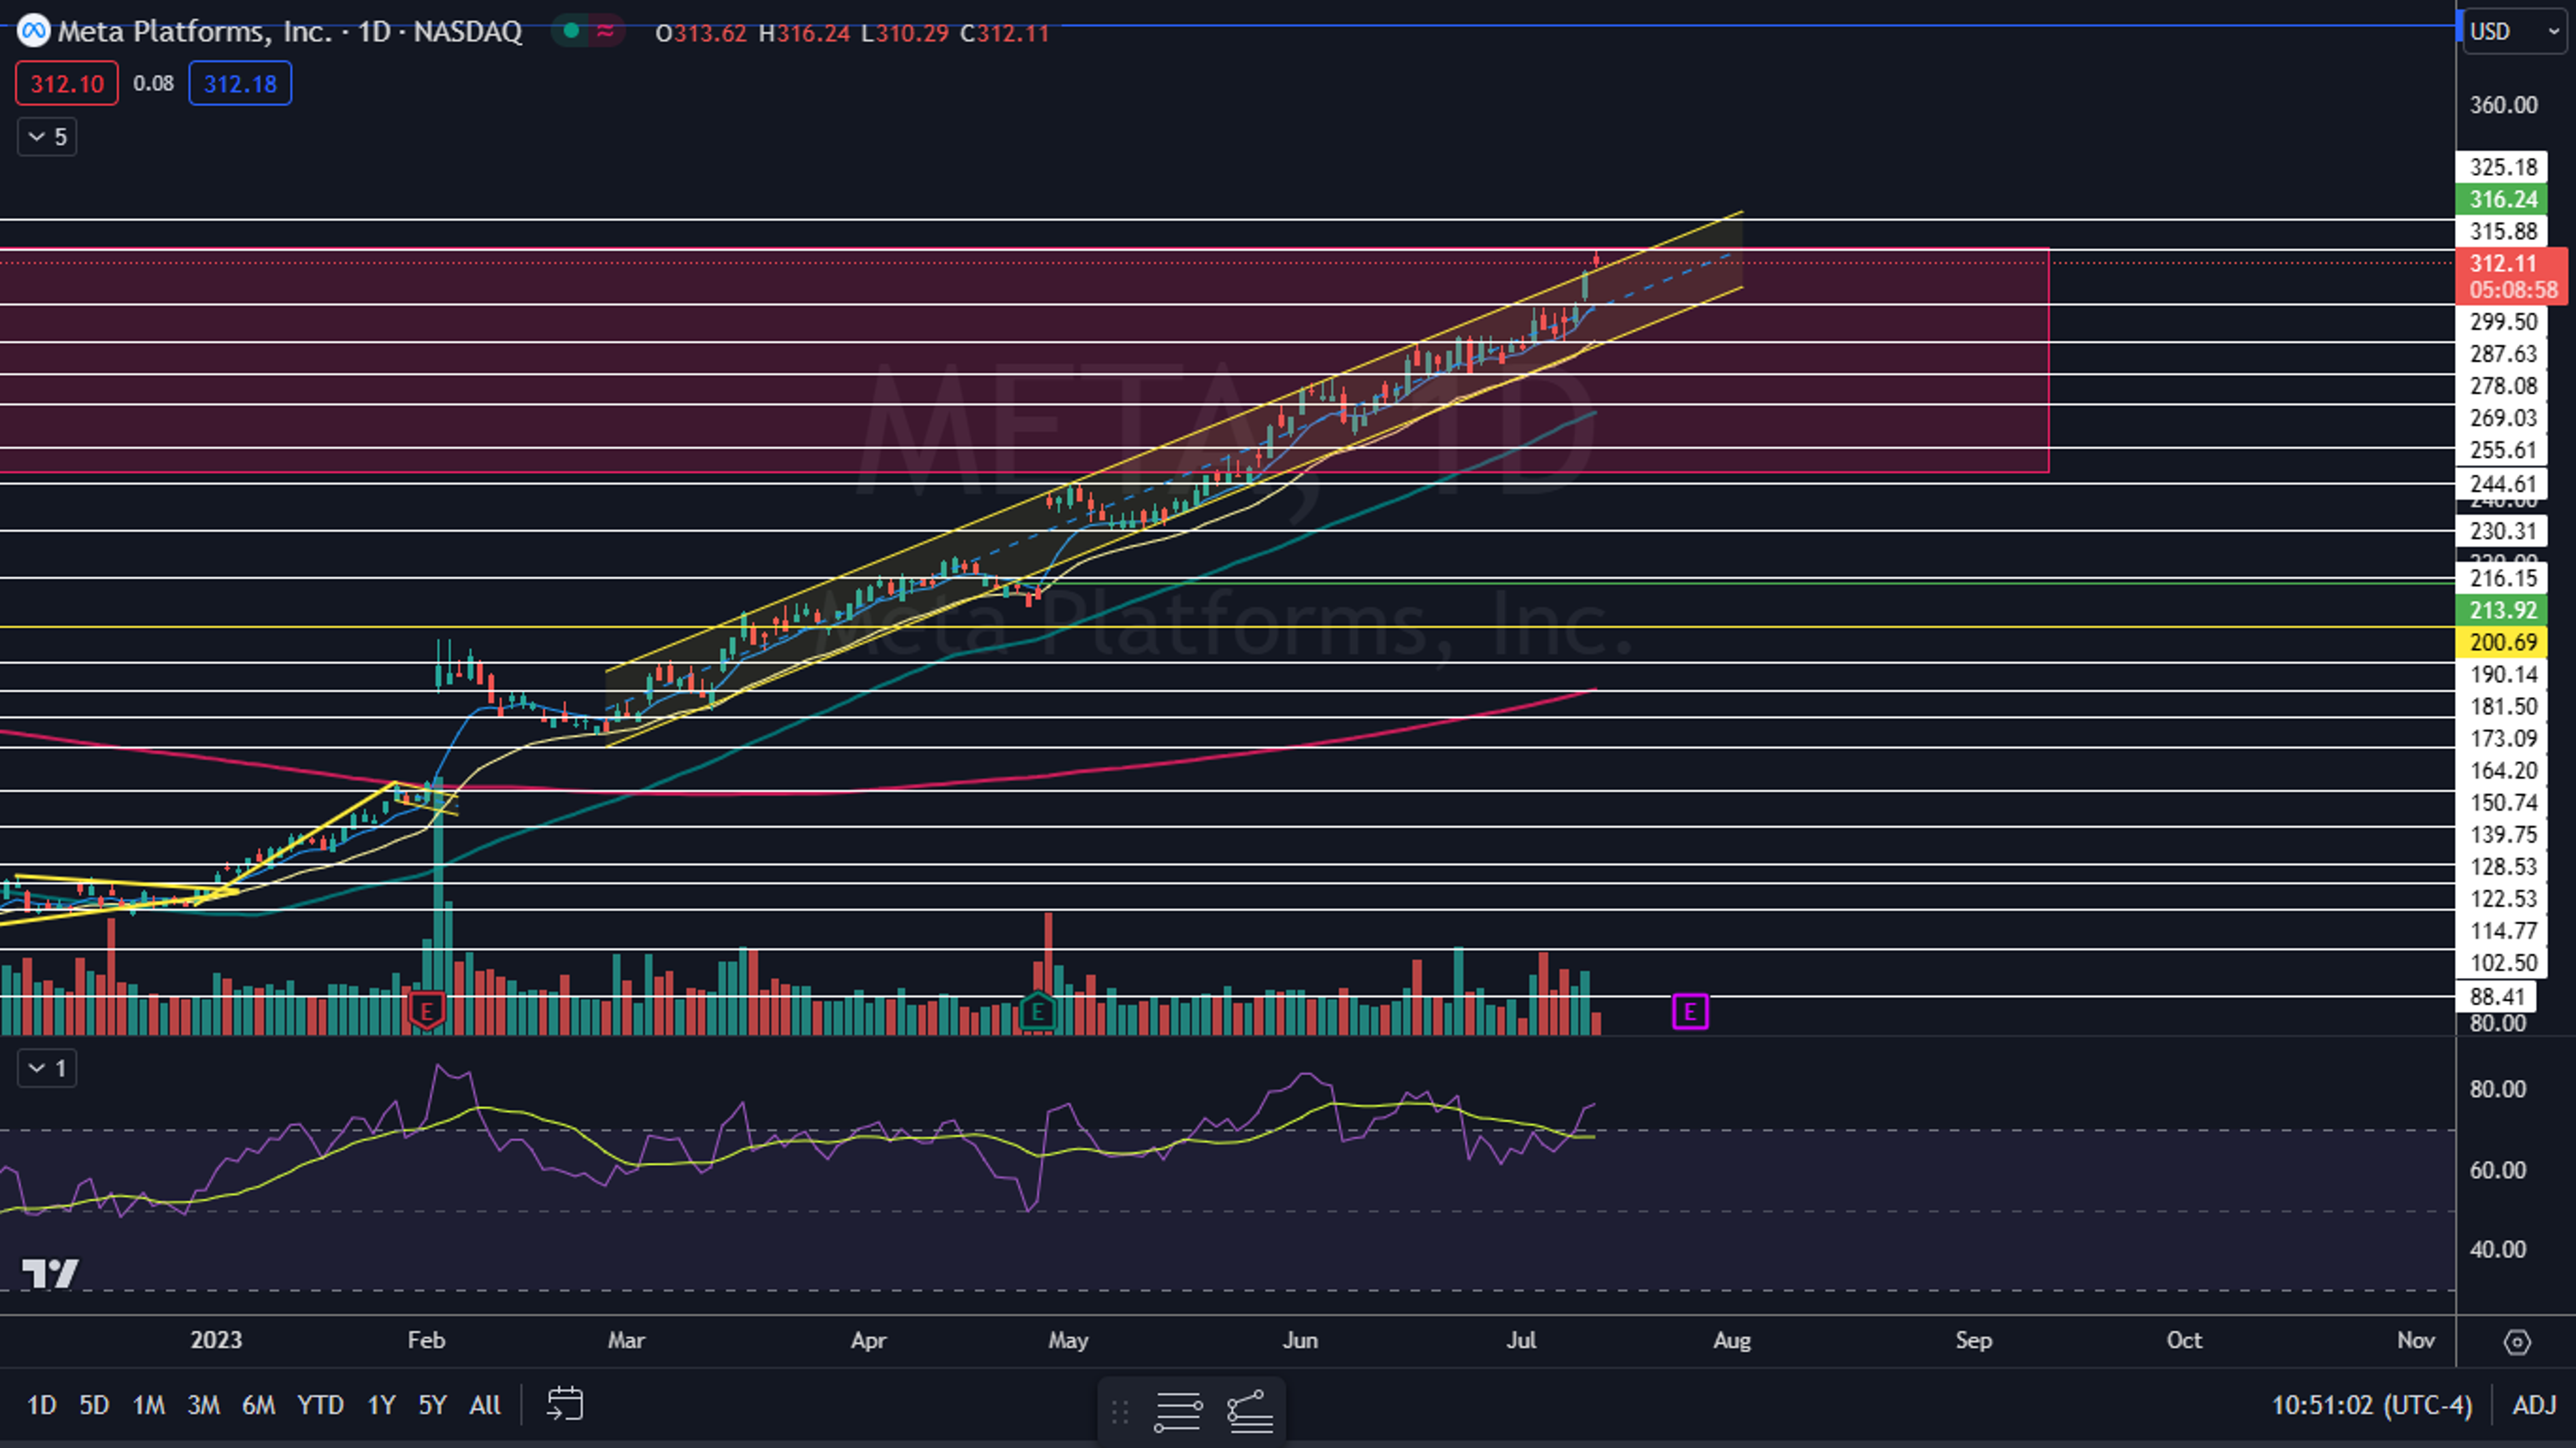
Photo: Courtesy of Anthony Quintano on flickr
© 2024 Benzinga.com. Benzinga does not provide investment advice. All rights reserved.
Trade confidently with insights and alerts from analyst ratings, free reports and breaking news that affects the stocks you care about.

