Direxion Daily Gold Miners Index Bull 2X Shares NUGT gapped up 2.45% higher on Wednesday, where the ETF ran into a group of sellers who knocked it down to trade mostly flat.
Spot gold was ticking slightly higher Wednesday as markets retraced ahead of jobs numbers, which are expected to be released on Friday.
Investors are worried the U.S. may be headed for a recession and are awaiting the Federal Reserve’s next rate decision. Jobs numbers on Friday are likely to offer insight into how the Fed will move forward with bringing down inflation. According to Bank of America, two out of three recessionary signs have already occurred. Read more here...
Want direct analysis? Find me in the BZ Pro lounge! Click here for a free trial.
NUGT, which usually trades in tandem with spot gold, has been in an uptrend since March 9, trading higher on bullish momentum.
NUGT is a double-leveraged fund that is designed to outperform the NYSE Arca Gold Miners Index by 200%. The ETF tracks several gold and silver mining companies, with Newmont Corporation NEM, Barrick Gold Corp GOLD and Franco-Nevada Corp FNV making up 31.56% of its holdings.
It should be noted that leveraged ETFs are meant to be used as a trading vehicle by experienced traders, as opposed to long-term investment. Leveraged ETFs should never be used by an investor with a buy-and-hold strategy or those who have low-risk appetites.
For traders wanting to play the gold mining index bearishly, Direxion offers Direxion Daily Gold Miners Index Bear 2X Shares DUST.
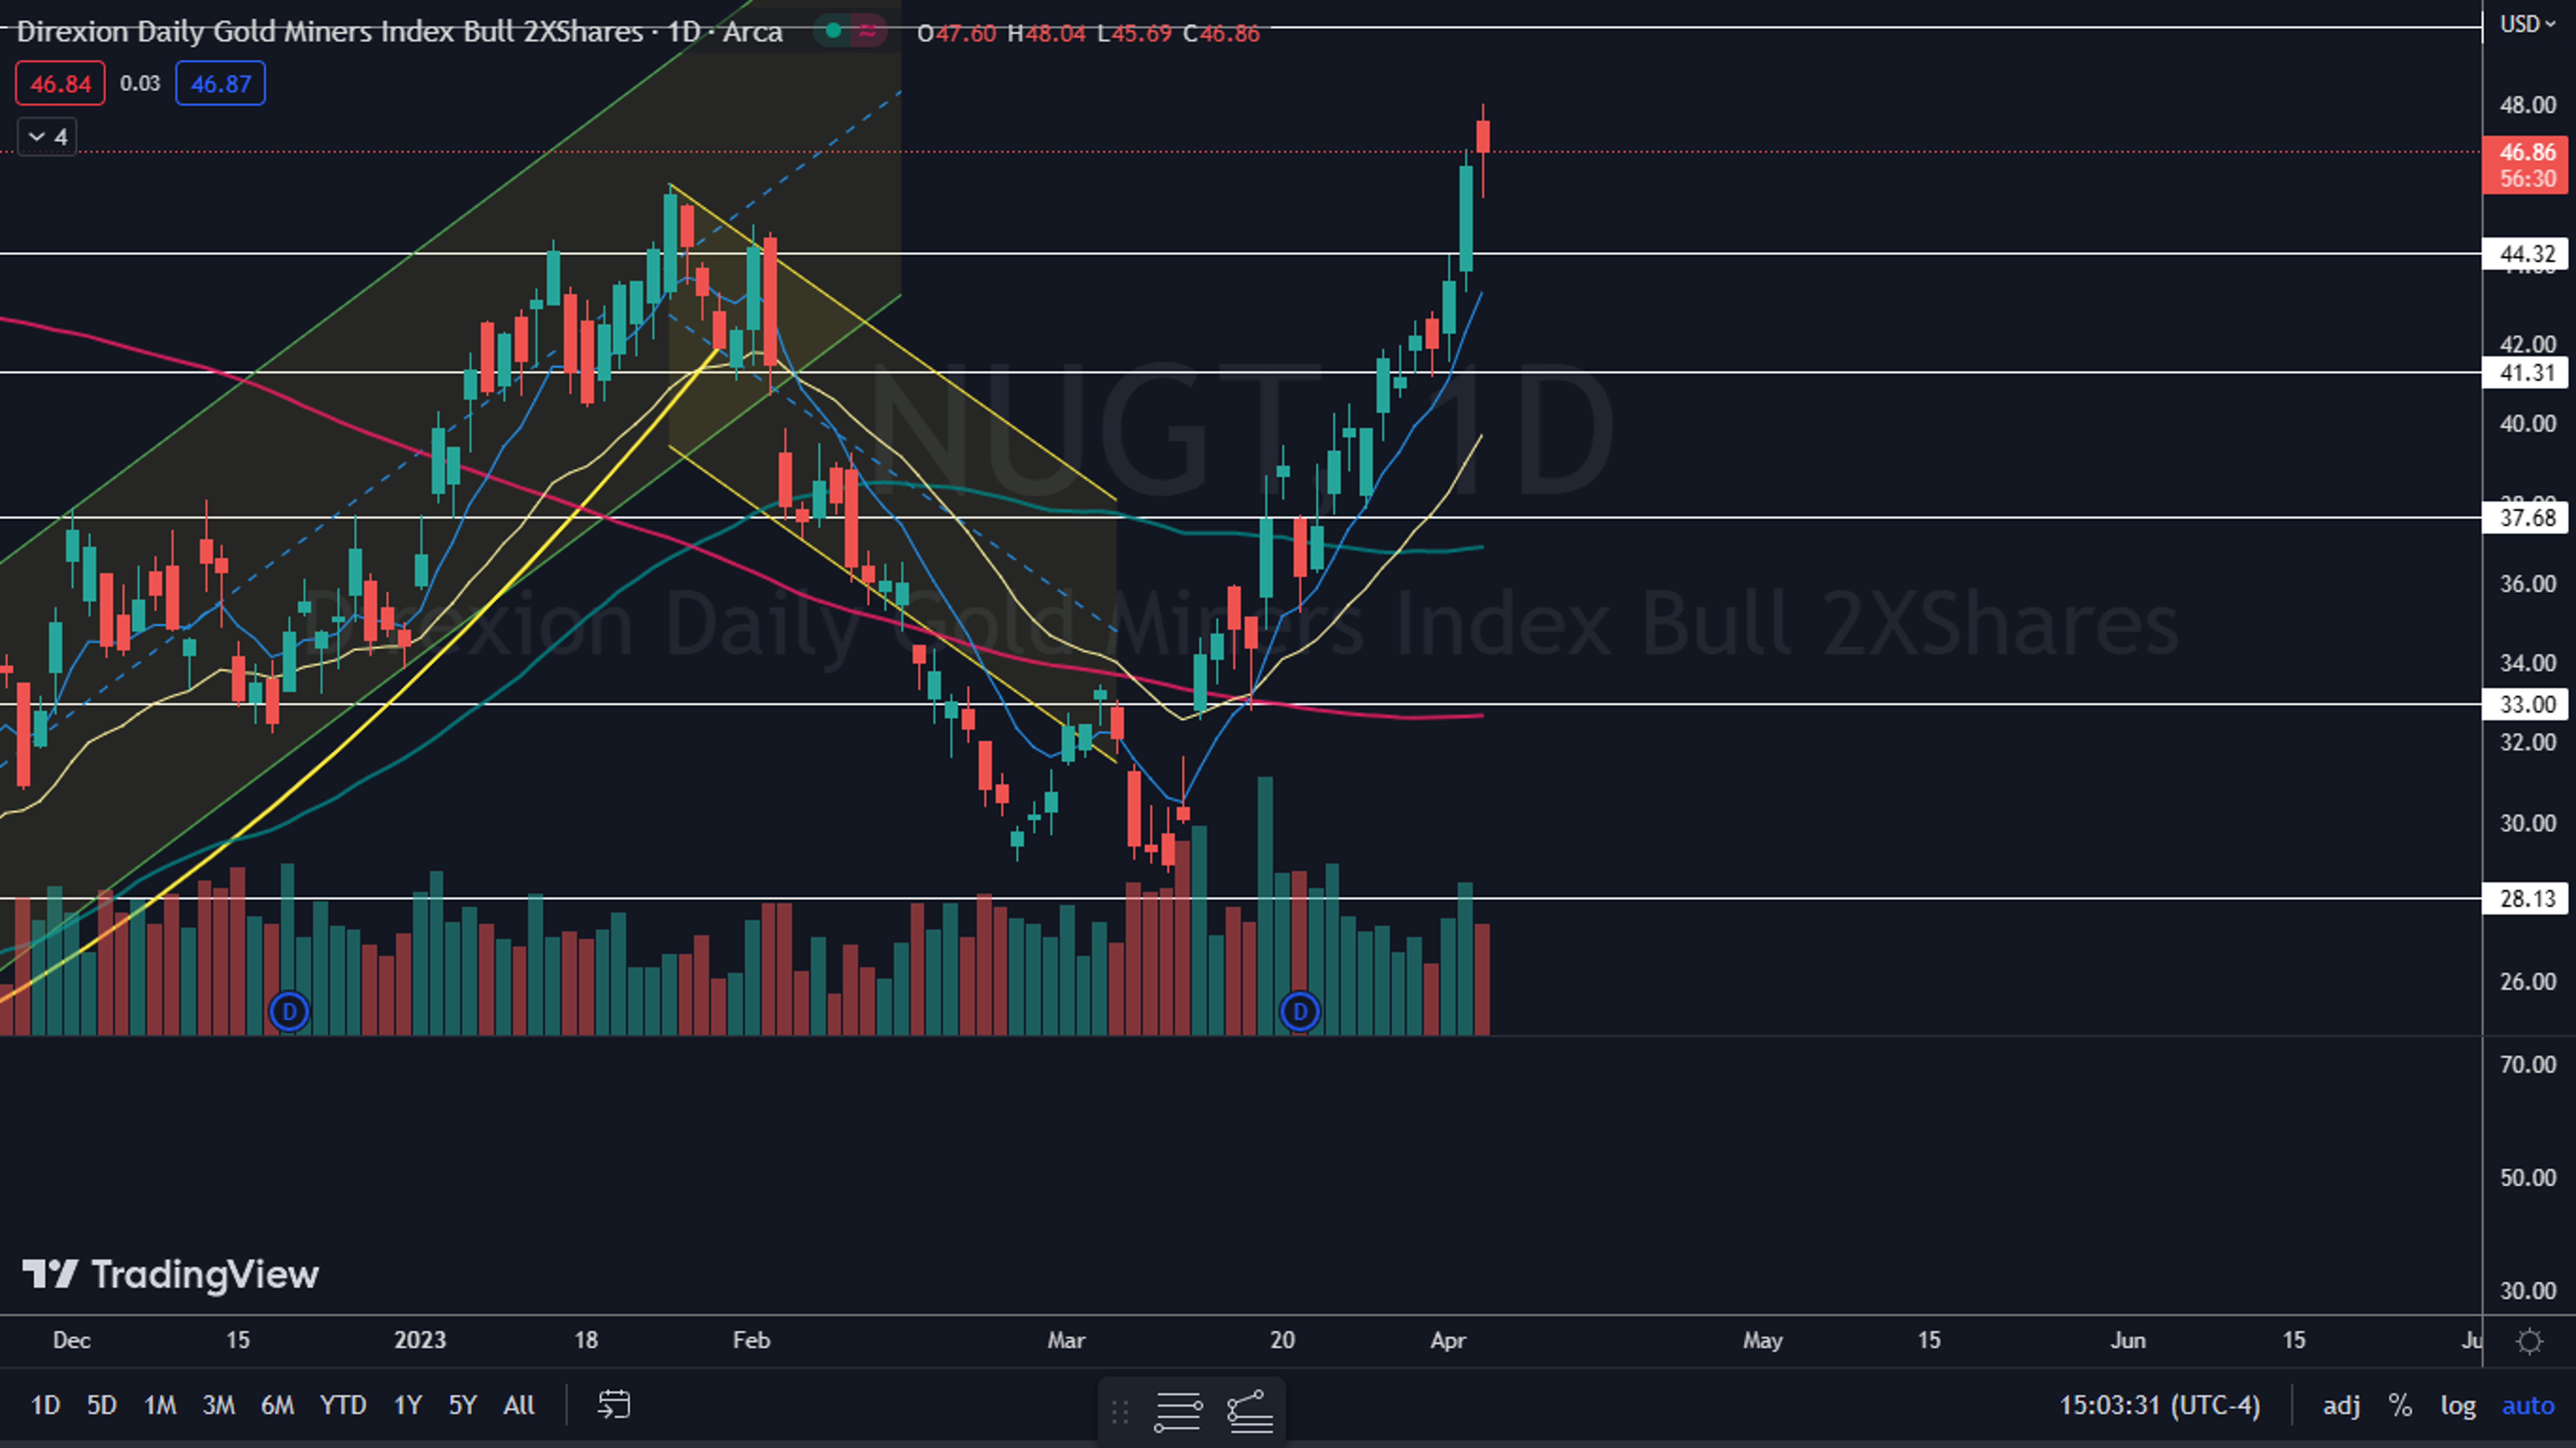
The NUGT Chart: NUGT’s most recent higher low within its uptrend was printed on March 31 at $41.18 and the most recent confirmed higher high was formed at the $41.89 mark three days prior. On Wednesday, NUGT looked to be printing a bearish hanging man candlestick, which could indicate the next higher high has occurred and a retracement is in the cards.
If NUGT trades lower on Thursday, bullish traders can watch for the ETF to eventually print a bullish reversal candlestick, such as a doji or hammer candlestick, to indicate the next higher low has printed and the uptrend will continue. Bearish traders want to see big bearish volume come in and knock NUGT down under the eight-day exponential moving average, which could accelerate a move to the downside and cause the uptrend to negate.
NUGT has resistance above at $50 and $54.75 and support below at $44.32 and $41.31.

© 2024 Benzinga.com. Benzinga does not provide investment advice. All rights reserved.
Trade confidently with insights and alerts from analyst ratings, free reports and breaking news that affects the stocks you care about.

