
Amazon.com, Inc AMZN burst up through the important $100 psychological level of resistance on Friday with continued momentum, after breaking up from a bull flag pattern on Thursday. The move came in tandem with bearish price action in the general market.
The bull flag pattern is created with a sharp rise higher forming the pole, which is then followed by a consolidation pattern that brings the stock lower between a channel with parallel lines or into a tightening triangle pattern.
For bearish traders, the "trend is your friend" (until it's not) and the stock may continue downward within the following channel for a short period of time. Aggressive traders may decide to short the stock at the upper trendline and exit the trade at the lower trendline.
Bullish traders will want to watch for a break up from the upper descending trendline of the flag formation, on high volume, for an entry. When a stock breaks up from a bull flag pattern, the measured move higher is equal to the length of the pole and should be added to the lowest price within the flag.
A bull flag is negated when a stock closes a trading day below the lower trendline of the flag pattern or if the flag falls more than 50% down the length of the pole.
Want direct analysis? Find me in the BZ Pro lounge! Click here for a free trial.
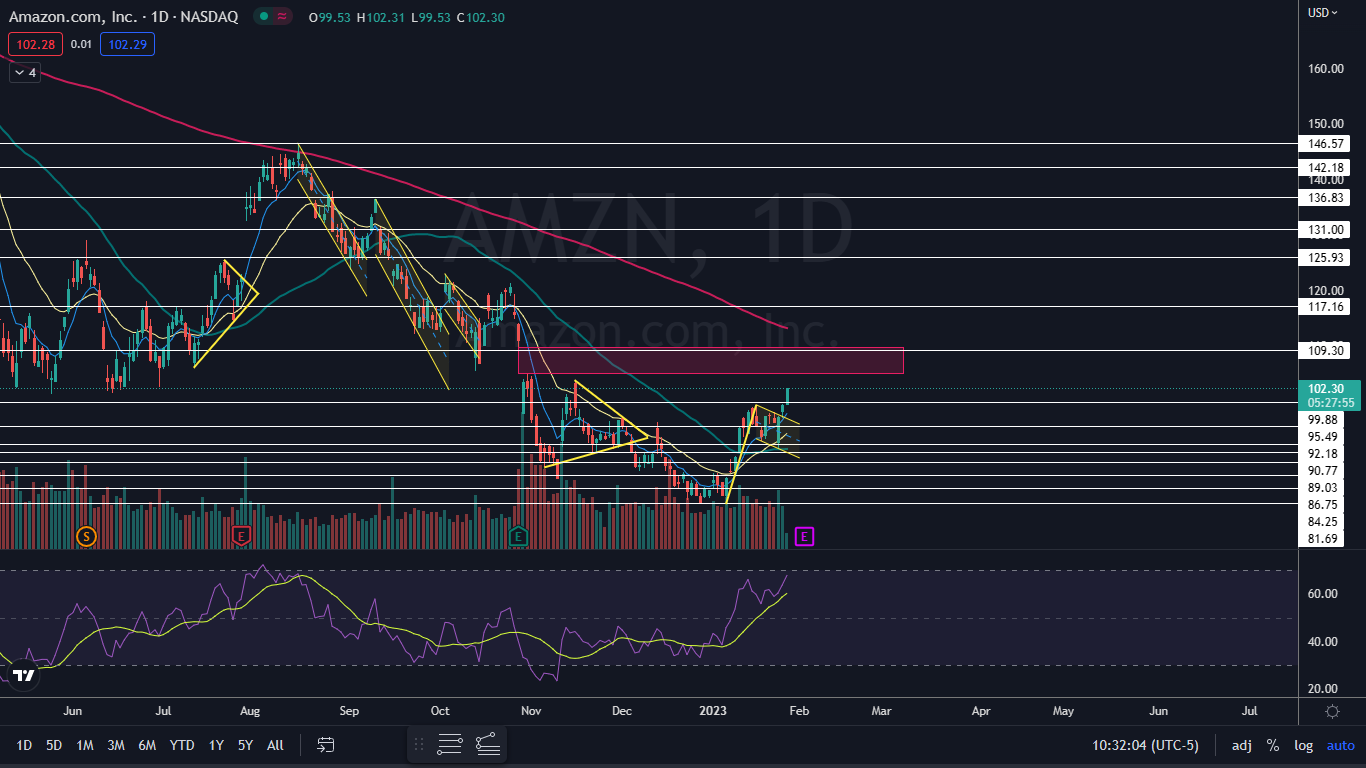
The Amazon Chart: Amazon’s bull flag pattern was created between Jan. 6 and Wednesday, with the pole formed over the first seven trading days of that time frame and the flag formed over the six trading sessions that followed. On Thursday, Amazon broke up from the flag, and on Friday the stock opened higher and buyers came in to push Amazon through $100.
The measured move of the bull flag pattern is about 20%, which suggests Amazon could be headed for $109.
- If Amazon closes the trading day near its high-of-day price, the stock will print a bullish kicker candlestick pattern, which could indicate higher prices will come again on Monday. If the stock runs into sellers and closes Friday with an upper wick, Amazon will print a shooting star candlestick, which could indicate the local top has occurred and a retracement is in the cards.
- If Amazon continues to trend higher over the coming days, the stock may begin to fill an upper gap that exists between $104.87 and $109.77. If that occurs, Amazon may find resistance at the upper range of the gap, where short sellers will look for the stock to print a bearish reversal candlestick, such as a doji or hanging man candlestick.
- A pullback is likely to come over the next few days because Amazon’s relative strength index (RSI) is measuring in at about 67%. When a stock’s RSI reaches or exceeds the 70% level, it becomes overbought, which can be a sell signal for technical traders.
- Amazon has resistance above at $109.30 and $117.16 and support below at $99.88 and $95.49.
 Read Next: Amazon To Dispose Of Bay Area Office Space At Loss, Strategically Open News Facilities
Photo via Shutterstock.
© 2024 Benzinga.com. Benzinga does not provide investment advice. All rights reserved.
Comments
Trade confidently with insights and alerts from analyst ratings, free reports and breaking news that affects the stocks you care about.

