
Nio, Inc (NYSE:NIO) opened about 3% lower on Friday, in tandem with Tesla Inc (NASDAQ:TSLA), which gapped down about 6% after the EV giant announced it had slashed vehicle prices in the U.S.
Ford Motor Company (NYSE:F) fell 6% following the news and General Motors Company (NYSE:GM) was knocked down about 5%.
Nio, which is headquartered in Shanghai, fared well in comparison to North American-made Ford and GM and instead traded in line with Tesla, which attempted to rise up off the low-of-day.
Nio didn’t fall under Thursday’s low-of-day when the stock dipped, which settled it into an inside bar pattern on the daily chart.
An inside bar pattern indicates a period of consolidation and is usually followed by a continuation move in the direction of the current trend.
An inside bar pattern has more validity on larger time frames (four-hour chart or larger). The pattern has a minimum of two candlesticks and consists of a mother bar (the first candlestick in the pattern) followed by one or more subsequent candles. The subsequent candle(s) must be completely inside the range of the mother bar and each is called an "inside bar."
A double, or triple inside bar can be more powerful than a single inside bar. After the break of an inside bar pattern, traders want to watch for high volume for confirmation the pattern was recognized.
Bullish traders will want to search for inside bar patterns on stocks that are in an uptrend. Some traders may take a position during the inside bar prior to the break while other aggressive traders will take a position after the break of the pattern.
For bearish traders, finding an inside bar pattern on a stock that's in a downtrend will be key. Like bullish traders, bears have two options of where to take a position to play the break of the pattern. For bearish traders, the pattern is invalidated if the stock rises above the highest range of the mother candle.
Want direct analysis? Find me in the BZ Pro lounge! Click here for a free trial.
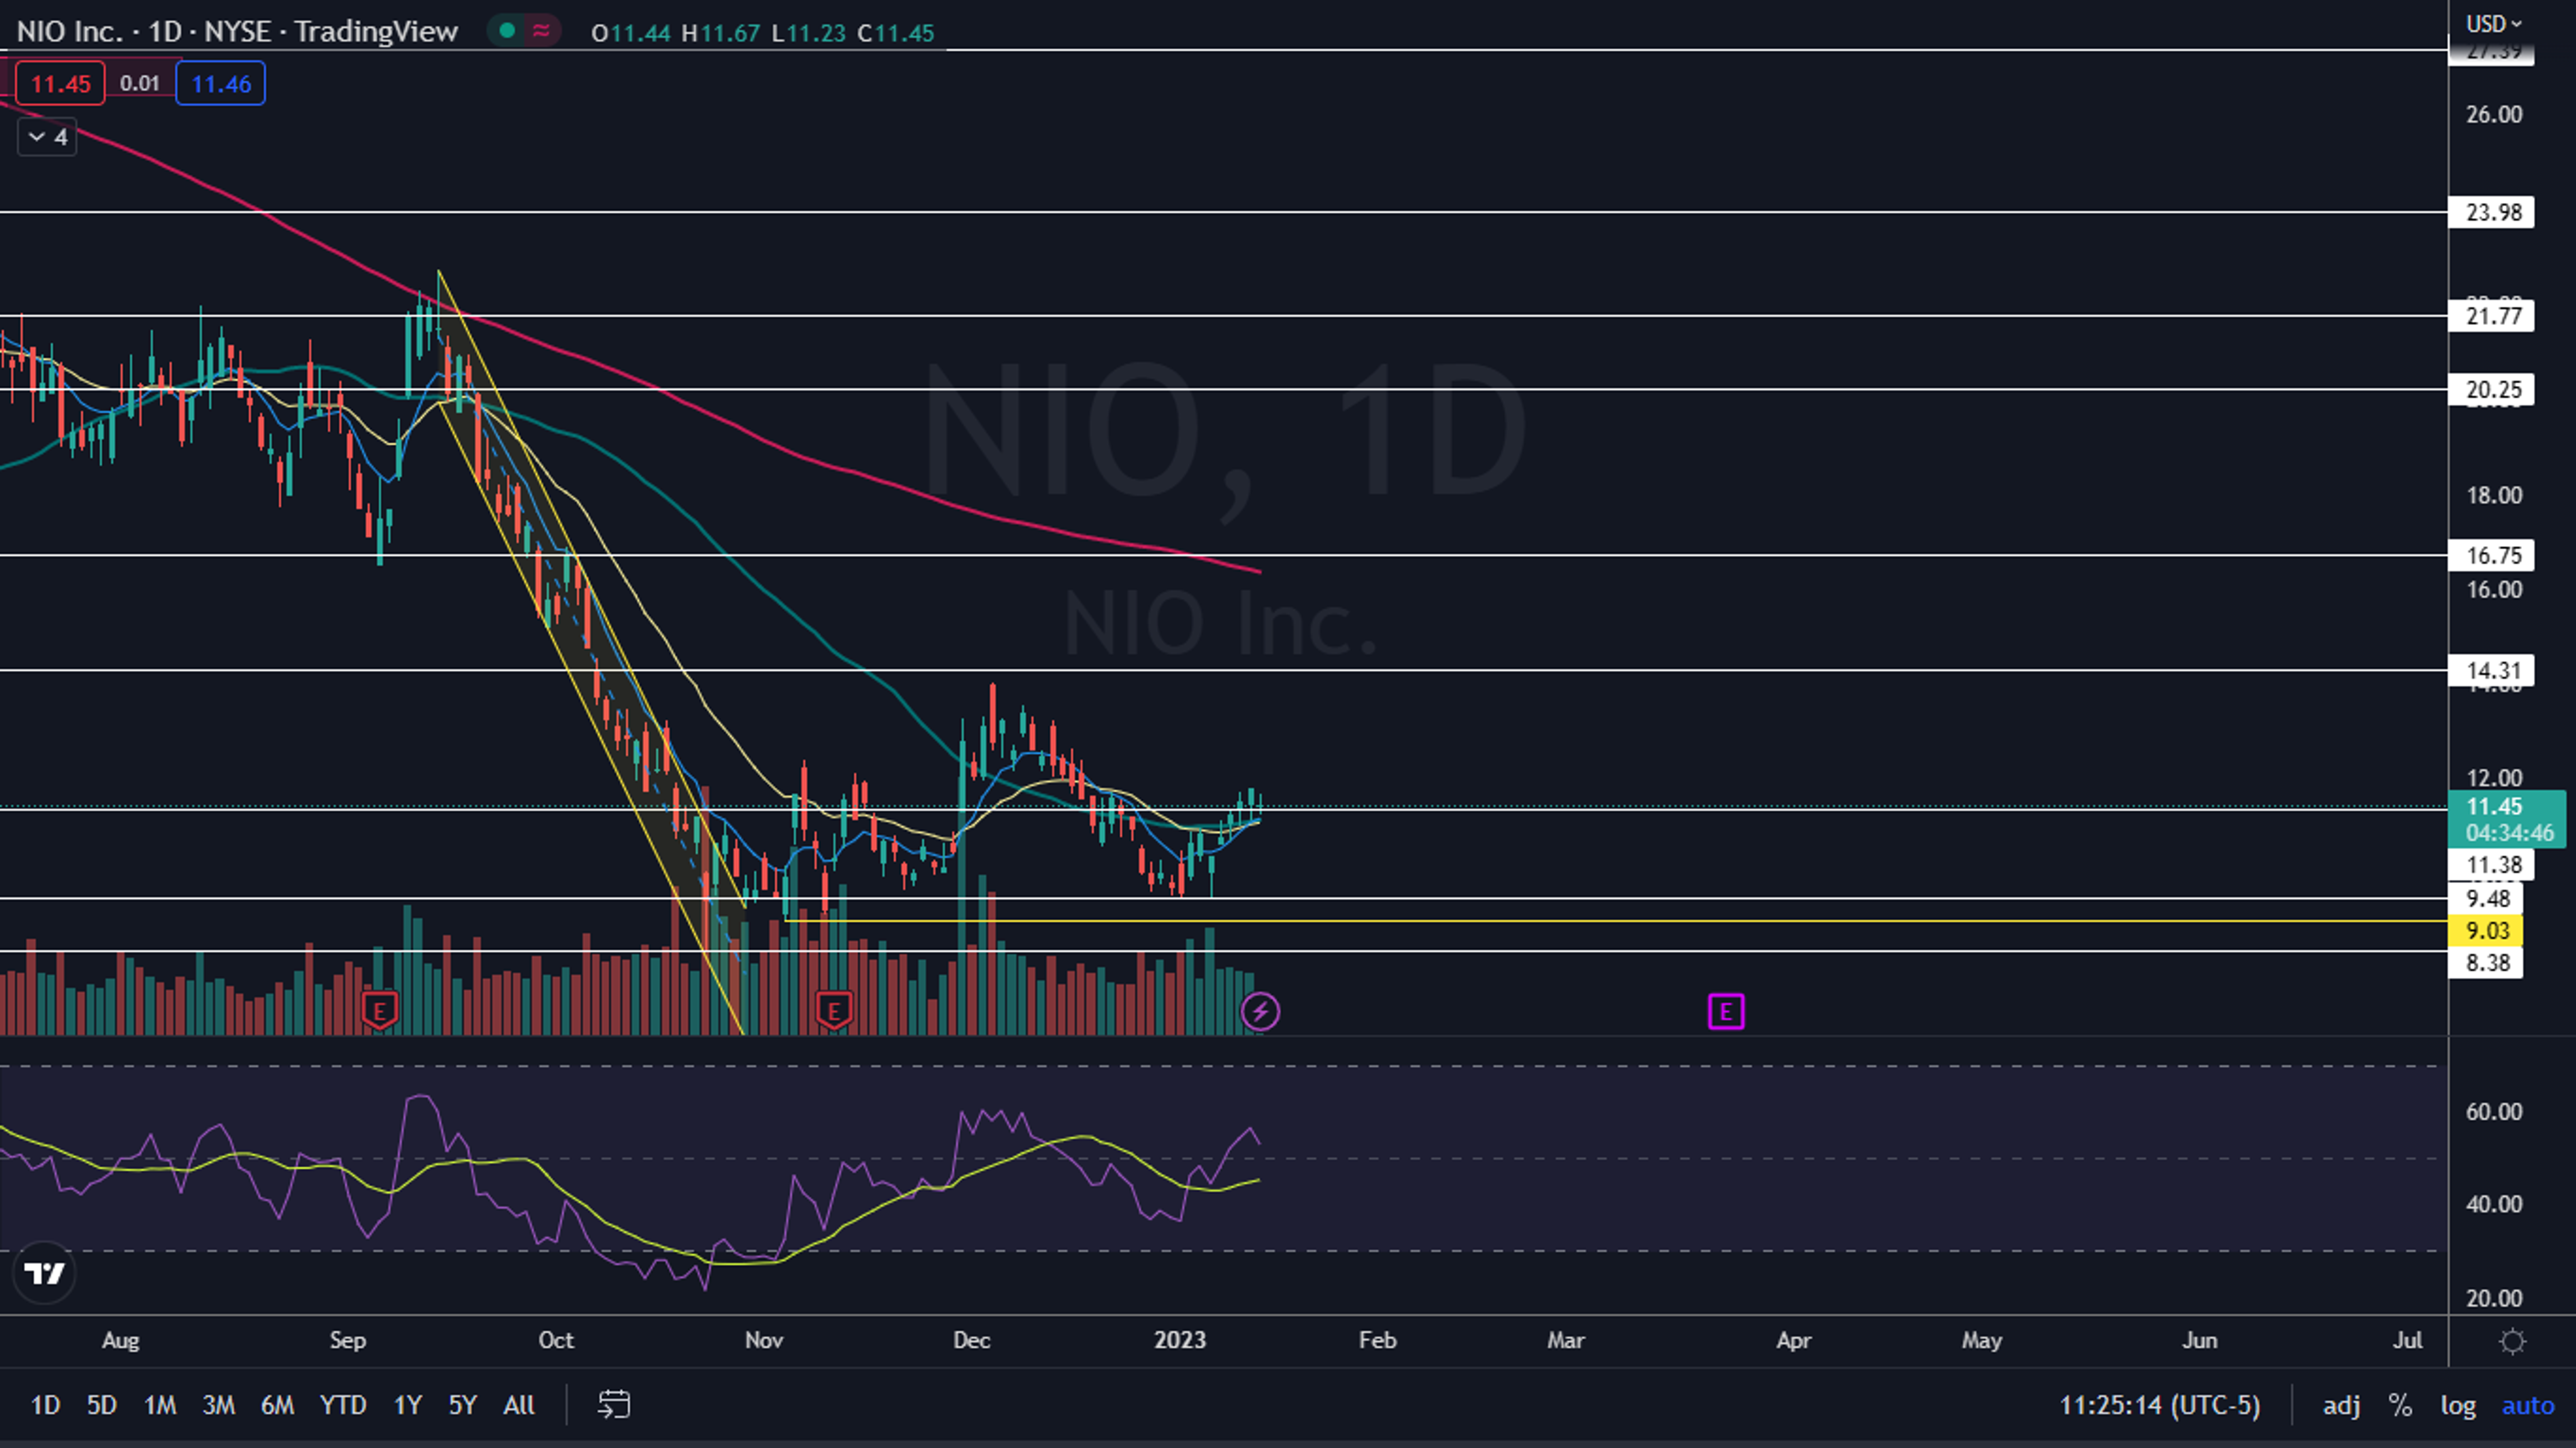
The Nio Chart: Nio’s inside bar leaned bullish because the stock was trading higher before forming the pattern. Traders can watch for the stock to break up or down from Thursday’s mother bar later on Friday or Monday to gauge the future direction.
- Although Nio negated its downtrend on Thursday by printing a higher high above the most recent lower high of $11.71, the stock hasn’t confirmed a new uptrend by printing a higher low above $9.50. If Nio breaks down from the inside bar pattern, bullish traders will want to see the stock form a reversal candlestick, such as a doji or hammer candlestick, above that level.
- Technical traders may have believed Nio would reverse upward on Jan. 6, when the stock printed a bullish double bottom pattern at the $9.50 area, when paired with similar price action on Jan. 3. The bounce north that followed caused the eight-day exponential moving average (EMA) to cross above the 21-day EMA, which is bullish.
- Nio has resistance above at $12 and $14.31 and support below at $11.38 and $9.48.

© 2025 Benzinga.com. Benzinga does not provide investment advice. All rights reserved.