


Amazon.com, Inc AMZN was popping up slightly in the premarket on Wednesday, in the lead-up to the Black Friday and Cyber Monday shopping extravaganzas that follow every Thanksgiving holiday.
The e-commerce giant has already started marking down items across all its categories and is sitting on record high inventories, which could lead to deeper discounts than what’s usually offered.
Soaring inflation and steeply rising interest rates have led to a decrease in consumer spending. Amazon has started to feel the effects, reporting third-quarter revenues that came in shy of analyst estimates.
Despite the fourth quarter historically being a time of increased spending, Amazon guided revenues far below estimates and has begun cost-cutting measures by implementing a hiring freeze. The company is also expected to let go of about 10,000 employees.
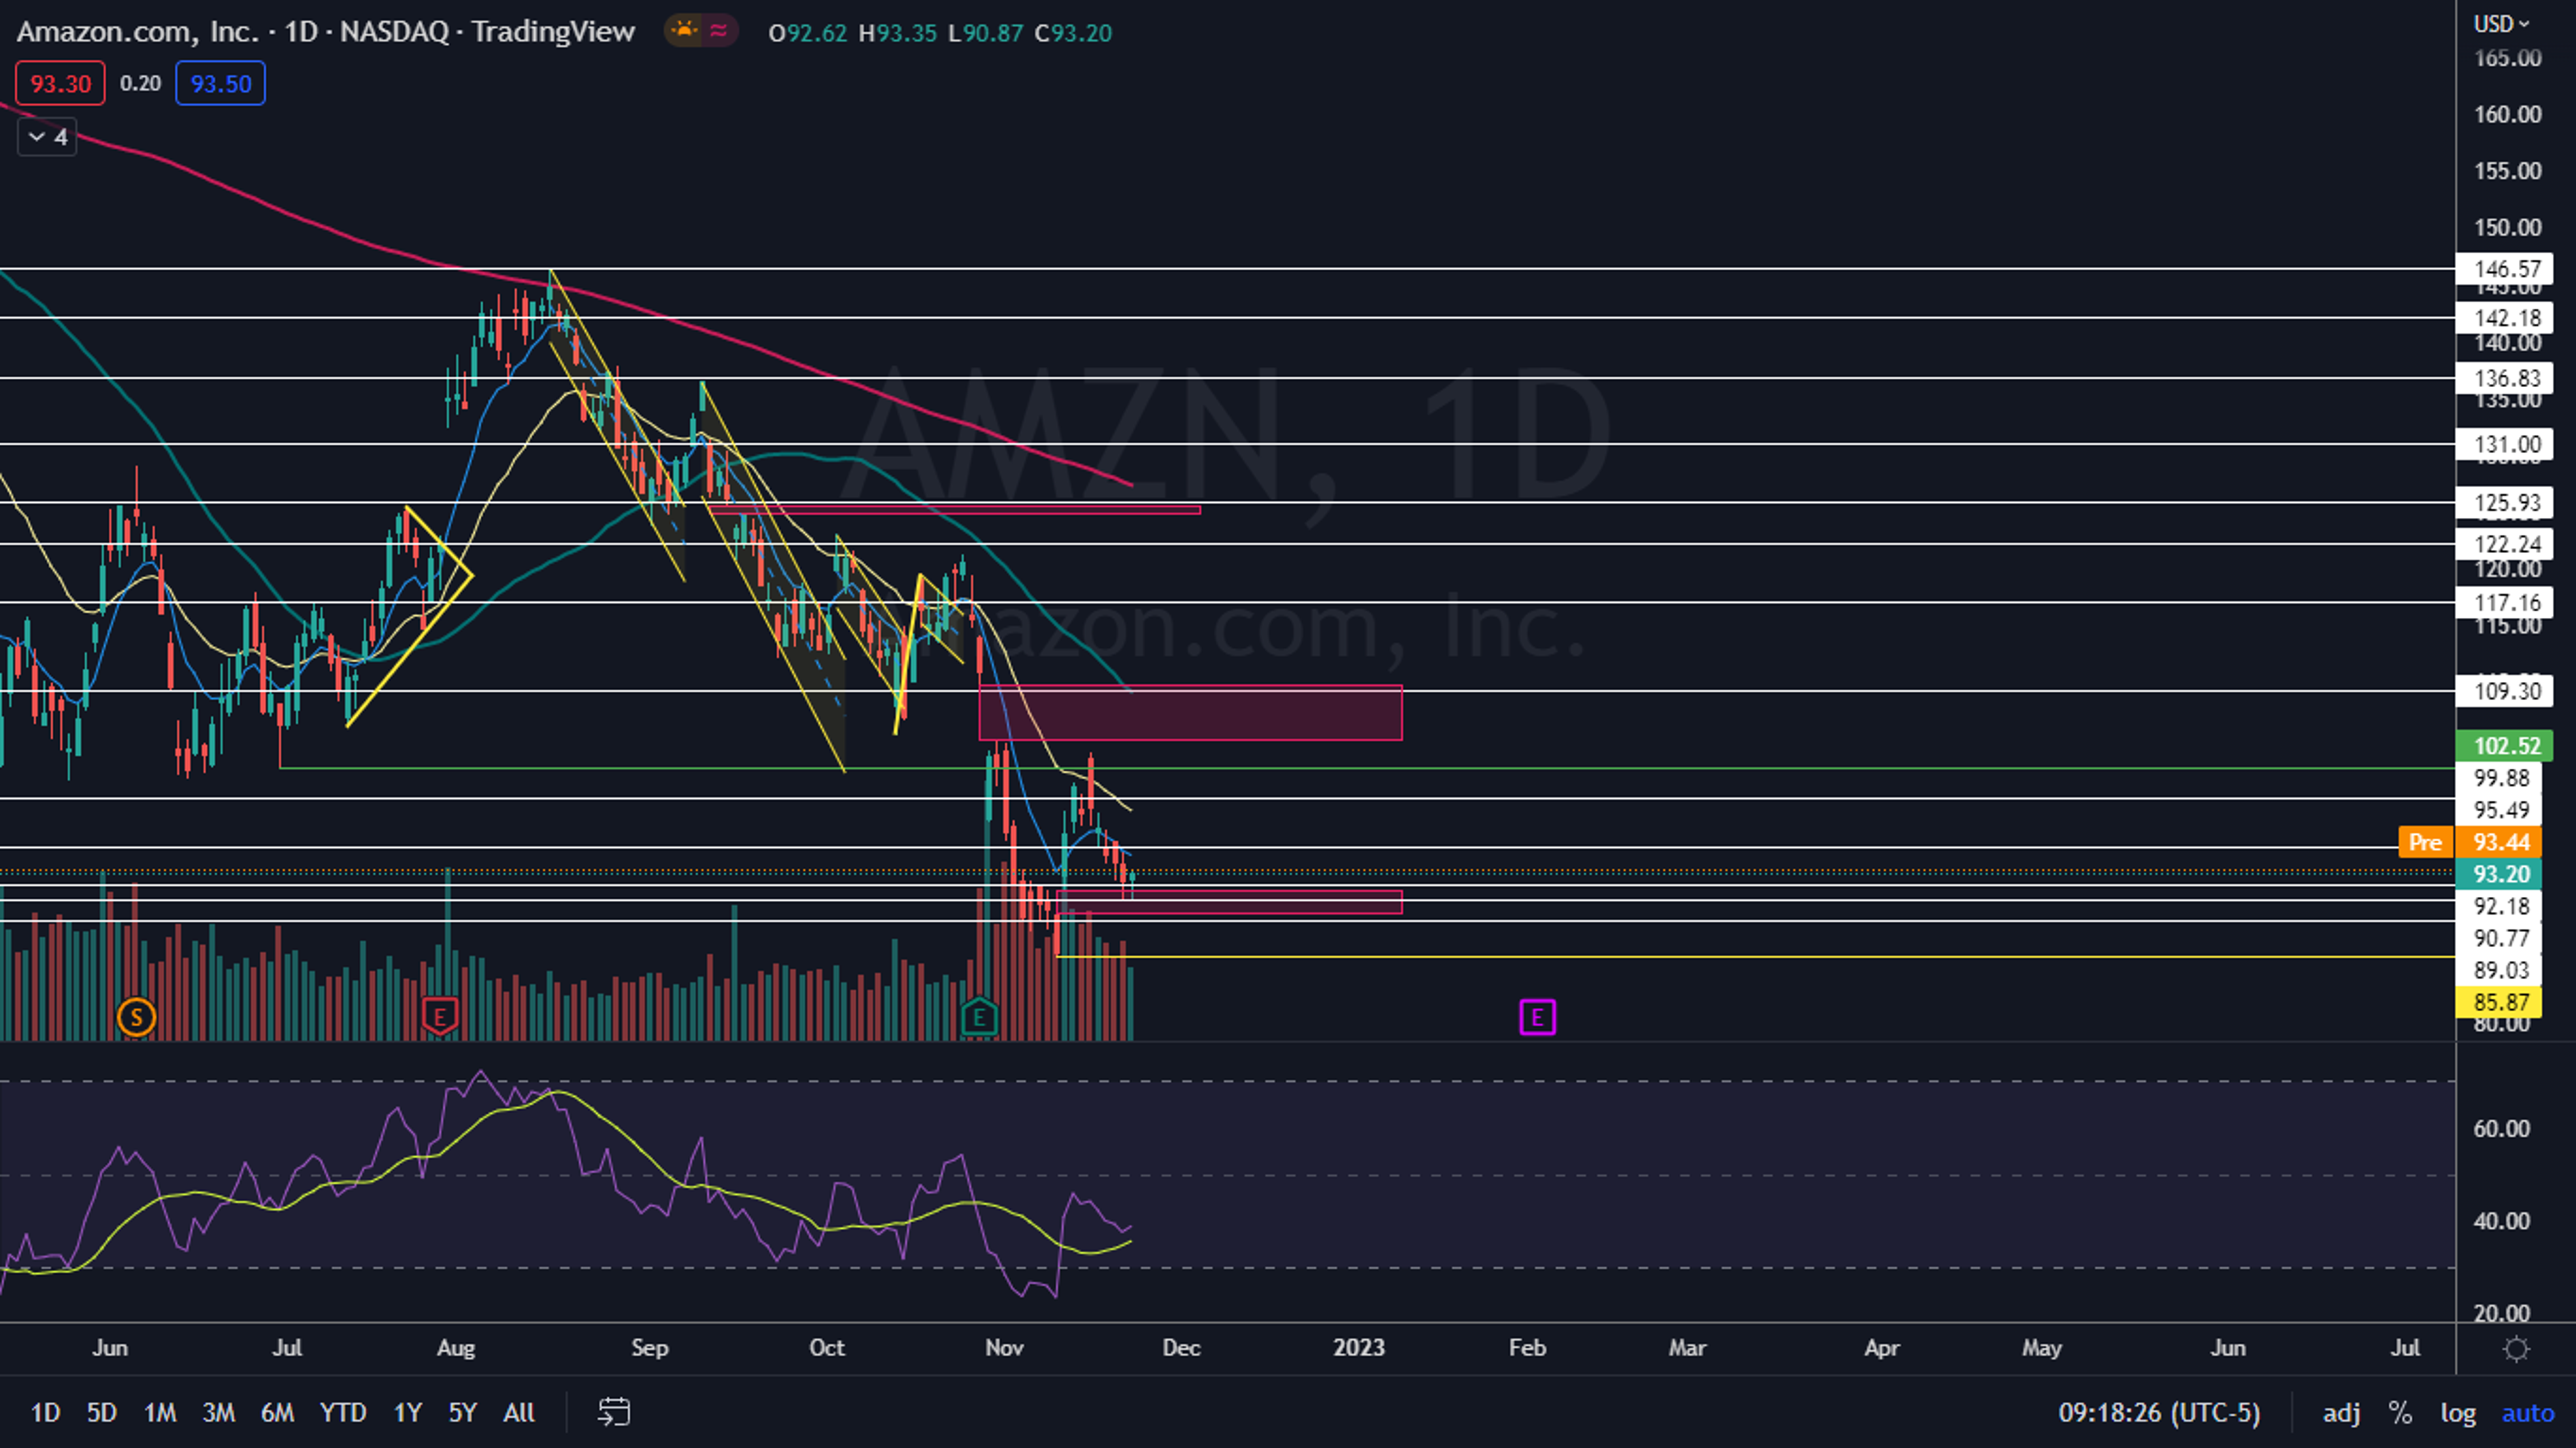
Amazon’s stock is down about 15% since Oct. 27 and has plunged about 45% since Jan. 3. In the short term, the stock looks set to bounce, however, having printed a tweezer bottom pattern on the daily chart.
Want direct analysis? Find me in the BZ Pro lounge! Click here for a free trial.
The Amazon Chart: Amazon formed a tweezer bottom pattern just above the $90 mark on Monday and Tuesday, which indicates a bounce could be on the horizon. A tweezer bottom pattern is created when a stock wicks up from a support zone on two consecutive occasions over any given time frame.
- If Amazon rebounds, the tweezer bottom pattern may serve as a higher low, which could indicate the downtrend the stock has been trading in since Aug. 16 is coming to an end. Although the downtrend may be negated, an uptrend won’t confirm unless Amazon goes on to form a higher high above $103.79 over the coming trading days.
- If Amazon rises above that level, a gap that exists between $104.87 and $109.77 will be within reach. If that happens, bearish traders can watch for the stock to print a possible bearish reversal candlestick near the top of the gap for a possible entry signal.
- Amazon has resistance above at $95.49 and $99.88 and support below at $92.18 and $90.77.

© 2024 Benzinga.com. Benzinga does not provide investment advice. All rights reserved.
Trade confidently with insights and alerts from analyst ratings, free reports and breaking news that affects the stocks you care about.

