


The Direxion Daily Retail Bull 3X Shares RETL was plunging more than 11% lower on Wednesday after Target Corporation TGT reported a big EPS miss.
RETL is a triple-leveraged fund designed to outperform S&P Retail Select Industry Index by 300%. The index includes a variety of companies from apparel and automotive to specialty stores, food retail and department stores.
Some of the more familiar names in the ETF include Amazon.com, Inc. AMZN, weighted at 0.58%, Dollar Tree Inc DLTR, weighted at 0.91% and Target Corporation, which is weighted at 0.8% within the ETF.
It should be noted that leveraged ETFs are meant to be used as a trading vehicle as opposed to long-term investments.
RETL was likely slipping on Wednesday to account for a big decline in Target, and other retail stocks that slid in tandem after Target reported a massive miss on its bottom line.
Read how analysts responded to Target’s third-quarter earnings print here
Want direct analysis? Find me in the BZ Pro lounge! Click here for a free trial.
The RETL Chart: RETL started trading in a fairly consistent uptrend on Sept. 30, with the most recent higher high formed on Tuesday at $9.78 and the most recent confirmed higher low printed at the $6.78 mark on Nov. 9. On Wednesday, RETL was working to print a bearish kicker candlestick on the daily chart, which could indicate lower prices will come on Thursday.
- If lower prices are on the horizon, bullish traders will be watching for RETL to eventually print a bearish reversal candlestick, such as a doji or hammer candlestick, above $7 to indicate the uptrend is intact and higher prices are in the cards. If the ETF falls under $7 or prints a lower high under $10, the uptrend will be negated.
- Short-term bullish traders will want to see RETL bounce up to close Wednesday’s session above the eight-day exponential moving average (EMA), which could cause the stock to print a hammer candlestick to indicate higher prices will come on Thursday. If the ETF closes the trading day under the eight-day EMA, RETL may find support at the 50-day simple moving average.
- RETL has resistance above at $8.79 and $9.38 and support below at $8.22 and $7.44.

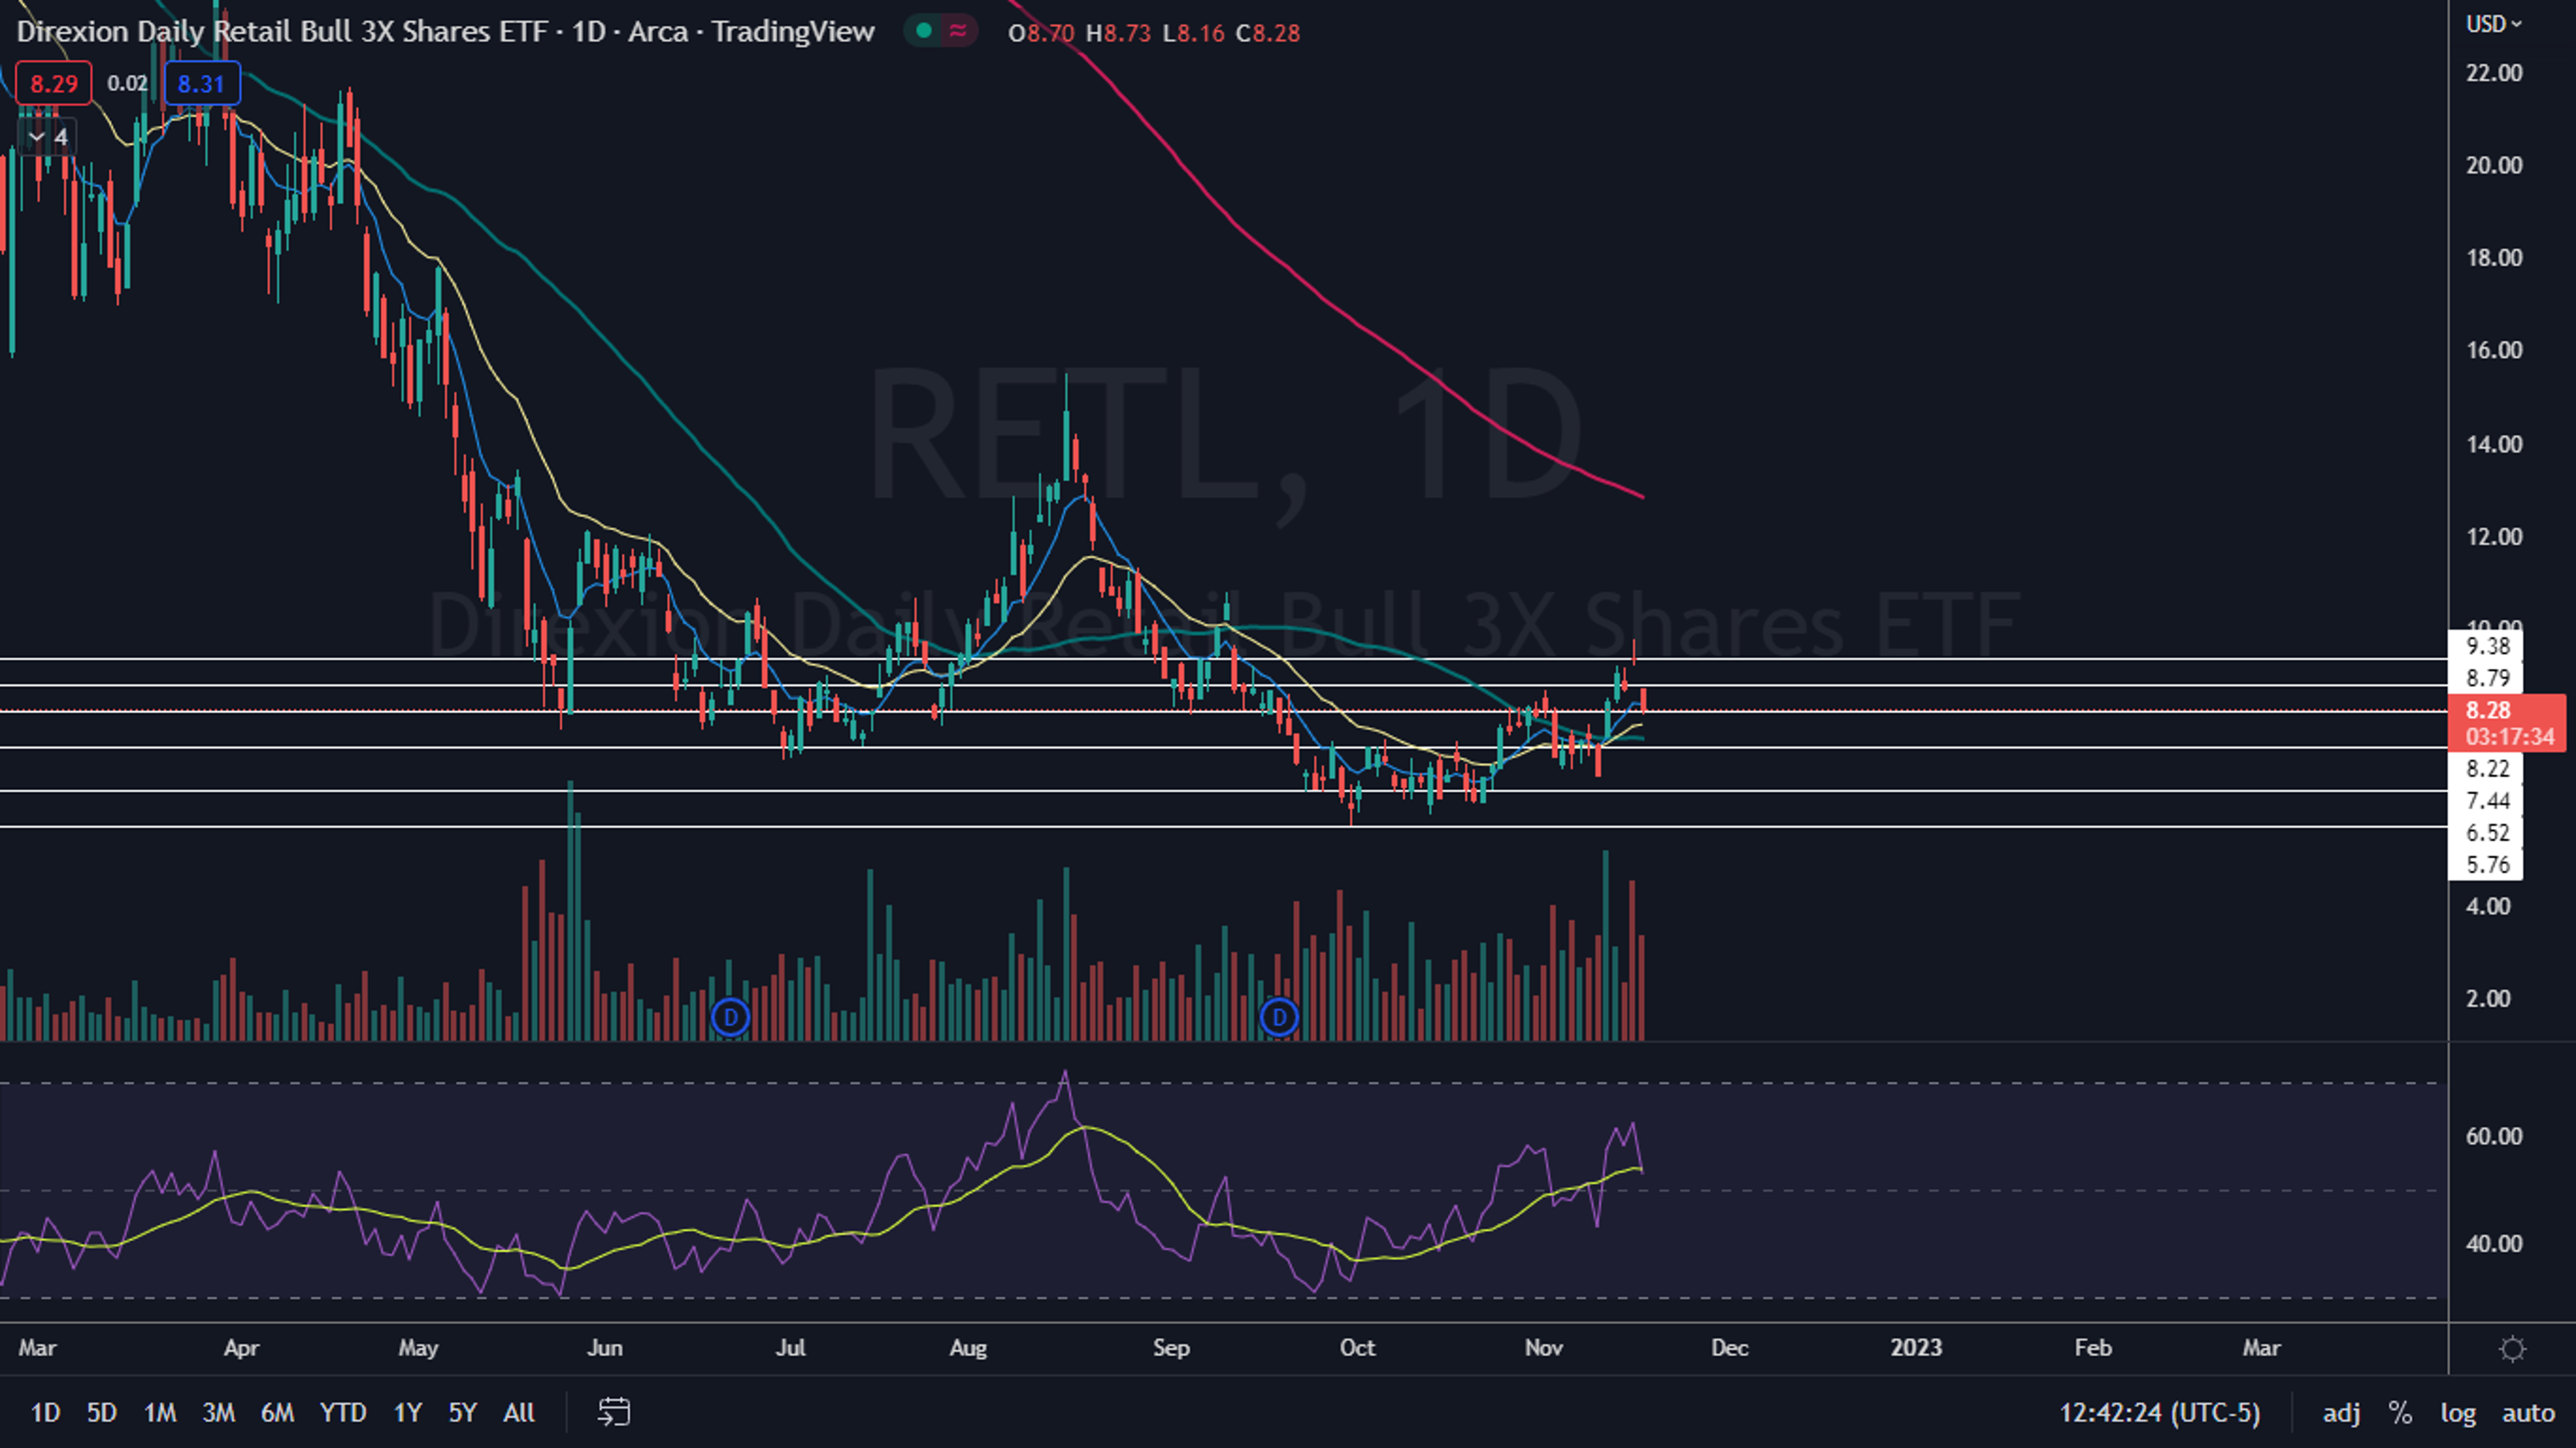
Photo: solarseven via Shutterstock
© 2024 Benzinga.com. Benzinga does not provide investment advice. All rights reserved.
Trade confidently with insights and alerts from analyst ratings, free reports and breaking news that affects the stocks you care about.

