


Direxion Energy Bull 2X Shares ERX was trading slightly lower in consolidation on Tuesday, after momentum within an uptrend caused the ETF to rally over 14% between Oct. 19 and Monday.
The energy sector has been enjoying a recent bull cycle, which began on Sept. 26 when Exxon Mobil Corp XOM bounced up off the 200-day simple moving average and reversed course into an uptrend.
Exxon was also consolidating on Tuesday, perhaps in preparation for a move before or after the oil and gas giant reports quarterly earnings on Friday.
See Also: How To Trade Alphabet Stock Before And After Q3 Earnings
ERX, a double-leveraged fund designed to outperform companies held in the S&P Energy Select Sector Index by 200%, includes a variety of energy-related stocks. A few of the top 10 names in the ETF include:
- Exxon and Chevron Corporation CVX, more than 31% of its weighted holdings.
- EOG Resources, Inc EOG, weighted at 3.25%
- ConocoPhillips COP, weighted at 3.33%
- Schlumberger N.V. SLB, weighted at 3.83%.
It's worth noting that leveraged ETFs are meant to be used as a trading vehicle as opposed to long-term investments.
Traders wishing to play the energy sector to the downside may consider the inverse ETF: Direxion Energy Bear 2X Shares ERY.
Want direct analysis? Find me in the BZ Pro lounge! Click here for a free trial.
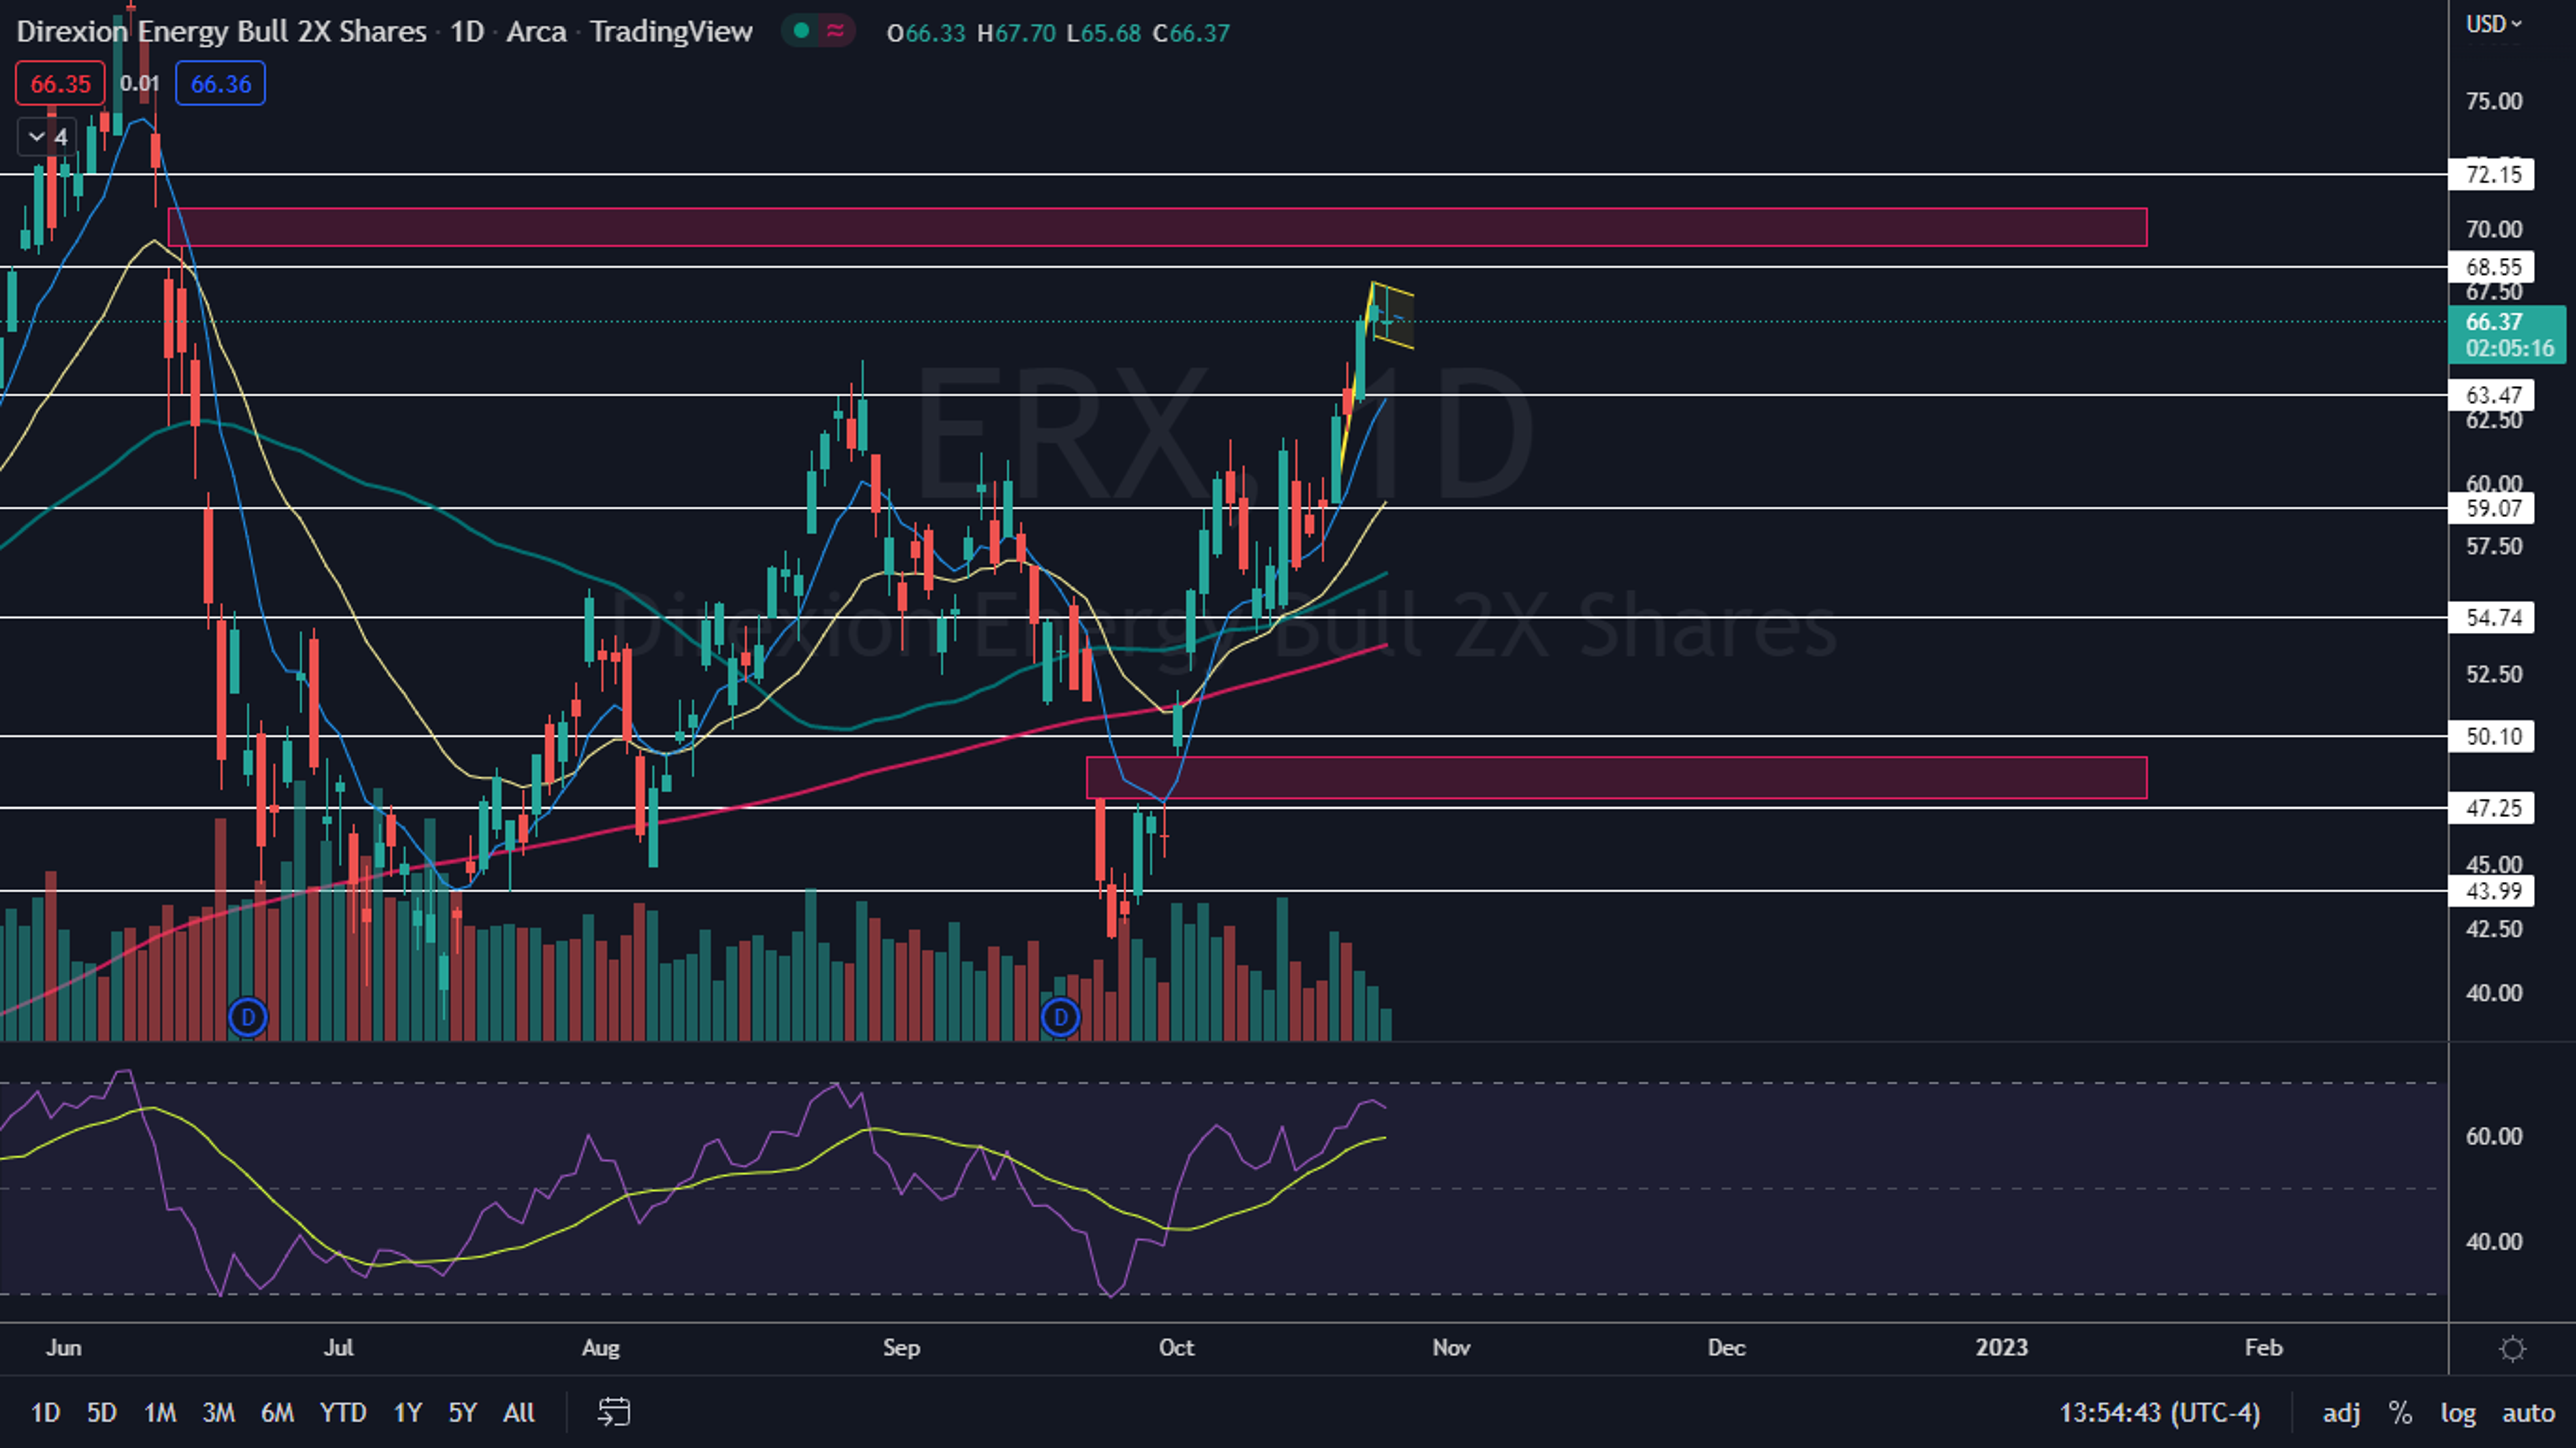
The ERX Chart: ERX was trading in an inside bar pattern Tuesday, with all of the price action taking place within Monday’s range. The inside bar leans bullish in this case because ERX was trading higher before forming the pattern.
- Traders can watch for a breakup or down from Monday’s mother bar on higher-than-average volume later on Tuesday or on Wednesday to gauge the future direction. If the ETF breaks up bullishly from the mother bar, a gap that exists between $69.23 and $70.80 is likely to fill.
- The inside bar on ERX could also be the beginning of a flag formation and paired with the four-day rise beginning Oct. 19, the ETF could be settling into a bull flag pattern on the daily chart. If the pattern becomes recognized, the measured move is about 15%, which indicates ERX could soar up toward $75.
- ERX has resistance above at $68.55 at $72.15 and supports below at $63.47 and $59.07.

© 2024 Benzinga.com. Benzinga does not provide investment advice. All rights reserved.
Trade confidently with insights and alerts from analyst ratings, free reports and breaking news that affects the stocks you care about.

