


Novavax Inc. NVAX shares were moving this week after the head of the Vaccines Task Force for the European Medicines Agency said Tuesday the company's COVID-19 vaccine could soon receive authorization in Europe.
Novavax shares were down 1.05% at $179.83 Thursday afternoon.
See Also: Novavax Stock Climbs Back Into Pattern On Vaccine News
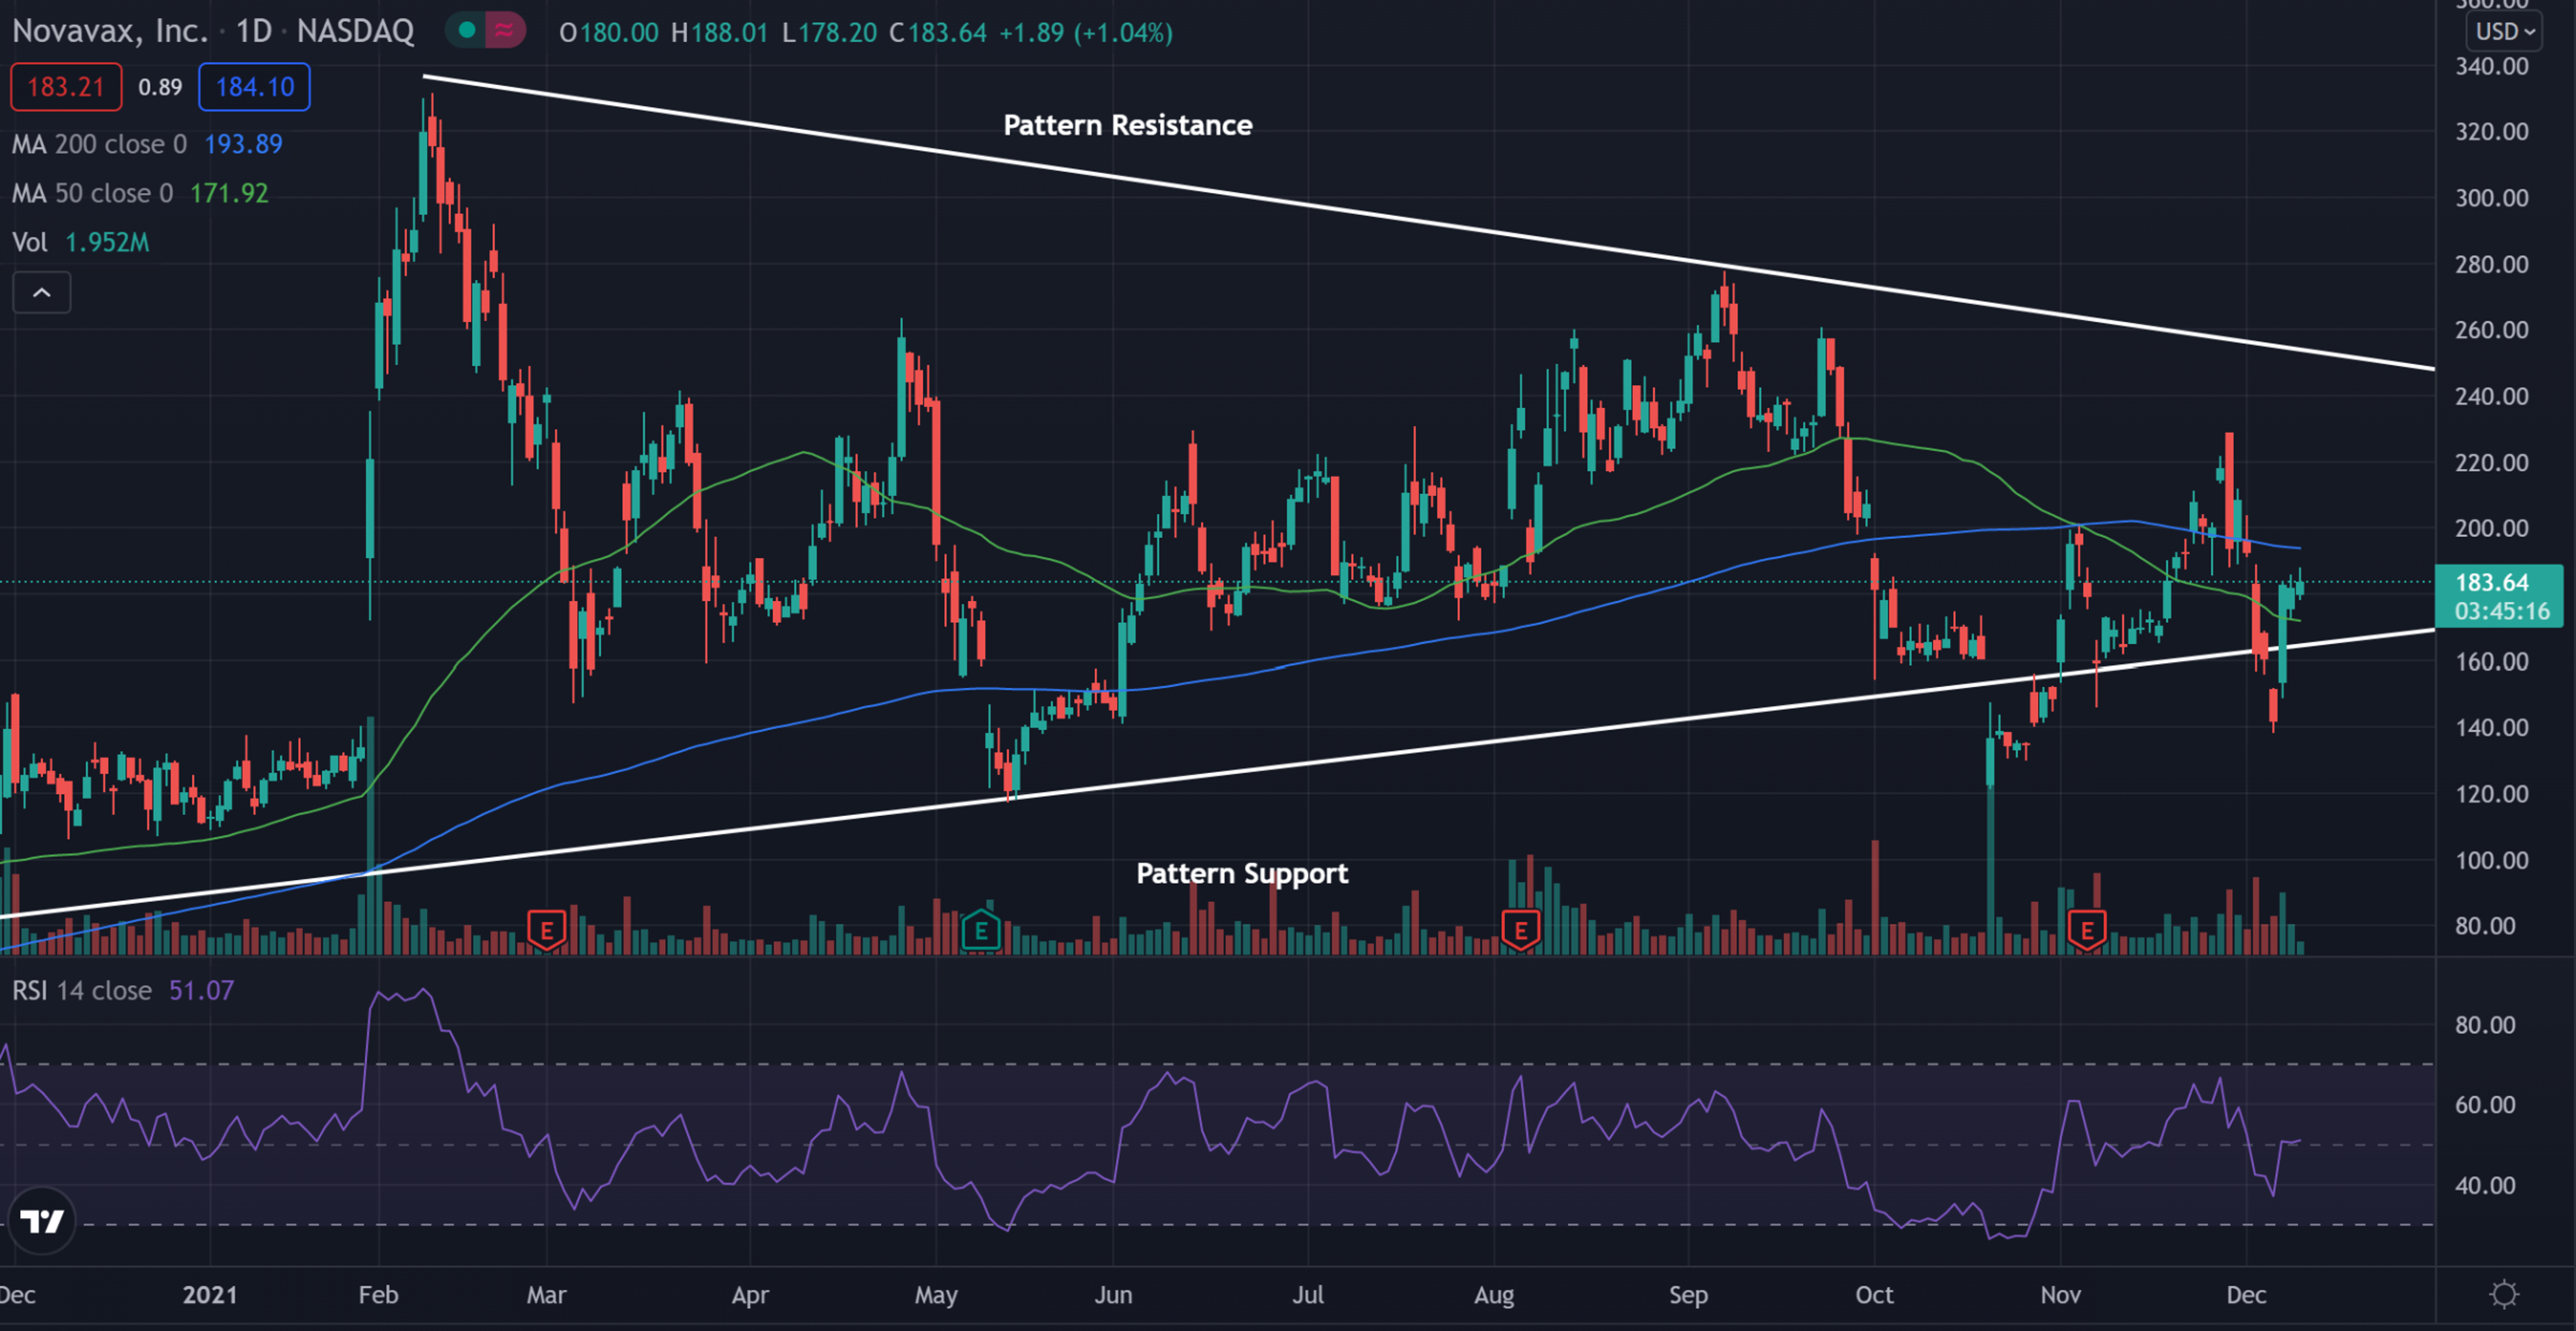
Novavax Daily Chart Analysis
- Shares are pushing higher in what traders call a pennant pattern, nearing an area of resistance. The stock has seen months of narrowing highs and lows and is nearing the end of the pattern, possibly getting ready to see a breakout in the near future.
- The stock trades above the 50-day moving average (green) but below the 200-day moving average (blue). This shows the stock is trading in a period of consolidation. The 50-day moving average may hold as support, while the 200-day moving average may act as resistance.
- The Relative Strength Index (RSI) has been trading sideways and sits at 52 on the chart. This shows the amount of buying and selling has been relatively equal the past few weeks.

What’s Next For Novavax?
Novavax climbing back into the pennant pattern seems to be a bullish signal. It shows the stock still has strength and that the stock can still make higher lows. Bulls are looking to see the pattern resistance break and for the stock to make a push higher. Bears are hoping the stock can fall back below the pattern support and begin to hold it as a resistance level.
© 2024 Benzinga.com. Benzinga does not provide investment advice. All rights reserved.
Trade confidently with insights and alerts from analyst ratings, free reports and breaking news that affects the stocks you care about.

