


MISSISSAUGA, ON / ACCESSWIRE / November 23, 2023 /
Quarterly Earnings Call:
8:30am EST, November 24, 2023, Participant call in number is 1-800-319-4610
Quarterly Highlights:
Consolidated Highlights:
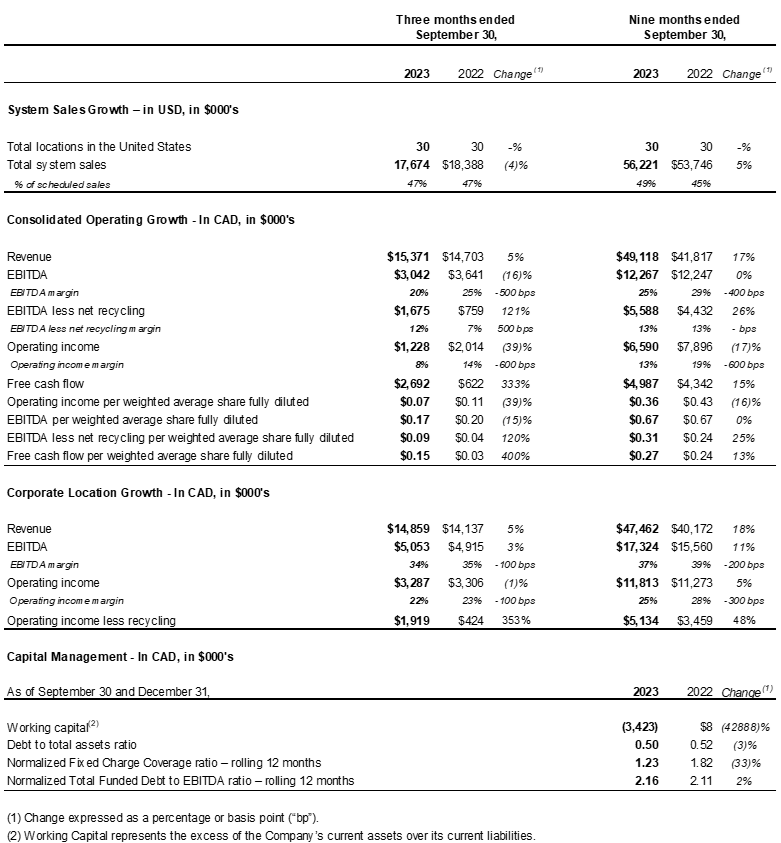
● | The Company generated revenue of $15.4 million CAD, growing $0.7 million CAD, or 5% versus Q3 2022. |
● | The Company generated free cash flow of $2.7 million CAD, growing $2.1 million CAD, or 333% versus Q3 2022. |
● | Consolidated EBITDA excluding the impact of net recycling revenue was $1.7 million, growing by $0.9 million CAD or 121% versus Q3 2022. |
● | Consolidated EBITDA for Q3 2023 was $3.0 million CAD, decreasing 16% versus Q3 2022, driven by lower net recycling revenue due to lower commodity paper prices. |
Corporate Locations Highlights:
● | Corporate location revenue for Q3 2023 grew 5% versus Q3 2022 to $14.9 million CAD (2% constant currency growth - US Dollars is the constant currency). |
● | Corporate location EBITDA grew 3% versus Q3 2022 to $5.0 million CAD (no change in constant currency growth). |
● | Same corporate location EBITDA was $4.6 million CAD, decreasing 6% versus Q3 2022 (9% constant currency decrease). |
Year-to-date Highlights:
Consolidated Highlights:
● | The Company generated revenue of $49.1 million CAD, growing $7.3 million CAD, or 17% versus Q3 2022 YTD. |
● | The Company generated free cash flow of $5.0 million CAD, growing $0.6 million CAD, or 15% versus Q3 2022 YTD. |
● | Consolidated EBITDA excluding the impact of net recycling revenue was $5.6 million CAD, growing by $1.2 million CAD or 26% versus Q3 2022 YTD. |
● | Consolidated EBITDA for Q3 2023 YTD was $12.3 million CAD, flat versus Q3 2022 YTD. |
Corporate Locations Highlights:
● | Corporate location revenue grew 18% versus Q3 2022 YTD to $47.5 million CAD (13% constant currency growth - US Dollars is the constant currency). |
● | Corporate location EBITDA grew 11% versus Q3 2022 YTD to $17.3 million CAD (6% constant currency growth). |
● | Same corporate location EBITDA was $15.6 million CAD, flat versus Q3 2022 YTD (4% constant currency decrease). |
Capital Management:
● | The Company generated $3.5 million CAD and $9.8 million CAD in cash from operations during Q3 2023 and Q3 2023 YTD, respectively. |
● | As at September 30, 2023, the Company has $3.6 million CAD in cash, $1 million CAD available on its operating line of credit, and $4.1 million CAD available on its non-revolving re-advanceable term loan. |
Management's Comments on Q3-2023
Jeffrey Hasham, the Company's Chief Executive Officer, noted "We are very pleased with our EBITDA less net recycling revenue growth of 121% during the third quarter of 2023. Our continued focus on route efficiencies and cost optimization were the main drivers of the $0.9 million increase in EBITDA less net recycling revenue. We continue to see strong demand for our core recurring shredding service offering, which has helped drive our organic shredding revenue growth of 9% in Q3 2023 versus Q3 2022. In addition, our new client relationship management system will allow us to increase sales efficiency and better connect with our customers moving forward. From a paper market perspective, paper prices have continued to decline, impacting our recycling revenue. We had anticipated this and continue to focus on growing our recurring revenue stream. Looking at our Proscan business, we saw strong revenue growth of 16% when compared to Q3 2022 and our pipeline of scanning projects remains strong.
During the quarter, we also completed the acquisitions of Proshred Baltimore and Security Shredding, which were accretive to the Company's EBITDA and cash flows. We also expect to realize further synergies from these acquisitions related to route densification and cost optimization that should enhance future margins.
For the quarter, I am also pleased that Q3 2023 free cash flow was $2.7 million Canadian, an increase of 333% from Q3 2022.
These results reflect the hard work and commitment of our employees, franchisees, management and board members, and I would like to personally thank each of them for their efforts and contributions."

Revenue Growth
The Company achieved 5% total revenue growth during Q3 2023 versus Q3 2022 and 17% total revenue growth during Q3 2023 YTD versus Q3 2022 YTD, primarily due to acquisitions conducted during the last 12 months and organic sales growth from new customers and price increases, partially offset by a decrease in recycling revenue from lower commodity paper prices.
Corporate Locations Q3 2023 Performance
Total corporate location revenue and EBITDA grew by 5% and 3%, respectively, in Q3 2023 versus Q3 2022.
Same corporate location operating income, excluding the impact of net recycling revenue, grew 324% in Q3 2023 versus Q3 2022. Same corporate location shredding revenue grew by 9% in Q3 2023 versus Q3 2022, with same corporate location EBITDA decreasing by 6%, driven by lower commodity paper pricing.
| Total Corporate Locations | Same Corporate Locations | Non-same Corporate Locations | ||||||||||||||
| For the three months | ||||||||||||||||
| ended September 30, | 2023 | 2022 | % Change | 2023 | 2022 | % Change | 2023 | 2022 | ||||||||
| $ | $ | $ | $ | $ | $ | |||||||||||
| Revenue: | ||||||||||||||||
| Shredding sales | 12,220 | 10,127 | 21% | 11,087 | 10,127 | 9% | 1,133 | - | ||||||||
| Secure E-cycle Electronic waste sales | 351 | 351 | 0% | 351 | 351 | 0% | - | - | ||||||||
| Scanning sales | 624 | 536 | 17% | 624 | 536 | 17% | - | - | ||||||||
| Recycling sales | 1,663 | 3,123 | (47)% | 1,430 | 3,123 | (54)% | 234 | - | ||||||||
| Total sales | 14,859 | 14,137 | 5% | 13,492 | 14,137 | (5)% | 1,367 | - | ||||||||
| Operating costs (1) | 9,807 | 9,222 | 6% | 8,895 | 9,222 | (4)% | 912 | - | ||||||||
| EBITDA | 5,052 | 4,915 | 3% | 4,597 | 4,915 | (6)% | 455 | - | ||||||||
| % of revenue | 34% | 35% | (100) bps | 34% | 35% | (100) bps | 33% | - | ||||||||
| Depreciation - tangible assets | 1,766 | 1,609 | 10% | 1,597 | 1,609 | (1)% | 169 | - | ||||||||
| Operating income | 3,286 | 3,306 | (1)% | 3,000 | 3,306 | (9)% | 286 | - | ||||||||
| % of revenue | 22% | 23% | (100) bps | 22% | 23% | (100) bps | 21% | - | ||||||||
| Operating income less net recycling | 1,918 | 424 | 353% | 1,799 | 424 | 324% | 119 | - | ||||||||
| % of revenue | 14% | 4% | 1,000 bps | 15% | 4% | 1,100 bps | 10% | |||||||||
| EBITDA - in USD | 3,769 | 3,757 | 0% | 3,430 | 3,757 | (9)% | 339 | - | ||||||||
| % of revenue | 34% | 35% | (100) bps | 34% | 35% | (700) bps | 33% | |||||||||
Note 1: During Q3 2023, acquisition/vendor-related consulting fees of $22 (Q3 2022 - $211) are included in the total and non-same corporate location operating costs.
Corporate Locations Q3 2023 YTD Performance
Total corporate location revenue and EBITDA grew by 18% and 11%, respectively, in Q3 2023 YTD versus Q3 2022 YTD.
Same corporate location operating income, excluding the impact of net recycling revenue, grew 46% in Q3 2023 YTD versus Q3 2022 YTD. Same corporate location shredding revenue grew by 16% in Q3 2023 YTD versus Q3 2022 YTD, with same corporate location EBITDA remaining flat, driven by lower commodity paper pricing.
| Total Corporate Locations | Same Corporate Locations | Non-same Corporate Locations | ||||||||||||||
| For the nine months | ||||||||||||||||
| ended September 30, | 2023 | 2022 | % Change | 2023 | 2022 | % Change | 2023 | 2022 | ||||||||
| $ | $ | $ | $ | $ | $ | |||||||||||
| Revenue: | ||||||||||||||||
| Shredding sales | 37,131 | 28,654 | 30% | 33,132 | 28,654 | 16% | 3,999 | - | ||||||||
| Secure E-cycle Electronic waste sales | 1,049 | 1,026 | 2% | 1,049 | 1,026 | 2% | - | - | ||||||||
| Scanning sales | 1,719 | 2,000 | (14)% | 1,719 | 2,000 | (14)% | - | - | ||||||||
| Recycling sales | 7,563 | 8,490 | (11)% | 6,499 | 8,490 | (23)% | 1,064 | - | ||||||||
| Total sales | 47,462 | 40,170 | 18% | 42,399 | 40,170 | 6% | 5,063 | - | ||||||||
| Operating costs(1) | 30,138 | 24,610 | 22% | 26,792 | 24,610 | 9% | 3,346 | - | ||||||||
| EBITDA | 17,324 | 15,560 | 11% | 15,607 | 15,560 | -% | 1,717 | - | ||||||||
| % of revenue | 37% | 39% | (200) bps | 37% | 39% | (200) bps | 34% | - | ||||||||
| Depreciation - tangible assets | 5,511 | 4,287 | 29% | 4,876 | 4,287 | 14% | 635 | - | ||||||||
| Operating income | 11,813 | 11,273 | 5% | 10,731 | 11,273 | (5)% | 1,082 | - | ||||||||
| % of revenue | 25% | 28% | (300) bps | 25% | 28% | (300) bps | 21% | - | ||||||||
| Operating income less net recycling | 5,136 | 3,459 | 49% | 5,033 | 3,459 | 46% | 103 | - | ||||||||
| % of revenue | 13% | 11% | 200 bps | 14% | 11% | 300 bps | 3% | |||||||||
| EBITDA - in USD | 12,874 | 12,129 | 6% | 11,599 | 12,129 | (4)% | 1,275 | - | ||||||||
| % of revenue | 37% | 39% | (200) bps | 37% | 39% | (200) bps | 34% | |||||||||
Note 1: During the nine months ended September 30, 2023, acquisition/vendor-related consulting fees of $307 (nine months ended September 30, 2022- $366) are included in the total and non-same operating costs.
Community and Social Commitment
Our locations under the PROSHRED® banner conduct numerous community shredding events. These events provide an opportunity for our clients, clients' employees, local businesses and local residents to ensure their personal and confidential materials are securely destroyed. In addition to helping to reduce identity theft, several of these events allow for donations to various not-for-profit organizations. PROSHRED® is also proud that 100% of the shredded material is recycled, as our continued goal is to foster the use of fewer trees in the production of all paper products. Future community shredding event locations can be found on our website, www.proshred.com. Our annual national Shred Cancer event was held in June of 2023 at various Proshred locations. These events are held to raise research funds for the American Institute for Cancer Research ("AICR"). It is our goal as a Company and Franchise System to support AICR in their endeavor to prevent cancer and possibly cure this disease. So far, PROSHRED® has raised over USD$239,000 for this cause. Please visit www.proshred.com/aicr for more information on this effort.
Non-IFRS Measures
There are measures included in this press release that do not have a standardized meaning under International Financial Reporting Standards ("IFRS") and therefore may not be comparable to similarly titled measures presented by other publicly traded companies. The Company includes these measures as a means of measuring financial performance of the Company.
| ● | Total System Sales are sales generated by franchisees, licensees and corporately operated locations. The system sales generated by franchisees and licensees drive the Company's royalties. The system sales generated by corporate locations are included in the Company's revenue. |
| ● | Same Location are indicators of performance of corporately operated locations that have been in the system for equivalent periods in both the current period and the comparative period. |
| ● | Consolidated EBITDA is defined as earnings before interest, taxes, depreciation and amortization. Consolidated EBITDA also excludes government assistance, re-measurements of contingent consideration, foreign exchange gains and losses, and gains and losses on disposal of tangible assets. A reconciliation between net income and consolidated EBITDA is provided below. |
| ● | Consolidated EBITDA less Net Recycling is defined as the consolidated EBITDA excluding the impact of corporate location recycling sales, net of paper baling costs. A reconciliation between net income and consolidated EBITDA less net recycling is provided below. |
| ● | Consolidated Operating Income is defined as revenues less all operating expenses, including depreciation on tangible assets. Amortization for intangible assets has not been included in this calculation. A reconciliation between net income and consolidated operating income is provided below. |
| ● | Consolidated Free Cash Flow is defined as cash provided by operating activities net of capital expenditures. The calculation of Consolidated Free Cash Flow that begins with cash provided by operating activities is provided below. |
| ● | Capital Expendituresis defined as the purchase of tangible and intangible assets, net of proceeds received from their disposal. |
| ● | Corporate Location EBITDA is defined as earnings for corporately operated locations before interest, taxes, depreciation and amortization and also excludes items identified under the definition of Consolidated EBITDA above. |
| ● | Corporate Location Operating Income is the income generated by corporately operated locations. The operating income generated is inclusive of depreciation on tangible assets, including trucks, right-of-use-assets and secure collection containers. It does not include amortization related to intangibles assets and interest expense. |
| ● | Corporate Location Operating Income less Net Recycling is the corporate location operating income excluding the impact of corporate location recycling sales, net of paper baling costs. |
| ● | Margin is the percentage of revenue that has turned into EBITDA or Operating Income. Margin is defined as EBITDA or operating income divided by revenue. |
| ● | Constant currency is a measure of growth before foreign currency translation impacts. It is defined as the current period results in CAD currency using the foreign exchange rate in the equivalent prior year period. This allows for period over period comparisons of business performance excluding the impact of currency fluctuations. |
Reconciliation of EBITDA and EBITDA less net recycling to Operating Income
| For the three months ended September 30, | For the nine months ended September 30, | |||||
| 2023 | 2022 | % Change | 2023 | 2022 | % Change | |
| $ | $ | $ | $ | |||
| EBITDA | 3,042 | 3,641 | (16)% | 12,267 | 12,247 | 0% |
| Less: net recycling revenue | (1,367) | (2,882) | (53)% | (6,679) | (7,815) | (15)% |
| EBITDA less net recycling | 1,675 | 759 | 121% | 5,588 | 4,432 | 26% |
| Add: net reycling revenue | 1,367 | 2,882 | (53)% | 6,679 | 7,815 | (15)% |
| Less: depreciation - tangible assets | (1,814) | (1,627) | 11% | (5,677) | (4,351) | 30% |
| Operating income | 1,228 | 2,014 | (39)% | 6,590 | 7,896 | (17)% |
Reconciliation of Operating Income to Net Income
| For the three months ended September 30, | For the nine months ended September 30, | |||||
| 2023 | 2022 | % Change | 2023 | 2022 | % Change | |
| $ | $ | $ | $ | |||
| Operating income | 1,228 | 2,014 | (39)% | 6,590 | 7,896 | (17)% |
| Less: interest expense | (629) | (407) | 55% | (1,881) | (1,193) | 58% |
| Add: interest income | 5 | 11 | (55)% | 14 | 11 | 27% |
| Less: amortization - intangible assets | (1,020) | (837) | 22% | (3,041) | (2,414) | 26% |
| Add: gain on disposition of tangible assets | 17 | 31 | (45)% | 17 | 51 | (67)% |
| Add: remeasurement of contingent consideration | 264 | 154 | 71% | 119 | 117 | 2% |
| Add: Other Income | 106 | - | 100% | 106 | - | 100% |
| Add/(deduct): foreign exchange gain (loss) | 1,254 | 3,263 | (62)% | (152) | 4,046 | (104)% |
| Income before income tax taxes | 1,225 | 4,229 | (71)% | 1,772 | 8,514 | (79)% |
| Deduct: Income tax expense | (157) | (342) | (54)% | (939) | (1,541) | (39)% |
| Net income | 1,068 | 3,887 | (73)% | 833 | 6,973 | (88)% |
Reconciliation of Consolidated Free Cash Flow with Cash Provided by Operations
For the three months ended | For the nine months ended | |||||
September 30, | September 30, | |||||
2023 | 2022 | % Change | 2023 | 2022 | % Change | |
$ | $ | $ | $ | |||
| Cash provided by operations | 3,539 | 3,293 | 7% | 9,824 | 8,650 | 14% |
| Less: Capital expenditures | (847) | (2,671) | (68)% | (4,837) | (4,308) | 12% |
| Free Cash Flow | 2,692 | 622 | 333% | 4,987 | 4,342 | 15% |
Financial Statements
Redishred's September 30, 2023 Financial Statements and Management's Discussion and Analysis will be available on www.sedar.comand www.redishred.com.
About Redishred Capital Corp.
Redishred Capital Corp. ("Redishred") is the owner of the PROSHRED®, PROSCANand secure e-Cycle brands, trademarks and intellectual property in the United States. Redishreddigitizes, secures, shreds and recycles confidential documents and proprietary materials for thousands of customers in the United States in all industry sectors. Redishred is a pioneer in the mobile document destruction and recycling industry and has the ISO 9001:2015 certification. It is Redishred'svision to be the ‘system of choice' in providing digital retention, secure shredding and recycling services on a global basis. Redishred Capital Corp. grants PROSHRED`and PROSCANfranchise businesses in the United States and by way of a license arrangement in the Middle East. Redishredalso operates sixteen corporate businesses directly. The Company's plan is to grow its business by way of both franchising and the acquisition and operation of information security businesses that generate stable and recurring cash flow through a scheduled client base, continuous paper recycling and concurrent unscheduled shredding service.
FOR FURTHER INFORMATION PLEASE CONTACT:
Redishred Capital Corp. (TSX.V - KUT)
Jeffrey Hasham, MBA, CPA, CA
Chief Executive Officer
Jeffrey.hasham@redishred.com
www.redishred.com
Phone: (416) 849-3469 Fax: (905) 812-9448
or,
Redishred Capital Corp. (TSX.V - KUT)
Harjit Brar, CPA, CA
Senior Vice President and Chief Financial Officer
harjit.brar@redishred.com
www.redishred.com
Phone: (437) 328-6639 Fax: (905) 812-9448
Note: Neither TSX Venture Exchange nor its Regulation Services Provider (as that term is defined in the policies of the TSX Venture Exchange) accepts responsibility for the adequacy or accuracy of this release.
This news release contains forward looking statements that reflect the current expectations of management of Redishred and Redishred's future results, performance, achievements, prospects and opportunities. Wherever possible, words such as "may", "will", "estimate", "believe", "expect", "intend" and similar expressions have been used to identify these forward looking statements. These statements reflect current beliefs and are based on information currently available to management of Redishred. Forward looking statements necessarily involve known and unknown risks, uncertainties and other factors. A number of factors, including those discussed in Redishred's 2022 Management Discussion and Analysis under "Risk Factors", could cause actual results, performance, achievements, prospects or opportunities to differ materially from the results discussed or implied in the forward looking statements. These factors should be considered carefully and a reader should not place undue reliance on the forward looking statements. There can be no assurance that the expectations of management of Redishred will prove to be correct. Readers are cautioned that such forward looking statements are subject to certain risks and uncertainties that could cause actual results to differ materially from these statements. Redishred can give no assurance that actual results will be consistent with these forward-looking statements.
https://www.accesswire.com/809709/redishred-capital-corp-redishred-or-the-company-announces-strong-q3-2023-results

© 2024 Benzinga.com. Benzinga does not provide investment advice. All rights reserved.
Date | ticker | name | Actual EPS | EPS Surprise | Actual Rev | Rev Surprise |
|---|
Trade confidently with insights and alerts from analyst ratings, free reports and breaking news that affects the stocks you care about.

