


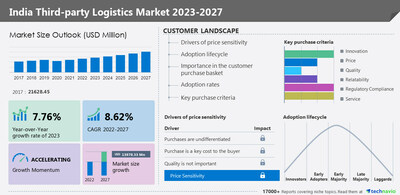
NEW YORK, June 7, 2023 /PRNewswire/ -- The third-party logistics market in India is estimated to grow by USD 13,978.33 million during 2022-2027. However, the growth momentum will progress at a CAGR of 8.62% during the forecast period. The market is segmented by service (transportation, warehousing and distribution, and VAS) and end-user (manufacturing, consumer goods, food and beverage, automotive, and others). The market share growth by the transportation segment will be significant for overall market growth during the forecast period. Goods are transported in third-party logistics markets using various means of transport such as road, rail, air and water. In India, most goods are transported by road. Logistics services require significant investment and expertise, significantly increasing operating costs, so many companies outsource these services to external logistics providers. Such factors will increase segment growth during the forecast period. Download a Sample Report Now!

Information Services Market Insights -
- Vendors: 15+, Including AP Moller Maersk AS, Aegis Logistics Ltd., Allcargo Logistics Ltd., AWL India Pvt. Ltd., Delhivery Ltd., FedEx Corp., Gati Ltd., Mahindra Logistics Ltd., Meesan Logistics Pvt. Ltd., Pyramis Cargo Management Pvt. Ltd., SICAL Logistics Ltd., United Parcel Service Inc., VRL Logistics Ltd., ARK Supply Chain Solutions Pvt. Ltd., Blue Dart Express Ltd., Container Corp. of India Ltd., Deutsche Bahn AG, Safexpress Pvt. Ltd., T V Sundram Iyengar and Sons Ltd., and TCI Express Ltd., among others
- Coverage: Parent market analysis; key drivers, major trends, and challenges; customer and vendor landscape; vendor product insights and recent developments; key vendors; and market positioning of vendors
- Segments: Service (Transportation, Warehousing and distribution, and VAS) and End-user (Manufacturing, Consumer goods, Food and beverage, Automotive, and Others)
To understand more about the information services market, request a sample report
Third-party logistics market in India - Vendor Insights
The growing competition in the market is compelling vendors to adopt various growth strategies such as promotional activities and spending on advertisements to improve the visibility of their services. Technavio report analyzes the market's competitive landscape and offers information on several market vendors, including AP Moller Maersk AS, Aegis Logistics Ltd., Allcargo Logistics Ltd., AWL India Pvt. Ltd., Delhivery Ltd., FedEx Corp., Gati Ltd., Mahindra Logistics Ltd., Meesan Logistics Pvt. Ltd., Pyramis Cargo Management Pvt. Ltd., SICAL Logistics Ltd., United Parcel Service Inc., VRL Logistics Ltd., ARK Supply Chain Solutions Pvt. Ltd., Blue Dart Express Ltd., Container Corp. of India Ltd., Deutsche Bahn AG, Safexpress Pvt. Ltd., T V Sundram Iyengar and Sons Ltd., and TCI Express Ltd.
Third-party Logistics Market in India – Market Dynamics
Major Trends -
- The modernization of logistics infrastructure in India is an emerging trend impacting the market.
- The Government of India offers various initiatives to help companies leverage their economies at scale and provide cost-effective integrated logistics networks.
- For instance, logistics parks are constructed across India, which act as centers for freight aggregation and distribution hubs, storage, warehousing, and multimodal transportation, and the government has also been working toward the construction of dedicated freight corridors.
- Therefore, the rise in the modernization of logistics infrastructure is likely to boost the 3PL market in India during the forecast period.
Key Challenges -
- The high operational costs are a major challenge that may impede market growth.
- Transportation costs form a major part of logistics costs, and the volatility in fuel prices in India is contributing to the rise in transportation costs.
- As fuel prices increase, logistics service providers charge customers to achieve profits.
- However, logistics service providers in the market are also under excessive pricing pressure from customers to reduce rates.
- Further, the availability of inadequate logistics infrastructure in the country also increases operational costs.
- Additionally, the unorganized and inefficient logistics supply chain in India results in various indirect costs such as inventory carrying costs, as well as damages and losses to goods in transit.
Drivers, trends and challenges have an impact on market dynamics, which can impact businesses. Find more insights in a sample report!
The third-party logistics market in India report provides critical information and factual data, with a qualitative and quantitative study of the market based on market drivers and limitations as well as future prospects.
Why Buy?
- Add credibility to strategy
- Analyzes competitor's offerings
- Get a holistic view of the market
Grow your profit margin with Technavio- Buy the Report
What are the key data covered in this Third-party Logistics Market report in India?
- CAGR of the market during the forecast period
- Detailed information on factors that will drive the growth of the Third-party Logistics Market In India between 2023 and 2027
- Precise estimation of the size of the Third-party Logistics Market In India size and its contribution to the market in focus on the parent market
- Accurate predictions about upcoming trends and changes in consumer behavior
- Growth of the Third-party Logistics Market In India industry across India
- A thorough analysis of the market's competitive landscape and detailed information about vendors
- Comprehensive analysis of factors that will challenge the growth of Third-party Logistics Market In India vendors
Gain instant access to 17,000+ market research reports.
Technavio's SUBSCRIPTION platform
Related Reports:
- The US third-party logistics (3PL) market is estimated to grow at a CAGR of 8.42% between 2022 and 2027, and the size of the market is forecast to increase by USD 117.1 billion. This US third-party logistics (3PL) market report extensively covers market segmentation by end-user (retail, manufacturing, automotive, food and beverages, and others) and service (transportation, warehousing and distribution, and others). The increasing use of multimodal transport is the key factor driving the growth of the US 3PL market.
- Europe Third-Party Logistics (3PL) Market size is estimated to grow at a CAGR of 24.7% between 2022 and 2027, and the size of the market is forecast to increase by USD 458.87 billion. Europe third-party logistics market report extensively covers market segmentation by end-user (manufacturing, retail, consumer goods, healthcare, and others) and service (transportation, warehousing and distribution, and others). The growing complexity of in-house logistics operations is notably driving Europe 3PL market growth.
Third-party Logistics Market Scope In India | |
Report Coverage | Details |
Base year | 2022 |
Historic period | 2017-2021 |
Forecast period | 2023-2027 |
Growth momentum & CAGR | Accelerate at a CAGR of 8.62% |
Market growth 2023-2027 | USD 13,978.33 million |
Market structure | Fragmented |
YoY growth 2022-2023 (%) | 7.76 |
Competitive landscape | Leading Vendors, Market Positioning of Vendors, Competitive Strategies, and Industry Risks |
Key companies profiled | AP Moller Maersk AS, Aegis Logistics Ltd., Allcargo Logistics Ltd., AWL India Pvt. Ltd., Delhivery Ltd., FedEx Corp., Gati Ltd., Mahindra Logistics Ltd., Meesan Logistics Pvt. Ltd., Pyramis Cargo Management Pvt. Ltd., SICAL Logistics Ltd., United Parcel Service Inc., VRL Logistics Ltd., ARK Supply Chain Solutions Pvt. Ltd., Blue Dart Express Ltd., Container Corp. of India Ltd., Deutsche Bahn AG, Safexpress Pvt. Ltd., T V Sundram Iyengar and Sons Ltd., and TCI Express Ltd. |
Market dynamics | Parent market analysis, Market growth inducers and obstacles, Fast-growing and slow-growing segment analysis, COVID-19 impact and recovery analysis and future consumer dynamics, Market condition analysis for forecast period. |
Customization purview | If our report has not included the data that you are looking for, you can reach out to our analysts and get segments customized. |
Table of Contents:
1 Executive Summary
- 1.1 Market overview
- Exhibit 01: Executive Summary – Chart on Market Overview
- Exhibit 02: Executive Summary – Data Table on Market Overview
- Exhibit 03: Executive Summary – Chart on Country Market Characteristics
- Exhibit 04: Executive Summary – Chart on Market Segmentation by Service
- Exhibit 05: Executive Summary – Chart on Market Segmentation by End-user
- Exhibit 06: Executive Summary – Chart on Vendor Market Positioning
2 Market Landscape
- 2.1 Market ecosystem
- Exhibit 07: Parent market
- Exhibit 08: Market Characteristics
3 Market Sizing
- 3.1 Market definition
- Exhibit 09: Offerings of vendors included in the market definition
- 3.2 Market segment analysis
- Exhibit 10: Market segments
- 3.3 Market size 2022
- 3.4 Market outlook: Forecast for 2022-2027
- Exhibit 11: Chart on India - Market size and forecast 2022-2027 ($ million)
- Exhibit 12: Data Table on India - Market size and forecast 2022-2027 ($ million)
- Exhibit 13: Chart on India: Year-over-year growth 2022-2027 (%)
- Exhibit 14: Data Table on India: Year-over-year growth 2022-2027 (%)
4 Historic Market Size
- 4.1 Third-party logistics market in India 2017 - 2021
- Exhibit 15: Historic Market Size – Data Table on Third-party logistics market in India 2017 - 2021 ($ million)
- 4.2 Service Segment Analysis 2017 - 2021
- Exhibit 16: Historic Market Size – Service Segment 2017 - 2021 ($ million)
- 4.3 End-user Segment Analysis 2017 - 2021
- Exhibit 17: Historic Market Size – End-user Segment 2017 - 2021 ($ million)
5 Five Forces Analysis
- 5.1 Five forces summary
- Exhibit 18: Five forces analysis - Comparison between 2022 and 2027
- 5.2 Bargaining power of buyers
- Exhibit 19: Chart on Bargaining power of buyers – Impact of key factors 2022 and 2027
- 5.3 Bargaining power of suppliers
- Exhibit 20: Bargaining power of suppliers – Impact of key factors in 2022 and 2027
- 5.4 Threat of new entrants
- Exhibit 21: Threat of new entrants – Impact of key factors in 2022 and 2027
- 5.5 Threat of substitutes
- Exhibit 22: Threat of substitutes – Impact of key factors in 2022 and 2027
- 5.6 Threat of rivalry
- Exhibit 23: Threat of rivalry – Impact of key factors in 2022 and 2027
- 5.7 Market condition
- Exhibit 24: Chart on Market condition - Five forces 2022 and 2027
6 Market Segmentation by Service
- 6.1 Market segments
- Exhibit 25: Chart on Service - Market share 2022-2027 (%)
- Exhibit 26: Data Table on Service - Market share 2022-2027 (%)
- 6.2 Comparison by Service
- Exhibit 27: Chart on Comparison by Service
- Exhibit 28: Data Table on Comparison by Service
- 6.3 Transportation - Market size and forecast 2022-2027
- Exhibit 29: Chart on Transportation - Market size and forecast 2022-2027 ($ million)
- Exhibit 30: Data Table on Transportation - Market size and forecast 2022-2027 ($ million)
- Exhibit 31: Chart on Transportation - Year-over-year growth 2022-2027 (%)
- Exhibit 32: Data Table on Transportation - Year-over-year growth 2022-2027 (%)
- 6.4 Warehousing and distribution - Market size and forecast 2022-2027
- Exhibit 33: Chart on Warehousing and distribution - Market size and forecast 2022-2027 ($ million)
- Exhibit 34: Data Table on Warehousing and distribution - Market size and forecast 2022-2027 ($ million)
- Exhibit 35: Chart on Warehousing and distribution - Year-over-year growth 2022-2027 (%)
- Exhibit 36: Data Table on Warehousing and distribution - Year-over-year growth 2022-2027 (%)
- 6.5 VAS - Market size and forecast 2022-2027
- Exhibit 37: Chart on VAS - Market size and forecast 2022-2027 ($ million)
- Exhibit 38: Data Table on VAS - Market size and forecast 2022-2027 ($ million)
- Exhibit 39: Chart on VAS - Year-over-year growth 2022-2027 (%)
- Exhibit 40: Data Table on VAS - Year-over-year growth 2022-2027 (%)
- 6.6 Market opportunity by Service
- Exhibit 41: Market opportunity by Service ($ million)
7 Market Segmentation by End-user
- 7.1 Market segments
- Exhibit 42: Chart on End-user - Market share 2022-2027 (%)
- Exhibit 43: Data Table on End-user - Market share 2022-2027 (%)
- 7.2 Comparison by End-user
- Exhibit 44: Chart on Comparison by End-user
- Exhibit 45: Data Table on Comparison by End-user
- 7.3 Manufacturing - Market size and forecast 2022-2027
- Exhibit 46: Chart on Manufacturing - Market size and forecast 2022-2027 ($ million)
- Exhibit 47: Data Table on Manufacturing - Market size and forecast 2022-2027 ($ million)
- Exhibit 48: Chart on Manufacturing - Year-over-year growth 2022-2027 (%)
- Exhibit 49: Data Table on Manufacturing - Year-over-year growth 2022-2027 (%)
- 7.4 Consumer goods - Market size and forecast 2022-2027
- Exhibit 50: Chart on Consumer goods - Market size and forecast 2022-2027 ($ million)
- Exhibit 51: Data Table on Consumer goods - Market size and forecast 2022-2027 ($ million)
- Exhibit 52: Chart on Consumer goods - Year-over-year growth 2022-2027 (%)
- Exhibit 53: Data Table on Consumer goods - Year-over-year growth 2022-2027 (%)
- 7.5 Food and beverage - Market size and forecast 2022-2027
- Exhibit 54: Chart on Food and beverage - Market size and forecast 2022-2027 ($ million)
- Exhibit 55: Data Table on Food and beverage - Market size and forecast 2022-2027 ($ million)
- Exhibit 56: Chart on Food and beverage - Year-over-year growth 2022-2027 (%)
- Exhibit 57: Data Table on Food and beverage - Year-over-year growth 2022-2027 (%)
- 7.6 Automotive - Market size and forecast 2022-2027
- Exhibit 58: Chart on Automotive - Market size and forecast 2022-2027 ($ million)
- Exhibit 59: Data Table on Automotive - Market size and forecast 2022-2027 ($ million)
- Exhibit 60: Chart on Automotive - Year-over-year growth 2022-2027 (%)
- Exhibit 61: Data Table on Automotive - Year-over-year growth 2022-2027 (%)
- 7.7 Others - Market size and forecast 2022-2027
- Exhibit 62: Chart on Others - Market size and forecast 2022-2027 ($ million)
- Exhibit 63: Data Table on Others - Market size and forecast 2022-2027 ($ million)
- Exhibit 64: Chart on Others - Year-over-year growth 2022-2027 (%)
- Exhibit 65: Data Table on Others - Year-over-year growth 2022-2027 (%)
- 7.8 Market opportunity by End-user
- Exhibit 66: Market opportunity by End-user ($ million)
8 Customer Landscape
- 8.1 Customer landscape overview
- Exhibit 67: Analysis of price sensitivity, lifecycle, customer purchase basket, adoption rates, and purchase criteria
9 Drivers, Challenges, and Trends
- 9.1 Market drivers
- 9.2 Market challenges
- 9.3 Impact of drivers and challenges
- Exhibit 68: Impact of drivers and challenges in 2022 and 2027
- 9.4 Market trends
10 Vendor Landscape
- 10.1 Overview
- 10.2 Vendor landscape
- Exhibit 69: Overview on Criticality of inputs and Factors of differentiation
- 10.3 Landscape disruption
- Exhibit 70: Overview on factors of disruption
- 10.4 Industry risks
- Exhibit 71: Impact of key risks on business
11 Vendor Analysis
- 11.1 Vendors covered
- Exhibit 72: Vendors covered
- 11.2 Market positioning of vendors
- Exhibit 73: Matrix on vendor position and classification
- 11.3 Aegis Logistics Ltd.
- Exhibit 74: Aegis Logistics Ltd. - Overview
- Exhibit 75: Aegis Logistics Ltd. - Business segments
- Exhibit 76: Aegis Logistics Ltd. - Key offerings
- Exhibit 77: Aegis Logistics Ltd. - Segment focus
- 11.4 Allcargo Logistics Ltd.
- Exhibit 78: Allcargo Logistics Ltd. - Overview
- Exhibit 79: Allcargo Logistics Ltd. - Business segments
- Exhibit 80: Allcargo Logistics Ltd. - Key offerings
- Exhibit 81: Allcargo Logistics Ltd. - Segment focus
- 11.5 AWL India Pvt. Ltd.
- Exhibit 82: AWL India Pvt. Ltd. - Overview
- Exhibit 83: AWL India Pvt. Ltd. - Product / Service
- Exhibit 84: AWL India Pvt. Ltd. - Key offerings
- 11.6 Blue Dart Express Ltd.
- Exhibit 85: Blue Dart Express Ltd. - Overview
- Exhibit 86: Blue Dart Express Ltd. - Product / Service
- Exhibit 87: Blue Dart Express Ltd. - Key offerings
- 11.7 Delhivery Ltd.
- Exhibit 88: Delhivery Ltd. - Overview
- Exhibit 89: Delhivery Ltd. - Business segments
- Exhibit 90: Delhivery Ltd. - Key offerings
- Exhibit 91: Delhivery Ltd. - Segment focus
- 11.8 FedEx Corp.
- Exhibit 92: FedEx Corp. - Overview
- Exhibit 93: FedEx Corp. - Business segments
- Exhibit 94: FedEx Corp. - Key offerings
- Exhibit 95: FedEx Corp. - Segment focus
- 11.9 Gati Ltd.
- Exhibit 96: Gati Ltd. - Overview
- Exhibit 97: Gati Ltd. - Business segments
- Exhibit 98: Gati Ltd. - Key offerings
- Exhibit 99: Gati Ltd. - Segment focus
- 11.10 Mahindra Logistics Ltd.
- Exhibit 100: Mahindra Logistics Ltd. - Overview
- Exhibit 101: Mahindra Logistics Ltd. - Business segments
- Exhibit 102: Mahindra Logistics Ltd. - Key offerings
- Exhibit 103: Mahindra Logistics Ltd. - Segment focus
- 11.11 Meesan Logistics Pvt. Ltd.
- Exhibit 104: Meesan Logistics Pvt. Ltd. - Overview
- Exhibit 105: Meesan Logistics Pvt. Ltd. - Product / Service
- Exhibit 106: Meesan Logistics Pvt. Ltd. - Key offerings
- 11.12 Pyramis Cargo Management Pvt. Ltd.
- Exhibit 107: Pyramis Cargo Management Pvt. Ltd. - Overview
- Exhibit 108: Pyramis Cargo Management Pvt. Ltd. - Product / Service
- Exhibit 109: Pyramis Cargo Management Pvt. Ltd. - Key offerings
- 11.13 Safexpress Pvt. Ltd.
- Exhibit 110: Safexpress Pvt. Ltd. - Overview
- Exhibit 111: Safexpress Pvt. Ltd. - Product / Service
- Exhibit 112: Safexpress Pvt. Ltd. - Key news
- Exhibit 113: Safexpress Pvt. Ltd. - Key offerings
- 11.14 SICAL Logistics Ltd.
- Exhibit 114: SICAL Logistics Ltd. - Overview
- Exhibit 115: SICAL Logistics Ltd. - Business segments
- Exhibit 116: SICAL Logistics Ltd. - Key offerings
- Exhibit 117: SICAL Logistics Ltd. - Segment focus
- 11.15 TCI Express Ltd.
- Exhibit 118: TCI Express Ltd. - Overview
- Exhibit 119: TCI Express Ltd. - Product / Service
- Exhibit 120: TCI Express Ltd. - Key offerings
- 11.16 T V Sundram Iyengar and Sons Ltd.
- Exhibit 121: T V Sundram Iyengar and Sons Ltd. - Overview
- Exhibit 122: T V Sundram Iyengar and Sons Ltd. - Product / Service
- Exhibit 123: T V Sundram Iyengar and Sons Ltd. - Key offerings
- 11.17 VRL Logistics Ltd.
- Exhibit 124: VRL Logistics Ltd. - Overview
- Exhibit 125: VRL Logistics Ltd. - Business segments
- Exhibit 126: VRL Logistics Ltd. - Key offerings
- Exhibit 127: VRL Logistics Ltd. - Segment focus
12 Appendix
- 12.1 Scope of the report
- 12.2 Inclusions and exclusions checklist
- Exhibit 128: Inclusions checklist
- Exhibit 129: Exclusions checklist
- 12.3 Currency conversion rates for US$
- Exhibit 130: Currency conversion rates for US$
- 12.4 Research methodology
- Exhibit 131: Research methodology
- Exhibit 132: Validation techniques employed for market sizing
- Exhibit 133: Information sources
- 12.5 List of abbreviations
- Exhibit 134: List of abbreviations
About Us
Technavio is a leading global technology research and advisory company. Their research and analysis focuses on emerging market trends and provides actionable insights to help businesses identify market opportunities and develop effective strategies to optimize their market positions. With over 500 specialized analysts, Technavio's report library consists of more than 17,000 reports and counting, covering 800 technologies, spanning across 50 countries. Their client base consists of enterprises of all sizes, including more than 100 Fortune 500 companies. This growing client base relies on Technavio's comprehensive coverage, extensive research, and actionable market insights to identify opportunities in existing and potential markets and assess their competitive positions within changing market scenarios.
Contact
Technavio Research
Jesse Maida
Media & Marketing Executive
US: +1 844 364 1100
UK: +44 203 893 3200
Email: media@technavio.com
Website: www.technavio.com/


SOURCE Technavio
© 2024 Benzinga.com. Benzinga does not provide investment advice. All rights reserved.
Trade confidently with insights and alerts from analyst ratings, free reports and breaking news that affects the stocks you care about.

