


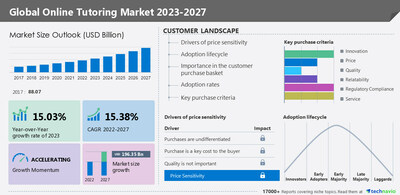
NEW YORK, April 6, 2023 /PRNewswire/ -- The online tutoring market size is set to grow by USD 196.35 billion from 2022 to 2027 at a CAGR of 15.38% during the forecast period. The report offers an up-to-date analysis regarding the current global market scenario, the latest trends and drivers, and the overall market environment. The growing importance of STEM education is a major factor driving the global online tutoring market growth. STEM is a curriculum based on the idea of educating students in four specific disciplines, namely science, technology, engineering, and mathematics, and it integrates these subjects into a unified learning model based on real-world applications. The educational stakeholders driving the importance of STEM education include students, parents, and various educational stakeholders. The growing number of job opportunities in the STEM field is another major reason for the rising popularity of STEM courses among students globally. Hence, the increasing number of STEM job opportunities, coupled with the rising competition in STEM competitive exams, will encourage more students to enroll in online tutoring services during the forecast period. Here is an exclusive report talking about market scenarios with a historical period (2017-2021) and forecast period (2023-2027). Download a Sample Report!

The report on the online tutoring market provides a holistic update, market size and forecast, trends, growth drivers, and challenges, as well as vendor analysis.
The online tutoring market covers the following areas:
Online Tutoring Market Sizing
Online Tutoring Market Forecast
Online Tutoring Market Analysis
Online Tutoring Market 2023-2027 - Market Dynamics
- A major leading trend in the online tutoring market is the use of apps and wearables for online tutoring.
- Advanced technologies such as mobile apps and wearables are some of the recent trends in the market, and the use of virtual reality (VR) in tutoring creates a unique environment for students.
- Along with the use of VR in online lessons, tutors enhance their teaching sessions with various mobile apps.
- VR devices and smartwatches are expected to be the most popular technologies in virtual classrooms due to their ability to share content easily.
- Smartwatches keep users connected always, which makes online tutoring convenient for users.
- Hence, the proliferation of smartphones, coupled with the increasing penetration of the Internet, is fueling the demand for mobile learning apps, which, will increase the demand for online tutoring.
Why Buy?
- Add credibility to strategy
- Analyzes competitor's offerings
- Get a holistic view of the market
Grow your profit margin with Technavio - Buy the Report
Online Tutoring Market 2023-2027: Market Segmentation
This online tutoring market report extensively covers market segmentation by courses (STEM, language courses, and other courses), platform (desktop tutoring and mobile tutoring), and geography (APAC, Europe, North America, South America, and the Middle East and Africa).
- The market share growth by the STEM segment will be significant during the forecast period. Some of the prominent STEM subjects include aerospace engineering, astronomy, biochemistry, chemical engineering, computer science, physics, and statistics. The STEM segment includes tutoring services offered for K-12 and higher education students in STEM subjects and for test preparation. Developing countries such as China, India, the US, and the UK are focusing on STEM education to narrow down the supply-demand gap in STEM-related job opportunities. Hence, initiatives undertaken by various governments have emphasized the importance of STEM subjects among students in several countries.
This report presents a detailed picture of the market by the way of study, synthesis, and summation of data from multiple sources through an analysis of key parameters- View a Sample Report
Companies Mentioned
- Ambow Education Holding Ltd.
- ArborBridge LLC
- China Distance Education Holdings Ltd.
- Club Z Inc.
- D2L Corp.
- Fleet Education Services Ltd.
- Growing Stars Inc.
- iTutorGroup Ltd.
- John Wiley and Sons Inc.
- My Tutorweb Ltd.
- New Oriental Education and Technology Group Inc.
- Nuevo Agora Centro De Estudios SL
- Pearson Plc
- Preply Inc
- Stride Inc.
- Sylvan Learning LLC
- TAL Education Group
- Think and Learn Pvt. Ltd.
- Varsity Tutors LLC
- Vedantu Innovations Pvt. Ltd.
Vendor Offerings
- Ambow Education Holding Ltd. - The company offers online tutoring such as K-12 educational services.
- ArborBridge LLC - The company offers online tutoring for SAT and ACT coaching.
- China Distance Education Holdings Ltd. - The company offers online tutoring for accounting, healthcare, engineering, and construction.
Gain instant access to 17,000+ market research reports.
Technavio's SUBSCRIPTION platform
Related Reports:
The size of the after-school tutoring market in China will grow by USD 53.31 billion at a CAGR of 14% during 2020-2025. The report extensively covers market segmentation by end-user (primary school and secondary school), application (subject-specific and English), and geography (APAC and North America). Key drivers such as the focus on outcome-based education are supporting the growth of the after-school tutoring market in China.
The private tutoring market in US is estimated to grow at a CAGR of 9.65% between 2022 and 2027. The size of the market is forecasted to increase by USD 20,479.88 million. This report extensively covers market segmentation by type (curriculum-based learning and test preparation) and learning method (online, blended, and classroom-based). One of the factors driving the growth of the private tutoring market in US is the growing emphasis on STEM education.
Online Tutoring Market Scope | |
Report Coverage | Details |
Base year | 2022 |
Historic period | 2017-2021 |
Forecast period | 2023-2027 |
Growth momentum & CAGR | Accelerate at a CAGR of 15.38% |
Market growth 2023-2027 | USD 196.35 billion |
Market structure | Fragmented |
YoY growth 2022-2023(%) | 15.03 |
Regional analysis | APAC, Europe, North America, South America, and Middle East and Africa |
Performing market contribution | APAC at 47% |
Key countries | US, China, Japan, India, Germany, and UK |
Competitive landscape | Leading Vendors, Market Positioning of Vendors, Competitive Strategies, and Industry Risks |
Key companies profiled | Ambow Education Holding Ltd., ArborBridge LLC, China Distance Education Holdings Ltd., Club Z Inc., D2L Corp., Fleet Education Services Ltd., Growing Stars Inc., iTutorGroup Ltd., John Wiley and Sons Inc., My Tutorweb Ltd., New Oriental Education and Technology Group Inc., Nuevo Agora Centro De Estudios SL, Pearson Plc, Preply Inc, Stride Inc., Sylvan Learning LLC, TAL Education Group, Think and Learn Pvt. Ltd., Varsity Tutors LLC, and Vedantu Innovations Pvt. Ltd. |
Market dynamics | Parent market analysis, Market growth inducers and obstacles, Fast-growing and slow-growing segment analysis, COVID-19 impact and recovery analysis and future consumer dynamics, Market condition analysis for the forecast period |
Customization purview | If our report has not included the data that you are looking for, you can reach out to our analysts and get segments customized. |
Browse through Technavio's Consumer Discretionary Market Reports
Table of contents:
1 Executive Summary
- 1.1 Market overview
- Exhibit 01: Executive Summary – Chart on Market Overview
- Exhibit 02: Executive Summary – Data Table on Market Overview
- Exhibit 03: Executive Summary – Chart on Global Market Characteristics
- Exhibit 04: Executive Summary – Chart on Market by Geography
- Exhibit 05: Executive Summary – Chart on Market Segmentation by Courses
- Exhibit 06: Executive Summary – Chart on Market Segmentation by Platform
- Exhibit 07: Executive Summary – Chart on Incremental Growth
- Exhibit 08: Executive Summary – Data Table on Incremental Growth
- Exhibit 09: Executive Summary – Chart on Vendor Market Positioning
2 Market Landscape
- 2.1 Market ecosystem
- Exhibit 10: Parent market
- Exhibit 11: Market Characteristics
3 Market Sizing
- 3.1 Market definition
- Exhibit 12: Offerings of vendors included in the market definition
- 3.2 Market segment analysis
- Exhibit 13: Market segments
- 3.3 Market size 2022
- 3.4 Market outlook: Forecast for 2022-2027
- Exhibit 14: Chart on Global - Market size and forecast 2022-2027 ($ billion)
- Exhibit 15: Data Table on Global - Market size and forecast 2022-2027 ($ billion)
- Exhibit 16: Chart on Global Market: Year-over-year growth 2022-2027 (%)
- Exhibit 17: Data Table on Global Market: Year-over-year growth 2022-2027 (%)
4 Historic Market Size
- 4.1 Global online tutoring market 2017 - 2021
- Exhibit 18: Historic Market Size – Data Table on Global online tutoring market 2017 - 2021 ($ billion)
- 4.2 Course Segment Analysis 2017 - 2021
- Exhibit 19: Historic Market Size – Course Segment 2017 - 2021 ($ billion)
- 4.3 Platform Segment Analysis 2017 - 2021
- Exhibit 20: Historic Market Size – Platform Segment 2017 - 2021 ($ billion)
- 4.4 Geography Segment Analysis 2017 - 2021
- Exhibit 21: Historic Market Size – Geography Segment 2017 - 2021 ($ billion)
- 4.5 Country Segment Analysis 2017 - 2021
- Exhibit 22: Historic Market Size – Country Segment 2017 - 2021 ($ billion)
5 Five Forces Analysis
- 5.1 Five forces summary
- Exhibit 23: Five forces analysis - Comparison between2022 and 2027
- 5.2 Bargaining power of buyers
- Exhibit 24: Chart on Bargaining power of buyers – Impact of key factors 2022 and 2027
- 5.3 Bargaining power of suppliers
- Exhibit 25: Bargaining power of suppliers – Impact of key factors in 2022 and 2027
- 5.4 Threat of new entrants
- Exhibit 26: Threat of new entrants – Impact of key factors in 2022 and 2027
- 5.5 Threat of substitutes
- Exhibit 27: Threat of substitutes – Impact of key factors in 2022 and 2027
- 5.6 Threat of rivalry
- Exhibit 28: Threat of rivalry – Impact of key factors in 2022 and 2027
- 5.7 Market condition
- Exhibit 29: Chart on Market condition - Five forces 2022 and 2027
6 Market Segmentation by Courses
- 6.1 Market segments
- Exhibit 30: Chart on Courses - Market share 2022-2027 (%)
- Exhibit 31: Data Table on Courses - Market share 2022-2027 (%)
- 6.2 Comparison by Courses
- Exhibit 32: Chart on Comparison by Courses
- Exhibit 33: Data Table on Comparison by Courses
- 6.3 STEM - Market size and forecast 2022-2027
- Exhibit 34: Chart on STEM - Market size and forecast 2022-2027 ($ billion)
- Exhibit 35: Data Table on STEM - Market size and forecast 2022-2027 ($ billion)
- Exhibit 36: Chart on STEM - Year-over-year growth 2022-2027 (%)
- Exhibit 37: Data Table on STEM - Year-over-year growth 2022-2027 (%)
- 6.4 Language courses - Market size and forecast 2022-2027
- Exhibit 38: Chart on Language courses - Market size and forecast 2022-2027 ($ billion)
- Exhibit 39: Data Table on Language courses - Market size and forecast 2022-2027 ($ billion)
- Exhibit 40: Chart on Language courses - Year-over-year growth 2022-2027 (%)
- Exhibit 41: Data Table on Language courses - Year-over-year growth 2022-2027 (%)
- 6.5 Other courses - Market size and forecast 2022-2027
- Exhibit 42: Chart on Other courses - Market size and forecast 2022-2027 ($ billion)
- Exhibit 43: Data Table on Other courses - Market size and forecast 2022-2027 ($ billion)
- Exhibit 44: Chart on Other courses - Year-over-year growth 2022-2027 (%)
- Exhibit 45: Data Table on Other courses - Year-over-year growth 2022-2027 (%)
- 6.6 Market opportunity by Courses
- Exhibit 46: Market opportunity by Courses ($ billion)
7 Market Segmentation by Platform
- 7.1 Market segments
- Exhibit 47: Chart on Platform - Market share 2022-2027 (%)
- Exhibit 48: Data Table on Platform - Market share 2022-2027 (%)
- 7.2 Comparison by Platform
- Exhibit 49: Chart on Comparison by Platform
- Exhibit 50: Data Table on Comparison by Platform
- 7.3 Desktop tutoring - Market size and forecast 2022-2027
- Exhibit 51: Chart on Desktop tutoring - Market size and forecast 2022-2027 ($ billion)
- Exhibit 52: Data Table on Desktop tutoring - Market size and forecast 2022-2027 ($ billion)
- Exhibit 53: Chart on Desktop tutoring - Year-over-year growth 2022-2027 (%)
- Exhibit 54: Data Table on Desktop tutoring - Year-over-year growth 2022-2027 (%)
- 7.4 Mobile tutoring - Market size and forecast 2022-2027
- Exhibit 55: Chart on Mobile tutoring - Market size and forecast 2022-2027 ($ billion)
- Exhibit 56: Data Table on Mobile tutoring - Market size and forecast 2022-2027 ($ billion)
- Exhibit 57: Chart on Mobile tutoring - Year-over-year growth 2022-2027 (%)
- Exhibit 58: Data Table on Mobile tutoring - Year-over-year growth 2022-2027 (%)
- 7.5 Market opportunity by Platform
- Exhibit 59: Market opportunity by Platform ($ billion)
8 Customer Landscape
- 8.1 Customer landscape overview
- Exhibit 60: Analysis of price sensitivity, lifecycle, customer purchase basket, adoption rates, and purchase criteria
9 Geographic Landscape
- 9.1 Geographic segmentation
- Exhibit 61: Chart on Market share by geography 2022-2027 (%)
- Exhibit 62: Data Table on Market share by geography 2022-2027 (%)
- 9.2 Geographic comparison
- Exhibit 63: Chart on Geographic comparison
- Exhibit 64: Data Table on Geographic comparison
- 9.3 APAC - Market size and forecast 2022-2027
- Exhibit 65: Chart on APAC - Market size and forecast 2022-2027 ($ billion)
- Exhibit 66: Data Table on APAC - Market size and forecast 2022-2027 ($ billion)
- Exhibit 67: Chart on APAC - Year-over-year growth 2022-2027 (%)
- Exhibit 68: Data Table on APAC - Year-over-year growth 2022-2027 (%)
- 9.4 Europe - Market size and forecast 2022-2027
- Exhibit 69: Chart on Europe - Market size and forecast 2022-2027 ($ billion)
- Exhibit 70: Data Table on Europe - Market size and forecast 2022-2027 ($ billion)
- Exhibit 71: Chart on Europe - Year-over-year growth 2022-2027 (%)
- Exhibit 72: Data Table on Europe - Year-over-year growth 2022-2027 (%)
- 9.5 North America - Market size and forecast 2022-2027
- Exhibit 73: Chart on North America - Market size and forecast 2022-2027 ($ billion)
- Exhibit 74: Data Table on North America - Market size and forecast 2022-2027 ($ billion)
- Exhibit 75: Chart on North America - Year-over-year growth 2022-2027 (%)
- Exhibit 76: Data Table on North America - Year-over-year growth 2022-2027 (%)
- 9.6 South America - Market size and forecast 2022-2027
- Exhibit 77: Chart on South America - Market size and forecast 2022-2027 ($ billion)
- Exhibit 78: Data Table on South America - Market size and forecast 2022-2027 ($ billion)
- Exhibit 79: Chart on South America - Year-over-year growth 2022-2027 (%)
- Exhibit 80: Data Table on South America - Year-over-year growth 2022-2027 (%)
- 9.7 Middle East and Africa - Market size and forecast 2022-2027
- Exhibit 81: Chart on Middle East and Africa - Market size and forecast 2022-2027 ($ billion)
- Exhibit 82: Data Table on Middle East and Africa - Market size and forecast 2022-2027 ($ billion)
- Exhibit 83: Chart on Middle East and Africa - Year-over-year growth 2022-2027 (%)
- Exhibit 84: Data Table on Middle East and Africa - Year-over-year growth 2022-2027 (%)
- 9.8 China - Market size and forecast 2022-2027
- Exhibit 85: Chart on China - Market size and forecast 2022-2027 ($ billion)
- Exhibit 86: Data Table on China - Market size and forecast 2022-2027 ($ billion)
- Exhibit 87: Chart on China - Year-over-year growth 2022-2027 (%)
- Exhibit 88: Data Table on China - Year-over-year growth 2022-2027 (%)
- 9.9 US - Market size and forecast 2022-2027
- Exhibit 89: Chart on US - Market size and forecast 2022-2027 ($ billion)
- Exhibit 90: Data Table on US - Market size and forecast 2022-2027 ($ billion)
- Exhibit 91: Chart on US - Year-over-year growth 2022-2027 (%)
- Exhibit 92: Data Table on US - Year-over-year growth 2022-2027 (%)
- 9.10 Japan - Market size and forecast 2022-2027
- Exhibit 93: Chart on Japan - Market size and forecast 2022-2027 ($ billion)
- Exhibit 94: Data Table on Japan - Market size and forecast 2022-2027 ($ billion)
- Exhibit 95: Chart on Japan - Year-over-year growth 2022-2027 (%)
- Exhibit 96: Data Table on Japan - Year-over-year growth 2022-2027 (%)
- 9.11 Germany - Market size and forecast 2022-2027
- Exhibit 97: Chart on Germany - Market size and forecast 2022-2027 ($ billion)
- Exhibit 98: Data Table on Germany - Market size and forecast 2022-2027 ($ billion)
- Exhibit 99: Chart on Germany - Year-over-year growth 2022-2027 (%)
- Exhibit 100: Data Table on Germany - Year-over-year growth 2022-2027 (%)
- 9.12 UK - Market size and forecast 2022-2027
- Exhibit 101: Chart on UK - Market size and forecast 2022-2027 ($ billion)
- Exhibit 102: Data Table on UK - Market size and forecast 2022-2027 ($ billion)
- Exhibit 103: Chart on UK - Year-over-year growth 2022-2027 (%)
- Exhibit 104: Data Table on UK - Year-over-year growth 2022-2027 (%)
- 9.13 India - Market size and forecast 2022-2027
- Exhibit 105: Chart on India - Market size and forecast 2022-2027 ($ billion)
- Exhibit 106: Data Table on India - Market size and forecast 2022-2027 ($ billion)
- Exhibit 107: Chart on India - Year-over-year growth 2022-2027 (%)
- Exhibit 108: Data Table on India - Year-over-year growth 2022-2027 (%)
- 9.14 Market opportunity by geography
- Exhibit 109: Market opportunity by geography ($ billion)
10 Drivers, Challenges, and Trends
- 10.1 Market drivers
- 10.2 Market challenges
- 10.3 Impact of drivers and challenges
- Exhibit 110: Impact of drivers and challenges in 2022 and 2027
- 10.4 Market trends
11 Vendor Landscape
- 11.1 Overview
- 11.2 Vendor landscape
- Exhibit 111: Overview on Criticality of inputs and Factors of differentiation
- 11.3 Landscape disruption
- Exhibit 112: Overview on factors of disruption
- 11.4 Industry risks
- Exhibit 113: Impact of key risks on business
12 Vendor Analysis
- 12.1 Vendors covered
- Exhibit 114: Vendors covered
- 12.2 Market positioning of vendors
- Exhibit 115: Matrix on vendor position and classification
- 12.3 Ambow Education Holding Ltd.
- Exhibit 116: Ambow Education Holding Ltd. - Overview
- Exhibit 117: Ambow Education Holding Ltd. - Business segments
- Exhibit 118: Ambow Education Holding Ltd. - Key news
- Exhibit 119: Ambow Education Holding Ltd. - Key offerings
- Exhibit 120: Ambow Education Holding Ltd. - Segment focus
- 12.4 ArborBridge LLC
- Exhibit 121: ArborBridge LLC - Overview
- Exhibit 122: ArborBridge LLC - Product / Service
- Exhibit 123: ArborBridge LLC - Key offerings
- 12.5 China Distance Education Holdings Ltd.
- Exhibit 124: China Distance Education Holdings Ltd. - Overview
- Exhibit 125: China Distance Education Holdings Ltd. - Business segments
- Exhibit 126: China Distance Education Holdings Ltd. - Key news
- Exhibit 127: China Distance Education Holdings Ltd. - Key offerings
- Exhibit 128: China Distance Education Holdings Ltd. - Segment focus
- 12.6 Club Z Inc.
- Exhibit 129: Club Z Inc. - Overview
- Exhibit 130: Club Z Inc. - Product / Service
- Exhibit 131: Club Z Inc. - Key offerings
- 12.7 D2L Corp.
- Exhibit 132: D2L Corp. - Overview
- Exhibit 133: D2L Corp. - Product / Service
- Exhibit 134: D2L Corp. - Key news
- Exhibit 135: D2L Corp. - Key offerings
- 12.8 Fleet Education Services Ltd.
- Exhibit 136: Fleet Education Services Ltd. - Overview
- Exhibit 137: Fleet Education Services Ltd. - Product / Service
- Exhibit 138: Fleet Education Services Ltd. - Key offerings
- 12.9 Growing Stars Inc.
- Exhibit 139: Growing Stars Inc. - Overview
- Exhibit 140: Growing Stars Inc. - Product / Service
- Exhibit 141: Growing Stars Inc. - Key offerings
- 12.10 iTutorGroup Ltd.
- Exhibit 142: iTutorGroup Ltd. - Overview
- Exhibit 143: iTutorGroup Ltd. - Product / Service
- Exhibit 144: iTutorGroup Ltd. - Key offerings
- 12.11 John Wiley and Sons Inc.
- Exhibit 145: John Wiley and Sons Inc. - Overview
- Exhibit 146: John Wiley and Sons Inc. - Business segments
- Exhibit 147: John Wiley and Sons Inc. - Key offerings
- Exhibit 148: John Wiley and Sons Inc. - Segment focus
- 12.12 Pearson Plc
- Exhibit 149: Pearson Plc - Overview
- Exhibit 150: Pearson Plc - Business segments
- Exhibit 151: Pearson Plc - Key offerings
- Exhibit 152: Pearson Plc - Segment focus
- 12.13 Stride Inc.
- Exhibit 153: Stride Inc. - Overview
- Exhibit 154: Stride Inc. - Product / Service
- Exhibit 155: Stride Inc. - Key offerings
- 12.14 TAL Education Group
- Exhibit 156: TAL Education Group - Overview
- Exhibit 157: TAL Education Group - Business segments
- Exhibit 158: TAL Education Group - Key offerings
- Exhibit 159: TAL Education Group - Segment focus
- 12.15 Think and Learn Pvt. Ltd.
- Exhibit 160: Think and Learn Pvt. Ltd. - Overview
- Exhibit 161: Think and Learn Pvt. Ltd. - Product / Service
- Exhibit 162: Think and Learn Pvt. Ltd. - Key offerings
- 12.16 Varsity Tutors LLC
- Exhibit 163: Varsity Tutors LLC - Overview
- Exhibit 164: Varsity Tutors LLC - Product / Service
- Exhibit 165: Varsity Tutors LLC - Key offerings
- 12.17 Vedantu Innovations Pvt. Ltd.
- Exhibit 166: Vedantu Innovations Pvt. Ltd. - Overview
- Exhibit 167: Vedantu Innovations Pvt. Ltd. - Product / Service
- Exhibit 168: Vedantu Innovations Pvt. Ltd. - Key offerings
13 Appendix
- 13.1 Scope of the report
- 13.2 Inclusions and exclusions checklist
- Exhibit 169: Inclusions checklist
- Exhibit 170: Exclusions checklist
- 13.3 Currency conversion rates for US$
- Exhibit 171: Currency conversion rates for US$
- 13.4 Research methodology
- Exhibit 172: Research methodology
- Exhibit 173: Validation techniques employed for market sizing
- Exhibit 174: Information sources
- 13.5 List of abbreviations
- Exhibit 175: List of abbreviations
Technavio is a leading global technology research and advisory company. Their research and analysis focus on emerging market trends andprovide actionable insights to help businesses identify market opportunities and develop effective strategies to optimize their market positions. With over 500 specialized analysts, Technavio's report library consists of more than 17,000 reports and counting, covering 800 technologies, spanning across 50 countries. Their client base consists of enterprises of all sizes, including more than 100 Fortune 500 companies. This growing client base relies on Technavio's comprehensive coverage, extensive research, and actionable market insights to identify opportunities in existing and potential markets and assess their competitive positions within changing market scenarios.
Contact
Technavio Research
Jesse Maida
Media & Marketing Executive
US: +1 844 364 1100
UK: +44 203 893 3200
Email: media@technavio.com
Website: www.technavio.com/


SOURCE Technavio
© 2024 Benzinga.com. Benzinga does not provide investment advice. All rights reserved.
Trade confidently with insights and alerts from analyst ratings, free reports and breaking news that affects the stocks you care about.

