


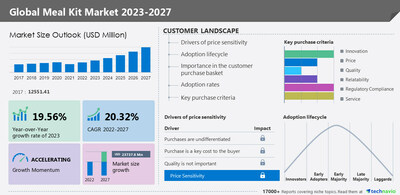
NEW YORK, March 14, 2023 /PRNewswire/ -- The meal kit market size is forecast to grow by USD 23,737.8 million between 2022 and 2027, and the growth momentum will be accelerating at a CAGR of 20.32% during the forecast period. The market is segmented by product (vegetarian and non-vegetarian), distribution channel (instore and online), and geography (North America, Europe, APAC, South America, and Middle East and Africa). The growth of the market is driven by factors such as cost-effective solutions and availability of diverse choices, customers looking for a convenient option with the advent of a faster lifestyle, and increasing awareness among consumers about the consumption of nutritious and healthy meals. For more insights on the historic data (2017 to 2021) and forecast market size (2023 to 2027) – Request a report sample

Company Profiles
The meal kit market report includes information on the key products and recent developments of leading vendors, including:
- Albertsons Companies Inc. - The company offers meal kits such as Armour LunchMakers ham and chesse portable meal kit and Campbells Sauces oven creamy garlic butter chicken.
- Bistro MD LLC - The company offers meal kits such as lasagna with garden marinara, salmon with dill mushroom sauce, and manicotti with vodka marinara sauce.
- Blue Apron Holdings Inc. - The company offers meal kits such as black bean and quinoa bowls and miso butter tilapia.
- Gobble Inc. - The company offers meal kits such as Singapore street noodles and pan-seared sirloin steak.
Regional Analysis
By region, the global meal kit market is segmented into North America, Europe, APAC, South America, and Middle East and Africa. North America will account for 54% of market growth during the forecast period. The increasing demand for meal kits among the working women population is driving the growth of the meal kit market in North America.
The US is the key market for meal kits in North America. Market growth in this region will be faster than the growth of the market in the European, MEA, and South American regions. The growing number of working populations looking for convenient and easy-to-prepare meal options will facilitate the meal kit market growth in North America over the forecast period. North America has witnessed that meal kits have changed cooking styles in past years. They don't prefer to go with the meal plan, grocery shop, and in preparing ingredients for recipes. Due to the growing competition among the vendors in the region, they are more focused on giving a new identity to their products to gain market share. For instance, Purple Carrot (Three Limes Inc.) offers vegan meal kits and performance meals also, especially recommended by pro athletes. The growing awareness about meal kits in the US, especially among women leads to the increased rate of adoption of meal kits among the working women population in the US. Apart from the US, Canada is also a key contributor to the growth of the meal kit delivery services market in North America.
Competitive Analysis
The competitive scenario categorizes companies based on various performance indicators. Some of the factors considered include the financial performance of companies over the past few years, growth strategies, product innovations, new product launches, investments, and growth in market share among others. Request a Sample
Market Segmentation
- By product, the market is segmented into vegetarian and non-vegetarian.
- By distribution channel, the market is segmented into instore and online.
- By geography, the market is segmented into North America, Europe, APAC, South America, and Middle East and Africa.
Why Buy?
- Add credibility to strategy
- Analyzes competitor's offerings
- Get a holistic view of the market
Grow your profit margin with Technavio – Buy the Report!
Related Reports:
- The meal vouchers and employee benefit solutions market size is expected to increase by USD 16.69 billion from 2021 to 2026, and the market's growth momentum will accelerate at a CAGR of 4%. The market is segmented by application (meal vouchers and employee benefits) and geography (Europe, South America, APAC, North America, and Middle East and Africa).
- The meal vouchers and employee benefit solutions market in Brazil is estimated to grow at a CAGR of 9.15% between 2022 and 2027. The size of the market is forecast to increase by USD 6,106.02 million. The market is segmented by application (meal vouchers and employee benefits).
Technavio's library includes over 17,000+ reports, covering more than 2,000 emerging technologies. Subscribe to our "Basic Plan" at just USD 5,000 and get lifetime access to Technavio Insights
What are the key data covered in this meal kit market report?
- CAGR of the market during the forecast period.
- Detailed information on factors that will drive the growth of the market between 2023 and 2027
- Precise estimation of the size of the meal kit market and its contribution to the parent market.
- Accurate predictions about upcoming trends and changes in consumer behavior.
- Growth of the market across North America, Europe, APAC, South America, and Middle East and Africa.
- A thorough analysis of the market's competitive landscape and detailed information about vendors.
- Comprehensive analysis of factors that will challenge the growth of meal kit market vendors.
Meal Kit Market Scope | |
Report Coverage | Details |
Base year | 2022 |
Historic period | 2017-2021 |
Forecast period | 2023-2027 |
Growth momentum & CAGR | Accelerate at a CAGR of 20.32% |
Market growth 2023-2027 | USD 23,737.8 million |
Market structure | Fragmented |
YoY growth 2022-2023 (%) | 19.56 |
Regional analysis | North America, Europe, APAC, South America, and Middle East and Africa |
Performing market contribution | North America at 54% |
Key countries | US, China, Japan, UK, and Germany |
Competitive landscape | Leading Vendors, Market Positioning of Vendors, Competitive Strategies, and Industry Risks |
Key companies profiled | Albertsons Companies Inc., Bistro MD LLC, Blue Apron Holdings Inc., Gobble Inc., HelloFresh SE, Koninklijke Ahold Delhaize NV, Marley Spoon AG, My Food Bag Ltd., Nestle SA, NH Foods Ltd., Oisix ra daichi Inc, Riverford Organic Farmers Ltd., Siam Food Services Ltd., SimplyCook Ltd., Sun Basket Inc., The Kroger Co., Tyson Foods Inc., William Jackson Food Group, and Woop Ltd. |
Market dynamics | Parent market analysis, market growth inducers and obstacles, fast-growing and slow-growing segment analysis, COVID-19 impact and recovery analysis and future consumer dynamics, and market condition analysis for the forecast period. |
Customization purview | If our report has not included the data that you are looking for, you can reach out to our analysts and get segments customized. |
1 Executive Summary
- 1.1 Market overview
- Exhibit 01: Executive Summary – Chart on Market Overview
- Exhibit 02: Executive Summary – Data Table on Market Overview
- Exhibit 03: Executive Summary – Chart on Global Market Characteristics
- Exhibit 04: Executive Summary – Chart on Market by Geography
- Exhibit 05: Executive Summary – Chart on Market Segmentation by Product
- Exhibit 06: Executive Summary – Chart on Market Segmentation by Distribution Channel
- Exhibit 07: Executive Summary – Chart on Incremental Growth
- Exhibit 08: Executive Summary – Data Table on Incremental Growth
- Exhibit 09: Executive Summary – Chart on Vendor Market Positioning
2 Market Landscape
- 2.1 Market ecosystem
- Exhibit 10: Parent market
- Exhibit 11: Market Characteristics
3 Market Sizing
- 3.1 Market definition
- Exhibit 12: Offerings of vendors included in the market definition
- 3.2 Market segment analysis
- Exhibit 13: Market segments
- 3.3 Market size 2022
- 3.4 Market outlook: Forecast for 2022-2027
- Exhibit 14: Chart on Global - Market size and forecast 2022-2027 ($ million)
- Exhibit 15: Data Table on Global - Market size and forecast 2022-2027 ($ million)
- Exhibit 16: Chart on Global Market: Year-over-year growth 2022-2027 (%)
- Exhibit 17: Data Table on Global Market: Year-over-year growth 2022-2027 (%)
4 Historic Market Size
- 4.1 Global meal kit market 2017 - 2021
- Exhibit 18: Historic Market Size – Data Table on Global meal kit market 2017 - 2021 ($ million)
- 4.2 Product Segment Analysis 2017 - 2021
- Exhibit 19: Historic Market Size – Product Segment 2017 - 2021 ($ million)
- 4.3 Distribution Channel Segment Analysis 2017 - 2021
- Exhibit 20: Historic Market Size – Distribution Channel Segment 2017 - 2021 ($ million)
- 4.4 Region Segment Analysis 2017 - 2021
- Exhibit 21: Historic Market Size – Region Segment 2017 - 2021 ($ million)
- 4.5 Country Segment Analysis 2017 - 2021
- Exhibit 22: Historic Market Size – Country Segment 2017 - 2021 ($ million)
5 Five Forces Analysis
- 5.1 Five forces summary
- Exhibit 23: Five forces analysis - Comparison between2022 and 2027
- 5.2 Bargaining power of buyers
- Exhibit 24: Chart on Bargaining power of buyers – Impact of key factors 2022 and 2027
- 5.3 Bargaining power of suppliers
- Exhibit 25: Bargaining power of suppliers – Impact of key factors in 2022 and 2027
- 5.4 Threat of new entrants
- Exhibit 26: Threat of new entrants – Impact of key factors in 2022 and 2027
- 5.5 Threat of substitutes
- Exhibit 27: Threat of substitutes – Impact of key factors in 2022 and 2027
- 5.6 Threat of rivalry
- Exhibit 28: Threat of rivalry – Impact of key factors in 2022 and 2027
- 5.7 Market condition
- Exhibit 29: Chart on Market condition - Five forces 2022 and 2027
6 Market Segmentation by Product
- 6.1 Market segments
- Exhibit 30: Chart on Product - Market share 2022-2027 (%)
- Exhibit 31: Data Table on Product - Market share 2022-2027 (%)
- 6.2 Comparison by Product
- Exhibit 32: Chart on Comparison by Product
- Exhibit 33: Data Table on Comparison by Product
- 6.3 Vegetarian - Market size and forecast 2022-2027
- Exhibit 34: Chart on Vegetarian - Market size and forecast 2022-2027 ($ million)
- Exhibit 35: Data Table on Vegetarian - Market size and forecast 2022-2027 ($ million)
- Exhibit 36: Chart on Vegetarian - Year-over-year growth 2022-2027 (%)
- Exhibit 37: Data Table on Vegetarian - Year-over-year growth 2022-2027 (%)
- 6.4 Non-vegetarian - Market size and forecast 2022-2027
- Exhibit 38: Chart on Non-vegetarian - Market size and forecast 2022-2027 ($ million)
- Exhibit 39: Data Table on Non-vegetarian - Market size and forecast 2022-2027 ($ million)
- Exhibit 40: Chart on Non-vegetarian - Year-over-year growth 2022-2027 (%)
- Exhibit 41: Data Table on Non-vegetarian - Year-over-year growth 2022-2027 (%)
- 6.5 Market opportunity by Product
- Exhibit 42: Market opportunity by Product ($ million)
7 Market Segmentation by Distribution Channel
- 7.1 Market segments
- Exhibit 43: Chart on Distribution Channel - Market share 2022-2027 (%)
- Exhibit 44: Data Table on Distribution Channel - Market share 2022-2027 (%)
- 7.2 Comparison by Distribution Channel
- Exhibit 45: Chart on Comparison by Distribution Channel
- Exhibit 46: Data Table on Comparison by Distribution Channel
- 7.3 Instore - Market size and forecast 2022-2027
- Exhibit 47: Chart on Instore - Market size and forecast 2022-2027 ($ million)
- Exhibit 48: Data Table on Instore - Market size and forecast 2022-2027 ($ million)
- Exhibit 49: Chart on Instore - Year-over-year growth 2022-2027 (%)
- Exhibit 50: Data Table on Instore - Year-over-year growth 2022-2027 (%)
- 7.4 Online - Market size and forecast 2022-2027
- Exhibit 51: Chart on Online - Market size and forecast 2022-2027 ($ million)
- Exhibit 52: Data Table on Online - Market size and forecast 2022-2027 ($ million)
- Exhibit 53: Chart on Online - Year-over-year growth 2022-2027 (%)
- Exhibit 54: Data Table on Online - Year-over-year growth 2022-2027 (%)
- 7.5 Market opportunity by Distribution Channel
- Exhibit 55: Market opportunity by Distribution Channel ($ million)
8 Customer Landscape
- 8.1 Customer landscape overview
- Exhibit 56: Analysis of price sensitivity, lifecycle, customer purchase basket, adoption rates, and purchase criteria
9 Geographic Landscape
- 9.1 Geographic segmentation
- Exhibit 57: Chart on Market share by geography 2022-2027 (%)
- Exhibit 58: Data Table on Market share by geography 2022-2027 (%)
- 9.2 Geographic comparison
- Exhibit 59: Chart on Geographic comparison
- Exhibit 60: Data Table on Geographic comparison
- 9.3 North America - Market size and forecast 2022-2027
- Exhibit 61: Chart on North America - Market size and forecast 2022-2027 ($ million)
- Exhibit 62: Data Table on North America - Market size and forecast 2022-2027 ($ million)
- Exhibit 63: Chart on North America - Year-over-year growth 2022-2027 (%)
- Exhibit 64: Data Table on North America - Year-over-year growth 2022-2027 (%)
- 9.4 Europe - Market size and forecast 2022-2027
- Exhibit 65: Chart on Europe - Market size and forecast 2022-2027 ($ million)
- Exhibit 66: Data Table on Europe - Market size and forecast 2022-2027 ($ million)
- Exhibit 67: Chart on Europe - Year-over-year growth 2022-2027 (%)
- Exhibit 68: Data Table on Europe - Year-over-year growth 2022-2027 (%)
- 9.5 APAC - Market size and forecast 2022-2027
- Exhibit 69: Chart on APAC - Market size and forecast 2022-2027 ($ million)
- Exhibit 70: Data Table on APAC - Market size and forecast 2022-2027 ($ million)
- Exhibit 71: Chart on APAC - Year-over-year growth 2022-2027 (%)
- Exhibit 72: Data Table on APAC - Year-over-year growth 2022-2027 (%)
- 9.6 South America - Market size and forecast 2022-2027
- Exhibit 73: Chart on South America - Market size and forecast 2022-2027 ($ million)
- Exhibit 74: Data Table on South America - Market size and forecast 2022-2027 ($ million)
- Exhibit 75: Chart on South America - Year-over-year growth 2022-2027 (%)
- Exhibit 76: Data Table on South America - Year-over-year growth 2022-2027 (%)
- 9.7 Middle East and Africa - Market size and forecast 2022-2027
- Exhibit 77: Chart on Middle East and Africa - Market size and forecast 2022-2027 ($ million)
- Exhibit 78: Data Table on Middle East and Africa - Market size and forecast 2022-2027 ($ million)
- Exhibit 79: Chart on Middle East and Africa - Year-over-year growth 2022-2027 (%)
- Exhibit 80: Data Table on Middle East and Africa - Year-over-year growth 2022-2027 (%)
- 9.8 US - Market size and forecast 2022-2027
- Exhibit 81: Chart on US - Market size and forecast 2022-2027 ($ million)
- Exhibit 82: Data Table on US - Market size and forecast 2022-2027 ($ million)
- Exhibit 83: Chart on US - Year-over-year growth 2022-2027 (%)
- Exhibit 84: Data Table on US - Year-over-year growth 2022-2027 (%)
- 9.9 UK - Market size and forecast 2022-2027
- Exhibit 85: Chart on UK - Market size and forecast 2022-2027 ($ million)
- Exhibit 86: Data Table on UK - Market size and forecast 2022-2027 ($ million)
- Exhibit 87: Chart on UK - Year-over-year growth 2022-2027 (%)
- Exhibit 88: Data Table on UK - Year-over-year growth 2022-2027 (%)
- 9.10 Germany - Market size and forecast 2022-2027
- Exhibit 89: Chart on Germany - Market size and forecast 2022-2027 ($ million)
- Exhibit 90: Data Table on Germany - Market size and forecast 2022-2027 ($ million)
- Exhibit 91: Chart on Germany - Year-over-year growth 2022-2027 (%)
- Exhibit 92: Data Table on Germany - Year-over-year growth 2022-2027 (%)
- 9.11 China - Market size and forecast 2022-2027
- Exhibit 93: Chart on China - Market size and forecast 2022-2027 ($ million)
- Exhibit 94: Data Table on China - Market size and forecast 2022-2027 ($ million)
- Exhibit 95: Chart on China - Year-over-year growth 2022-2027 (%)
- Exhibit 96: Data Table on China - Year-over-year growth 2022-2027 (%)
- 9.12 Japan - Market size and forecast 2022-2027
- Exhibit 97: Chart on Japan - Market size and forecast 2022-2027 ($ million)
- Exhibit 98: Data Table on Japan - Market size and forecast 2022-2027 ($ million)
- Exhibit 99: Chart on Japan - Year-over-year growth 2022-2027 (%)
- Exhibit 100: Data Table on Japan - Year-over-year growth 2022-2027 (%)
- 9.13 Market opportunity by geography
- Exhibit 101: Market opportunity by geography ($ million)
10 Drivers, Challenges, and Trends
- 10.1 Market drivers
- 10.2 Market challenges
- 10.3 Impact of drivers and challenges
- Exhibit 102: Impact of drivers and challenges in 2022 and 2027
- 10.4 Market trends
11 Vendor Landscape
- 11.1 Overview
- 11.2 Vendor landscape
- Exhibit 103: Overview on Criticality of inputs and Factors of differentiation
- 11.3 Landscape disruption
- Exhibit 104: Overview on factors of disruption
- 11.4 Industry risks
- Exhibit 105: Impact of key risks on business
12 Vendor Analysis
- 12.1 Vendors covered
- Exhibit 106: Vendors covered
- 12.2 Market positioning of vendors
- Exhibit 107: Matrix on vendor position and classification
- 12.3 Albertsons Companies Inc.
- Exhibit 108: Albertsons Companies Inc. - Overview
- Exhibit 109: Albertsons Companies Inc. - Product / Service
- Exhibit 110: Albertsons Companies Inc. - Key offerings
- 12.4 Bistro MD LLC
- Exhibit 111: Bistro MD LLC - Overview
- Exhibit 112: Bistro MD LLC - Product / Service
- Exhibit 113: Bistro MD LLC - Key offerings
- 12.5 Blue Apron Holdings Inc.
- Exhibit 114: Blue Apron Holdings Inc. - Overview
- Exhibit 115: Blue Apron Holdings Inc. - Product / Service
- Exhibit 116: Blue Apron Holdings Inc. - Key offerings
- 12.6 Gobble Inc.
- Exhibit 117: Gobble Inc. - Overview
- Exhibit 118: Gobble Inc. - Product / Service
- Exhibit 119: Gobble Inc. - Key offerings
- 12.7 HelloFresh SE
- Exhibit 120: HelloFresh SE - Overview
- Exhibit 121: HelloFresh SE - Business segments
- Exhibit 122: HelloFresh SE - Key news
- Exhibit 123: HelloFresh SE - Key offerings
- Exhibit 124: HelloFresh SE - Segment focus
- 12.8 Koninklijke Ahold Delhaize NV
- Exhibit 125: Koninklijke Ahold Delhaize NV - Overview
- Exhibit 126: Koninklijke Ahold Delhaize NV - Business segments
- Exhibit 127: Koninklijke Ahold Delhaize NV - Key news
- Exhibit 128: Koninklijke Ahold Delhaize NV - Key offerings
- Exhibit 129: Koninklijke Ahold Delhaize NV - Segment focus
- 12.9 Marley Spoon AG
- Exhibit 130: Marley Spoon AG - Overview
- Exhibit 131: Marley Spoon AG - Business segments
- Exhibit 132: Marley Spoon AG - Key offerings
- Exhibit 133: Marley Spoon AG - Segment focus
- 12.10 My Food Bag Ltd.
- Exhibit 134: My Food Bag Ltd. - Overview
- Exhibit 135: My Food Bag Ltd. - Product / Service
- Exhibit 136: My Food Bag Ltd. - Key offerings
- 12.11 Nestle SA
- Exhibit 137: Nestle SA - Overview
- Exhibit 138: Nestle SA - Business segments
- Exhibit 139: Nestle SA - Key news
- Exhibit 140: Nestle SA - Key offerings
- Exhibit 141: Nestle SA - Segment focus
- 12.12 NH Foods Ltd.
- Exhibit 142: NH Foods Ltd. - Overview
- Exhibit 143: NH Foods Ltd. - Business segments
- Exhibit 144: NH Foods Ltd. - Key offerings
- Exhibit 145: NH Foods Ltd. - Segment focus
- 12.13 Oisix ra daichi Inc
- Exhibit 146: Oisix ra daichi Inc - Overview
- Exhibit 147: Oisix ra daichi Inc - Business segments
- Exhibit 148: Oisix ra daichi Inc - Key offerings
- Exhibit 149: Oisix ra daichi Inc - Segment focus
- 12.14 Riverford Organic Farmers Ltd.
- Exhibit 150: Riverford Organic Farmers Ltd. - Overview
- Exhibit 151: Riverford Organic Farmers Ltd. - Product / Service
- Exhibit 152: Riverford Organic Farmers Ltd. - Key offerings
- 12.15 Siam Food Services Ltd.
- Exhibit 153: Siam Food Services Ltd. - Overview
- Exhibit 154: Siam Food Services Ltd. - Product / Service
- Exhibit 155: Siam Food Services Ltd. - Key offerings
- 12.16 SimplyCook Ltd.
- Exhibit 156: SimplyCook Ltd. - Overview
- Exhibit 157: SimplyCook Ltd. - Product / Service
- Exhibit 158: SimplyCook Ltd. - Key offerings
- 12.17 Sun Basket Inc.
- Exhibit 159: Sun Basket Inc. - Overview
- Exhibit 160: Sun Basket Inc. - Product / Service
- Exhibit 161: Sun Basket Inc. - Key offerings
13 Appendix
- 13.1 Scope of the report
- 13.2 Inclusions and exclusions checklist
- Exhibit 162: Inclusions checklist
- Exhibit 163: Exclusions checklist
- 13.3 Currency conversion rates for US$
- Exhibit 164: Currency conversion rates for US$
- 13.4 Research methodology
- Exhibit 165: Research methodology
- Exhibit 166: Validation techniques employed for market sizing
- Exhibit 167: Information sources
- 13.5 List of abbreviations
- Exhibit 168: List of abbreviations
Technavio is a leading global technology research and advisory company. Their research and analysis focus on emerging market trends and provides actionable insights to help businesses identify market opportunities and develop effective strategies to optimize their market positions. With over 500 specialized analysts, Technavio's report library consists of more than 17,000 reports and counting, covering 800 technologies, spanning across 50 countries. Their client base consists of enterprises of all sizes, including more than 100 Fortune 500 companies. This growing client base relies on Technavio's comprehensive coverage, extensive research, and actionable market insights to identify opportunities in existing and potential markets and assess their competitive positions within changing market scenarios.
Technavio Research
Jesse Maida
Media & Marketing Executive
US: +1 844 364 1100
UK: +44 203 893 3200
Email: media@technavio.com
Website: www.technavio.com/


SOURCE Technavio
© 2024 Benzinga.com. Benzinga does not provide investment advice. All rights reserved.
Trade confidently with insights and alerts from analyst ratings, free reports and breaking news that affects the stocks you care about.

