


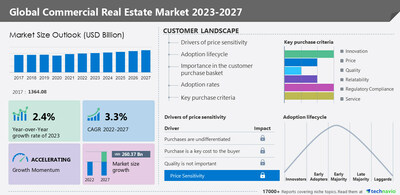
NEW YORK, Feb. 28, 2023 /PRNewswire/ -- The commercial real estate market size is expected to grow by USD 260.37 billion from 2022 to 2027 at a CAGR of 3.3%, according to Technavio. The growing commercial sector is driving market growth. In emerging economies such as China, Thailand, Malaysia, and Indonesia, the retail construction industry will be supported by rapid industrialization and urbanization. Large corporations from the US, Europe, and Japan consider India as a prospective market. As a result, the country has witnessed significant growth in foreign investments in the commercial building sector. For more insights on the historic (2017 to 2021) and forecast market size (2023 to 2027) - Request a sample report.

Commercial real estate market 2023-2027: Scope
Technavio presents a detailed picture of the market by the way of study, synthesis, and summation of data from multiple sources. Our commercial real estate market report covers the following areas:
- Commercial real estate market size
- Commercial real estate market trends
- Commercial real estate market industry analysis
Commercial real estate market 2023-2027: Segmentation
- End-user
- Offices: The market share growth by this segment will be significant during the forecast period. This growth is attributed to factors such as the increasing demand for commercial offices from industrial sector companies. MNCs are investing in commercial spaces such as offices, especially in developing countries, to expand their global presence. Various investors are investing in commercial offices to guarantee high returns on investment. Such factors will drive the segment's growth during the forecast period.
- Retail
- Leisure
- Others
- Geography
- APAC: APAC is projected to account for 52% of the market growth during the forecast period. The growth of the industrial sector has increased the demand for commercial office spaces, which has fueled the regional market's growth. China, Japan, India, South Korea, and Singapore are some of the key countries in the market in the region. In addition, consumers' investments in commercial developments owing to high disposable incomes and evolving lifestyles will also drive the regional market's growth.
- North America
- Europe
- South America
- Middle East And Africa
For insights on global, regional, and country-level parameters with growth opportunities , historic (2017 to 2021) and forecast market size (2023 to 2027) Download a sample
Commercial real estate market 2023-2027: Vendor Analysis
ATC Group Services LLC, Boston Commercial Properties Inc., Brookfield Business Partners LP, CBRE Group Inc., DLF Ltd., Keller Williams Realty Inc., Lee and Associates Licensing and Administration Co. LP, Link Asset Management Ltd., MARCUS and MILLICHAP Inc., MaxWell Realty Canada, NAI Global, Nakheel PJSC, Onni Contracting Ltd., Prologis Inc., RAK Properties PJSC, Segro Plc, Shannon Waltchack, TCN Worldwide, Wanda Group, and WeWork Companies LLC are some of the major market participants.
Key vendor offerings
- ATC Group Services LLC - The company offers solutions for commercial real estate.
- Boston Commercial Properties Inc. - The company offers solutions for commercial real estate that includes initial space programming, verifying assumptions of space needs, and investigating and assessing suitable alternative properties.
- Brookfield Business Partners LP - The company offers solutions for commercial real estate, which include office, retail, multifamily, logistics, hospitality, land and housing, triple net lease, manufactured housing, and student housing assets on different continents.
- CBRE Group Inc. - The company offers solutions for commercial real estate comprising car parks, offices, logistics centers, and different retail outlets.
- DLF Ltd. - The company offers solutions for commercial real estate, which involves design expertise, technology, advanced safety systems, and sustainability.
Commercial real estate market 2023-2027: Key highlights
- CAGR of the market during the forecast period 2023-2027
- Detailed information on factors that will assist commercial real estate market growth during the next five years
- Estimation of the commercial real estate market size and its contribution to the parent market
- Predictions on upcoming trends and changes in consumer behavior
- The growth of the commercial real estate market
- Analysis of the market's competitive landscape and detailed information on vendors
- Comprehensive details of factors that will challenge the growth of commercial real estate market vendors
Why buy?
- Add credibility to strategy
- Analyzes competitor's offerings
- Get a holistic view of the market
Grow your profit margin with Technavio – Buy the report!
Related Reports:
The Europe commercial real estate market is estimated to grow at a CAGR of 5.55% between 2022 and 2027. The size of the market is forecasted to increase by USD 80.59 billion. This report extensively covers market segmentation by end-user (offices, retail, leisure, and others) and type (rental, lease, and sales). It also includes an in-depth analysis of drivers, trends, and challenges.
The residential real estate market is estimated to grow at a CAGR of 5.07% between 2022 and 2027. The size of the market is forecasted to increase by USD 514.41 billion. This report extensively covers market segmentation by mode of booking (sales and rental/lease), type (apartments, condominiums, landed houses, and villas), and geography (APAC, North America, Europe, South America, and Middle East and Africa).
Gain instant access to 17,000+ market research reports.
Technavio's SUBSCRIPTION platform
Commercial Real Estate Market Scope | |
Report Coverage | Details |
Base year | 2022 |
Historic period | 2017-2021 |
Forecast period | 2023-2027 |
Growth momentum & CAGR | Accelerate at a CAGR of 3.3% |
Market growth 2023-2027 | USD 260.37 billion |
Market structure | Fragmented |
YoY growth 2022-2023 (%) | 2.4 |
Regional analysis | APAC, North America, Europe, South America, and Middle East and Africa |
Performing market contribution | APAC at 52% |
Key countries | US, China, Japan, Germany, UK, India, Canada, Mexico, Italy,Spain, Australia, and South Korea |
Competitive landscape | Leading vendors, market positioning of vendors, competitive strategies, and industry risks |
Key companies profiled | ATC Group Services LLC, Boston Commercial Properties Inc., Brookfield Business Partners LP, CBRE Group Inc., DLF Ltd., Keller Williams Realty Inc., Lee and Associates Licensing and Administration Co. LP, Link Asset Management Ltd., MARCUS and MILLICHAP Inc., MaxWell Realty Canada, NAI Global, Nakheel PJSC, Onni Contracting Ltd., Prologis Inc., RAK Properties PJSC, Segro Plc, Shannon Waltchack, TCN Worldwide, Wanda Group, and WeWork Companies LLC |
Market dynamics | Parent market analysis, market growth inducers and obstacles, fast-growing and slow-growing segment analysis, COVID-19 impact and recovery analysis and future consumer dynamics, and market condition analysis for the forecast period. |
Customization purview | If our report has not included the data that you are looking for, you can reach out to our analysts and get segments customized. |
Browse for Technavio consumer discretionary market reports
Table of Contents :
1 Executive Summary
- 1.1 Market overview
- Exhibit 01: Executive Summary – Chart on Market Overview
- Exhibit 02: Executive Summary – Data Table on Market Overview
- Exhibit 03: Executive Summary – Chart on Global Market Characteristics
- Exhibit 04: Executive Summary – Chart on Market by Geography
- Exhibit 05: Executive Summary – Chart on Market Segmentation by End-user
- Exhibit 06: Executive Summary – Chart on Incremental Growth
- Exhibit 07: Executive Summary – Data Table on Incremental Growth
- Exhibit 08: Executive Summary – Chart on Vendor Market Positioning
2 Market Landscape
- 2.1 Market ecosystem
- Exhibit 09: Parent market
- Exhibit 10: Market Characteristics
3 Market Sizing
- 3.1 Market definition
- Exhibit 11: Offerings of vendors included in the market definition
- 3.2 Market segment analysis
- Exhibit 12: Market segments
- 3.3 Market size 2022
- 3.4 Market outlook: Forecast for 2022-2027
- Exhibit 13: Chart on Global - Market size and forecast 2022-2027 ($ billion)
- Exhibit 14: Data Table on Global - Market size and forecast 2022-2027 ($ billion)
- Exhibit 15: Chart on Global Market: Year-over-year growth 2022-2027 (%)
- Exhibit 16: Data Table on Global Market: Year-over-year growth 2022-2027 (%)
4 Historic Market Size
- 4.1 Global commercial real estate market 2017 - 2021
- Exhibit 17: Historic Market Size – Data Table on Global commercial real estate market 2017 - 2021 ($ billion)
- 4.2 End-user Segment Analysis 2017 - 2021
- Exhibit 18: Historic Market Size – End-user Segment 2017 - 2021 ($ billion)
- 4.3 Geography Segment Analysis 2017 - 2021
- Exhibit 19: Historic Market Size – Geography Segment 2017 - 2021 ($ billion)
- 4.4 Country Segment Analysis 2017 - 2021
- Exhibit 20: Historic Market Size – Country Segment 2017 - 2021 ($ billion)
5 Five Forces Analysis
- 5.1 Five forces summary
- Exhibit 21: Five forces analysis - Comparison between 2022 and 2027
- 5.2 Bargaining power of buyers
- Exhibit 22: Chart on Bargaining power of buyers – Impact of key factors 2022 and 2027
- 5.3 Bargaining power of suppliers
- Exhibit 23: Bargaining power of suppliers – Impact of key factors in 2022 and 2027
- 5.4 Threat of new entrants
- Exhibit 24: Threat of new entrants – Impact of key factors in 2022 and 2027
- 5.5 Threat of substitutes
- Exhibit 25: Threat of substitutes – Impact of key factors in 2022 and 2027
- 5.6 Threat of rivalry
- Exhibit 26: Threat of rivalry – Impact of key factors in 2022 and 2027
- 5.7 Market condition
- Exhibit 27: Chart on Market condition - Five forces 2022 and 2027
6 Market Segmentation by End-user
- 6.1 Market segments
- Exhibit 28: Chart on End-user - Market share 2022-2027 (%)
- Exhibit 29: Data Table on End-user - Market share 2022-2027 (%)
- 6.2 Comparison by End-user
- Exhibit 30: Chart on Comparison by End-user
- Exhibit 31: Data Table on Comparison by End-user
- 6.3 Offices - Market size and forecast 2022-2027
- Exhibit 32: Chart on Offices - Market size and forecast 2022-2027 ($ billion)
- Exhibit 33: Data Table on Offices - Market size and forecast 2022-2027 ($ billion)
- Exhibit 34: Chart on Offices - Year-over-year growth 2022-2027 (%)
- Exhibit 35: Data Table on Offices - Year-over-year growth 2022-2027 (%)
- 6.4 Retail - Market size and forecast 2022-2027
- Exhibit 36: Chart on Retail - Market size and forecast 2022-2027 ($ billion)
- Exhibit 37: Data Table on Retail - Market size and forecast 2022-2027 ($ billion)
- Exhibit 38: Chart on Retail - Year-over-year growth 2022-2027 (%)
- Exhibit 39: Data Table on Retail - Year-over-year growth 2022-2027 (%)
- 6.5 Leisure - Market size and forecast 2022-2027
- Exhibit 40: Chart on Leisure - Market size and forecast 2022-2027 ($ billion)
- Exhibit 41: Data Table on Leisure - Market size and forecast 2022-2027 ($ billion)
- Exhibit 42: Chart on Leisure - Year-over-year growth 2022-2027 (%)
- Exhibit 43: Data Table on Leisure - Year-over-year growth 2022-2027 (%)
- 6.6 Others - Market size and forecast 2022-2027
- Exhibit 44: Chart on Others - Market size and forecast 2022-2027 ($ billion)
- Exhibit 45: Data Table on Others - Market size and forecast 2022-2027 ($ billion)
- Exhibit 46: Chart on Others - Year-over-year growth 2022-2027 (%)
- Exhibit 47: Data Table on Others - Year-over-year growth 2022-2027 (%)
- 6.7 Market opportunity by End-user
- Exhibit 48: Market opportunity by End-user ($ billion)
7 Customer Landscape
- 7.1 Customer landscape overview
- Exhibit 49: Analysis of price sensitivity, lifecycle, customer purchase basket, adoption rates, and purchase criteria
8 Geographic Landscape
- 8.1 Geographic segmentation
- Exhibit 50: Chart on Market share by geography 2022-2027 (%)
- Exhibit 51: Data Table on Market share by geography 2022-2027 (%)
- 8.2 Geographic comparison
- Exhibit 52: Chart on Geographic comparison
- Exhibit 53: Data Table on Geographic comparison
- 8.3 APAC - Market size and forecast 2022-2027
- Exhibit 54: Chart on APAC - Market size and forecast 2022-2027 ($ billion)
- Exhibit 55: Data Table on APAC - Market size and forecast 2022-2027 ($ billion)
- Exhibit 56: Chart on APAC - Year-over-year growth 2022-2027 (%)
- Exhibit 57: Data Table on APAC - Year-over-year growth 2022-2027 (%)
- 8.4 North America - Market size and forecast 2022-2027
- Exhibit 58: Chart on North America - Market size and forecast 2022-2027 ($ billion)
- Exhibit 59: Data Table on North America - Market size and forecast 2022-2027 ($ billion)
- Exhibit 60: Chart on North America - Year-over-year growth 2022-2027 (%)
- Exhibit 61: Data Table on North America - Year-over-year growth 2022-2027 (%)
- 8.5 Europe - Market size and forecast 2022-2027
- Exhibit 62: Chart on Europe - Market size and forecast 2022-2027 ($ billion)
- Exhibit 63: Data Table on Europe - Market size and forecast 2022-2027 ($ billion)
- Exhibit 64: Chart on Europe - Year-over-year growth 2022-2027 (%)
- Exhibit 65: Data Table on Europe - Year-over-year growth 2022-2027 (%)
- 8.6 South America - Market size and forecast 2022-2027
- Exhibit 66: Chart on South America - Market size and forecast 2022-2027 ($ billion)
- Exhibit 67: Data Table on South America - Market size and forecast 2022-2027 ($ billion)
- Exhibit 68: Chart on South America - Year-over-year growth 2022-2027 (%)
- Exhibit 69: Data Table on South America - Year-over-year growth 2022-2027 (%)
- 8.7 Middle East and Africa - Market size and forecast 2022-2027
- Exhibit 70: Chart on Middle East and Africa - Market size and forecast 2022-2027 ($ billion)
- Exhibit 71: Data Table on Middle East and Africa - Market size and forecast 2022-2027 ($ billion)
- Exhibit 72: Chart on Middle East and Africa - Year-over-year growth 2022-2027 (%)
- Exhibit 73: Data Table on Middle East and Africa - Year-over-year growth 2022-2027 (%)
- 8.8 US - Market size and forecast 2022-2027
- Exhibit 74: Chart on US - Market size and forecast 2022-2027 ($ billion)
- Exhibit 75: Data Table on US - Market size and forecast 2022-2027 ($ billion)
- Exhibit 76: Chart on US - Year-over-year growth 2022-2027 (%)
- Exhibit 77: Data Table on US - Year-over-year growth 2022-2027 (%)
- 8.9 China - Market size and forecast 2022-2027
- Exhibit 78: Chart on China - Market size and forecast 2022-2027 ($ billion)
- Exhibit 79: Data Table on China - Market size and forecast 2022-2027 ($ billion)
- Exhibit 80: Chart on China - Year-over-year growth 2022-2027 (%)
- Exhibit 81: Data Table on China - Year-over-year growth 2022-2027 (%)
- 8.10 Japan - Market size and forecast 2022-2027
- Exhibit 82: Chart on Japan - Market size and forecast 2022-2027 ($ billion)
- Exhibit 83: Data Table on Japan - Market size and forecast 2022-2027 ($ billion)
- Exhibit 84: Chart on Japan - Year-over-year growth 2022-2027 (%)
- Exhibit 85: Data Table on Japan - Year-over-year growth 2022-2027 (%)
- 8.11 Germany - Market size and forecast 2022-2027
- Exhibit 86: Chart on Germany - Market size and forecast 2022-2027 ($ billion)
- Exhibit 87: Data Table on Germany - Market size and forecast 2022-2027 ($ billion)
- Exhibit 88: Chart on Germany - Year-over-year growth 2022-2027 (%)
- Exhibit 89: Data Table on Germany - Year-over-year growth 2022-2027 (%)
- 8.12 UK - Market size and forecast 2022-2027
- Exhibit 90: Chart on UK - Market size and forecast 2022-2027 ($ billion)
- Exhibit 91: Data Table on UK - Market size and forecast 2022-2027 ($ billion)
- Exhibit 92: Chart on UK - Year-over-year growth 2022-2027 (%)
- Exhibit 93: Data Table on UK - Year-over-year growth 2022-2027 (%)
- 8.13 Market opportunity by geography
- Exhibit 94: Market opportunity by geography ($ billion)
9 Drivers, Challenges, and Trends
- 9.1 Market drivers
- 9.2 Market challenges
- 9.3 Impact of drivers and challenges
- Exhibit 95: Impact of drivers and challenges in 2022 and 2027
- 9.4 Market trends
10 Vendor Landscape
- 10.1 Overview
- 10.2 Vendor landscape
- Exhibit 96: Overview on Criticality of inputs and Factors of differentiation
- 10.3 Landscape disruption
- Exhibit 97: Overview on factors of disruption
- 10.4 Industry risks
- Exhibit 98: Impact of key risks on business
11 Vendor Analysis
- 11.1 Vendors covered
- Exhibit 99: Vendors covered
- 11.2 Market positioning of vendors
- Exhibit 100: Matrix on vendor position and classification
- 11.3 ATC Group Services LLC
- Exhibit 101: ATC Group Services LLC - Overview
- Exhibit 102: ATC Group Services LLC - Product / Service
- Exhibit 103: ATC Group Services LLC - Key offerings
- 11.4 Boston Commercial Properties Inc.
- Exhibit 104: Boston Commercial Properties Inc. - Overview
- Exhibit 105: Boston Commercial Properties Inc. - Product / Service
- Exhibit 106: Boston Commercial Properties Inc. - Key offerings
- 11.5 Brookfield Business Partners LP
- Exhibit 107: Brookfield Business Partners LP - Overview
- Exhibit 108: Brookfield Business Partners LP - Business segments
- Exhibit 109: Brookfield Business Partners LP - Key offerings
- Exhibit 110: Brookfield Business Partners LP - Segment focus
- 11.6 CBRE Group Inc.
- Exhibit 111: CBRE Group Inc. - Overview
- Exhibit 112: CBRE Group Inc. - Business segments
- Exhibit 113: CBRE Group Inc. - Key offerings
- Exhibit 114: CBRE Group Inc. - Segment focus
- 11.7 DLF Ltd.
- Exhibit 115: DLF Ltd. - Overview
- Exhibit 116: DLF Ltd. - Product / Service
- Exhibit 117: DLF Ltd. - Key offerings
- 11.8 Link Asset Management Ltd.
- Exhibit 118: Link Asset Management Ltd. - Overview
- Exhibit 119: Link Asset Management Ltd. - Product / Service
- Exhibit 120: Link Asset Management Ltd. - Key offerings
- 11.9 MaxWell Realty Canada
- Exhibit 121: MaxWell Realty Canada - Overview
- Exhibit 122: MaxWell Realty Canada - Product / Service
- Exhibit 123: MaxWell Realty Canada - Key offerings
- 11.10 Nakheel PJSC
- Exhibit 124: Nakheel PJSC - Overview
- Exhibit 125: Nakheel PJSC - Product / Service
- Exhibit 126: Nakheel PJSC - Key offerings
- 11.11 Onni Contracting Ltd.
- Exhibit 127: Onni Contracting Ltd. - Overview
- Exhibit 128: Onni Contracting Ltd. - Product / Service
- Exhibit 129: Onni Contracting Ltd. - Key offerings
- 11.12 Prologis Inc.
- Exhibit 130: Prologis Inc. - Overview
- Exhibit 131: Prologis Inc. - Business segments
- Exhibit 132: Prologis Inc. - Key news
- Exhibit 133: Prologis Inc. - Key offerings
- Exhibit 134: Prologis Inc. - Segment focus
- 11.13 RAK Properties PJSC
- Exhibit 135: RAK Properties PJSC - Overview
- Exhibit 136: RAK Properties PJSC - Business segments
- Exhibit 137: RAK Properties PJSC - Key offerings
- Exhibit 138: RAK Properties PJSC - Segment focus
- 11.14 Segro Plc
- Exhibit 139: Segro Plc - Overview
- Exhibit 140: Segro Plc - Business segments
- Exhibit 141: Segro Plc - Key offerings
- Exhibit 142: Segro Plc - Segment focus
- 11.15 Shannon Waltchack
- Exhibit 143: Shannon Waltchack - Overview
- Exhibit 144: Shannon Waltchack - Product / Service
- Exhibit 145: Shannon Waltchack - Key offerings
- 11.16 Wanda Group
- Exhibit 146: Wanda Group - Overview
- Exhibit 147: Wanda Group - Product / Service
- Exhibit 148: Wanda Group - Key offerings
- 11.17 WeWork Companies LLC
- Exhibit 149: WeWork Companies LLC - Overview
- Exhibit 150: WeWork Companies LLC - Product / Service
- Exhibit 151: WeWork Companies LLC - Key news
- Exhibit 152: WeWork Companies LLC - Key offerings
12 Appendix
- 12.1 Scope of the report
- 12.2 Inclusions and exclusions checklist
- Exhibit 153: Inclusions checklist
- Exhibit 154: Exclusions checklist
- 12.3 Currency conversion rates for US$
- Exhibit 155: Currency conversion rates for US$
- 12.4 Research methodology
- Exhibit 156: Research methodology
- Exhibit 157: Validation techniques employed for market sizing
- Exhibit 158: Information sources
- 12.5 List of abbreviations
- Exhibit 159: List of abbreviations
About Us
Technavio is a leading global technology research and advisory company. Their research and analysis focus on emerging market trends and provide actionable insights to help businesses identify market opportunities and develop effective strategies to optimize their market positions. With over 500 specialized analysts, Technavio's report library consists of more than 17,000 reports and counting, covering 800 technologies, spanning across 50 countries. Their client base consists of enterprises of all sizes, including more than 100 Fortune 500 companies. This growing client base relies on Technavio's comprehensive coverage, extensive research, and actionable market insights to identify opportunities in existing and potential markets and assess their competitive positions within changing market scenarios.
Contact
Technavio Research
Jesse Maida
Media & Marketing Executive
US: +1 844 364 1100
UK: +44 203 893 3200
Email: media@technavio.com
Website: www.technavio.com/


SOURCE Technavio
© 2024 Benzinga.com. Benzinga does not provide investment advice. All rights reserved.
Trade confidently with insights and alerts from analyst ratings, free reports and breaking news that affects the stocks you care about.

