


NEW YORK, Jan. 25, 2023 /PRNewswire/ -- Japan is one of the global leaders in the industrial machinery and equipment industries. The core areas in Japan's manufacturing sector are consumer electronics, automobile manufacturing, semiconductor manufacturing, and optical fibers among others. Demand will continue to grow in Japan in the future as current market developments demonstrate a significant increase in demand for technology-based advanced machinery, To know more - Buy the Report!

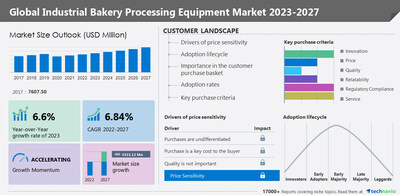
The global industrial bakery processing equipment market is estimated to grow at a CAGR of 6.84% between 2022 and 2027. The size of the market is forecast to increase by USD 3,315.12 million. The growth of the market depends on serval factors, including a rise in demand for frozen bakery products, expansion of bakery processing plants, and the development of new designs allowing equipment flexibility. However, the existing market for used and refurbished equipment may impede market growth.
The slowdown in the manufacturing industry, the rising trade war between the US and China, and the impact of the COVID-19 pandemic hampered the industrial output globally. Major manufacturing companies witnessed a decline in demand for industrial machinery and adopted for cyclic production to align the output with demand. Industries such as oil and gas, automotive, chemical and petrochemical, and aerospace, which are the major end-users of industrial machinery, announced drastic measures to overcome the demand and supply imbalance. Such a cyclic production cycle and the slowdown in demand for industrial machinery impacted the CAPEX in new manufacturing facilities, thereby hampering the demand for industrial machinery. Furthermore, the prevalence of COVID-19 drastically impacted the growth of the global industrial machinery market in 2020 and mid-2021. Most major manufacturing activities globally were stalled in H1 2020 owing to the increase in cases of COVID-19. Thus, the demand for industrial machinery is expected to witness slow growth during the forecast period.
Technavio report extensively covers market segmentation by end-user (bakery processing industry and food service industry), product (ovens and proofers, mixers and blenders, sheeters and molders, dividers and rounders, and others), and geography (Europe, North America, APAC, South America, and Middle East and Africa).
Vendors are implementing various strategies, such as strategic alliances, partnerships, mergers and acquisitions, geographical expansion, and product/service launches, to enhance their presence in the market. The report also includes detailed analyses of the competitive landscape of the market and information about 15 market vendors, Ali Group Srl, Allied Bakery Equipment and Machine Co. Inc., ANKO Food Machine Co. Ltd., Buhler AG, Colom Bakery Equipment SL, Erika record LLC, FRITSCH Bakery Technologies GmbH and Co. KG, GEA Group AG, Gemini Bakery Equipment Co., Global Bakery Solutions Ltd., Heat and Control Inc., Industrial Bakery Line Srl, John Bean Technologies Corp., Koenig Maschinen GmbH, Markel Corp., Peerless Food Equipment, Rademaker BV, Schenck Process Holding GmbH, The Middleby Corp., and Wilkinson Baking Co. among others. To know about the vendor offerings - Request a Sample Now!
Industrial Bakery Processing Equipment Market 2023-2027: Key Highlights
- CAGR of the market during the forecast period 2023-2027
- Detailed information on factors that will assist industrial bakery processing equipment market growth during the next five years
- Estimation of the industrial bakery processing equipment market size and its contribution to the parent market
- Predictions on upcoming trends and changes in consumer behavior
- The growth of the industrial bakery processing equipment market
- Analysis of the market's competitive landscape and detailed information on vendors
- Comprehensive details of factors that will challenge the growth of industrial bakery processing equipment market vendors
Gain instant access to 17,000+ market research reports.
Technavio's SUBSCRIPTION platform
Related Reports -
The ice cream processing equipment market is estimated to grow at a CAGR of 3.79% between 2022 and 2027. The size of the market is forecast to increase by USD 1,949.64 million. The growth of the market depends on serval factors, including an increase in the number of ice cream parlors, shelf life extension of food products, and increasing popularity of plant-based ice cream.
The dairy processing equipment market is estimated to grow at a CAGR of 5.77% between 2022 and 2027. The size of the market is forecast to increase by USD 3,268.57 million. The growth of the market depends on serval factors, including the growing market for fortified dairy products, growing preference for cost-saving and energy-efficient equipment, and compliance of dairy processing companies with standards and regulations.
Industrial Bakery Processing Equipment Market Scope | |
Report Coverage | Details |
Page number | 168 |
Base year | 2022 |
Historic period | 2017-2021 |
Forecast period | 2023-2027 |
Growth momentum & CAGR | Accelerate at a CAGR of 6.84% |
Market growth 2023-2027 | $ 3315.12 million |
Market structure | Fragmented |
YoY growth 2022-2023(%) | 6.6 |
Regional analysis | Europe, North America, APAC, South America, and Middle East and Africa |
Performing market contribution | North America at 31% |
Key countries | US, China, Japan, Italy, and Germany |
Competitive landscape | Leading Vendors, Market Positioning of Vendors, Competitive Strategies, and Industry Risks |
Key companies profiled | Ali Group Srl, Allied Bakery Equipment and Machine Co. Inc., ANKO Food Machine Co. Ltd., Buhler AG, Colom Bakery Equipment SL, Erika record LLC, FRITSCH Bakery Technologies GmbH and Co. KG, GEA Group AG, Gemini Bakery Equipment Co., Global Bakery Solutions Ltd., Heat and Control Inc., Industrial Bakery Line Srl, John Bean Technologies Corp., Koenig Maschinen GmbH, Markel Corp., Peerless Food Equipment, Rademaker BV, Schenck Process Holding GmbH, The Middleby Corp., and Wilkinson Baking Co. |
Market dynamics | Parent market analysis, Market growth inducers and obstacles, Fast-growing and slow-growing segment analysis, COVID 19 impact and recovery analysis and future consumer dynamics, Market condition analysis for forecast period |
Customization purview | If our report has not included the data that you are looking for, you can reach out to our analysts and get segments customized. |
Table of Contents:
1 Executive Summary
- 1.1 Market overview
- Exhibit 01: Executive Summary – Chart on Market Overview
- Exhibit 02: Executive Summary – Data Table on Market Overview
- Exhibit 03: Executive Summary – Chart on Global Market Characteristics
- Exhibit 04: Executive Summary – Chart on Market by Geography
- Exhibit 05: Executive Summary – Chart on Market Segmentation by End-user
- Exhibit 06: Executive Summary – Chart on Market Segmentation by Product
- Exhibit 07: Executive Summary – Chart on Incremental Growth
- Exhibit 08: Executive Summary – Data Table on Incremental Growth
- Exhibit 09: Executive Summary – Chart on Vendor Market Positioning
2 Market Landscape
- 2.1 Market ecosystem
- Exhibit 10: Parent market
- Exhibit 11: Market Characteristics
3 Market Sizing
- 3.1 Market definition
- Exhibit 12: Offerings of vendors included in the market definition
- 3.2 Market segment analysis
- Exhibit 13: Market segments
- 3.3 Market size 2022
- 3.4 Market outlook: Forecast for 2022-2027
- Exhibit 14: Chart on Global - Market size and forecast 2022-2027 ($ million)
- Exhibit 15: Data Table on Global - Market size and forecast 2022-2027 ($ million)
- Exhibit 16: Chart on Global Market: Year-over-year growth 2022-2027 (%)
- Exhibit 17: Data Table on Global Market: Year-over-year growth 2022-2027 (%)
4 Historic Market Size
- 4.1 Global industrial bakery processing equipment market 2017 - 2021
- Exhibit 18: Historic Market Size – Data Table on Global industrial bakery processing equipment market 2017 - 2021 ($ million)
- 4.2 End user Segment Analysis 2017 - 2021
- Exhibit 19: Historic Market Size – End user Segment 2017 - 2021 ($ million)
- 4.3 Product Segment Analysis 2017 - 2021
- Exhibit 20: Historic Market Size – Product Segment 2017 - 2021 ($ million)
- 4.4 Geography Segment Analysis 2017 - 2021
- Exhibit 21: Historic Market Size – Geography Segment 2017 - 2021 ($ million)
- 4.5 Country Segment Analysis 2017 - 2021
- Exhibit 22: Historic Market Size – Country Segment 2017 - 2021 ($ million)
5 Five Forces Analysis
- 5.1 Five forces summary
- Exhibit 23: Five forces analysis - Comparison between 2022 and 2027
- 5.2 Bargaining power of buyers
- Exhibit 24: Chart on Bargaining power of buyers – Impact of key factors 2022 and 2027
- 5.3 Bargaining power of suppliers
- Exhibit 25: Bargaining power of suppliers – Impact of key factors in 2022 and 2027
- 5.4 Threat of new entrants
- Exhibit 26: Threat of new entrants – Impact of key factors in 2022 and 2027
- 5.5 Threat of substitutes
- Exhibit 27: Threat of substitutes – Impact of key factors in 2022 and 2027
- 5.6 Threat of rivalry
- Exhibit 28: Threat of rivalry – Impact of key factors in 2022 and 2027
- 5.7 Market condition
- Exhibit 29: Chart on Market condition - Five forces 2022 and 2027
6 Market Segmentation by End-user
- 6.1 Market segments
- Exhibit 30: Chart on End-user - Market share 2022-2027 (%)
- Exhibit 31: Data Table on End-user - Market share 2022-2027 (%)
- 6.2 Comparison by End-user
- Exhibit 32: Chart on Comparison by End-user
- Exhibit 33: Data Table on Comparison by End-user
- 6.3 Bakery processing industry - Market size and forecast 2022-2027
- Exhibit 34: Chart on Bakery processing industry - Market size and forecast 2022-2027 ($ million)
- Exhibit 35: Data Table on Bakery processing industry - Market size and forecast 2022-2027 ($ million)
- Exhibit 36: Chart on Bakery processing industry - Year-over-year growth 2022-2027 (%)
- Exhibit 37: Data Table on Bakery processing industry - Year-over-year growth 2022-2027 (%)
- 6.4 Foodservice industry - Market size and forecast 2022-2027
- Exhibit 38: Chart on Foodservice industry - Market size and forecast 2022-2027 ($ million)
- Exhibit 39: Data Table on Foodservice industry - Market size and forecast 2022-2027 ($ million)
- Exhibit 40: Chart on Foodservice industry - Year-over-year growth 2022-2027 (%)
- Exhibit 41: Data Table on Foodservice industry - Year-over-year growth 2022-2027 (%)
- 6.5 Market opportunity by End-user
- Exhibit 42: Market opportunity by End-user ($ million)
7 Market Segmentation by Product
- 7.1 Market segments
- Exhibit 43: Chart on Product - Market share 2022-2027 (%)
- Exhibit 44: Data Table on Product - Market share 2022-2027 (%)
- 7.2 Comparison by Product
- Exhibit 45: Chart on Comparison by Product
- Exhibit 46: Data Table on Comparison by Product
- 7.3 Ovens and proofers - Market size and forecast 2022-2027
- Exhibit 47: Chart on Ovens and proofers - Market size and forecast 2022-2027 ($ million)
- Exhibit 48: Data Table on Ovens and proofers - Market size and forecast 2022-2027 ($ million)
- Exhibit 49: Chart on Ovens and proofers - Year-over-year growth 2022-2027 (%)
- Exhibit 50: Data Table on Ovens and proofers - Year-over-year growth 2022-2027 (%)
- 7.4 Mixers and blenders - Market size and forecast 2022-2027
- Exhibit 51: Chart on Mixers and blenders - Market size and forecast 2022-2027 ($ million)
- Exhibit 52: Data Table on Mixers and blenders - Market size and forecast 2022-2027 ($ million)
- Exhibit 53: Chart on Mixers and blenders - Year-over-year growth 2022-2027 (%)
- Exhibit 54: Data Table on Mixers and blenders - Year-over-year growth 2022-2027 (%)
- 7.5 Sheeters and molders - Market size and forecast 2022-2027
- Exhibit 55: Chart on Sheeters and molders - Market size and forecast 2022-2027 ($ million)
- Exhibit 56: Data Table on Sheeters and molders - Market size and forecast 2022-2027 ($ million)
- Exhibit 57: Chart on Sheeters and molders - Year-over-year growth 2022-2027 (%)
- Exhibit 58: Data Table on Sheeters and molders - Year-over-year growth 2022-2027 (%)
- 7.6 Dividers and rounders - Market size and forecast 2022-2027
- Exhibit 59: Chart on Dividers and rounders - Market size and forecast 2022-2027 ($ million)
- Exhibit 60: Data Table on Dividers and rounders - Market size and forecast 2022-2027 ($ million)
- Exhibit 61: Chart on Dividers and rounders - Year-over-year growth 2022-2027 (%)
- Exhibit 62: Data Table on Dividers and rounders - Year-over-year growth 2022-2027 (%)
- 7.7 Others - Market size and forecast 2022-2027
- Exhibit 63: Chart on Others - Market size and forecast 2022-2027 ($ million)
- Exhibit 64: Data Table on Others - Market size and forecast 2022-2027 ($ million)
- Exhibit 65: Chart on Others - Year-over-year growth 2022-2027 (%)
- Exhibit 66: Data Table on Others - Year-over-year growth 2022-2027 (%)
- 7.8 Market opportunity by Product
- Exhibit 67: Market opportunity by Product ($ million)
8 Customer Landscape
- 8.1 Customer landscape overview
- Exhibit 68: Analysis of price sensitivity, lifecycle, customer purchase basket, adoption rates, and purchase criteria
9 Geographic Landscape
- 9.1 Geographic segmentation
- Exhibit 69: Chart on Market share by geography 2022-2027 (%)
- Exhibit 70: Data Table on Market share by geography 2022-2027 (%)
- 9.2 Geographic comparison
- Exhibit 71: Chart on Geographic comparison
- Exhibit 72: Data Table on Geographic comparison
- 9.3 Europe - Market size and forecast 2022-2027
- Exhibit 73: Chart on Europe - Market size and forecast 2022-2027 ($ million)
- Exhibit 74: Data Table on Europe - Market size and forecast 2022-2027 ($ million)
- Exhibit 75: Chart on Europe - Year-over-year growth 2022-2027 (%)
- Exhibit 76: Data Table on Europe - Year-over-year growth 2022-2027 (%)
- 9.4 North America - Market size and forecast 2022-2027
- Exhibit 77: Chart on North America - Market size and forecast 2022-2027 ($ million)
- Exhibit 78: Data Table on North America - Market size and forecast 2022-2027 ($ million)
- Exhibit 79: Chart on North America - Year-over-year growth 2022-2027 (%)
- Exhibit 80: Data Table on North America - Year-over-year growth 2022-2027 (%)
- 9.5 APAC - Market size and forecast 2022-2027
- Exhibit 81: Chart on APAC - Market size and forecast 2022-2027 ($ million)
- Exhibit 82: Data Table on APAC - Market size and forecast 2022-2027 ($ million)
- Exhibit 83: Chart on APAC - Year-over-year growth 2022-2027 (%)
- Exhibit 84: Data Table on APAC - Year-over-year growth 2022-2027 (%)
- 9.6 South America - Market size and forecast 2022-2027
- Exhibit 85: Chart on South America - Market size and forecast 2022-2027 ($ million)
- Exhibit 86: Data Table on South America - Market size and forecast 2022-2027 ($ million)
- Exhibit 87: Chart on South America - Year-over-year growth 2022-2027 (%)
- Exhibit 88: Data Table on South America - Year-over-year growth 2022-2027 (%)
- 9.7 Middle East and Africa - Market size and forecast 2022-2027
- Exhibit 89: Chart on Middle East and Africa - Market size and forecast 2022-2027 ($ million)
- Exhibit 90: Data Table on Middle East and Africa - Market size and forecast 2022-2027 ($ million)
- Exhibit 91: Chart on Middle East and Africa - Year-over-year growth 2022-2027 (%)
- Exhibit 92: Data Table on Middle East and Africa - Year-over-year growth 2022-2027 (%)
- 9.8 US - Market size and forecast 2022-2027
- Exhibit 93: Chart on US - Market size and forecast 2022-2027 ($ million)
- Exhibit 94: Data Table on US - Market size and forecast 2022-2027 ($ million)
- Exhibit 95: Chart on US - Year-over-year growth 2022-2027 (%)
- Exhibit 96: Data Table on US - Year-over-year growth 2022-2027 (%)
- 9.9 China - Market size and forecast 2022-2027
- Exhibit 97: Chart on China - Market size and forecast 2022-2027 ($ million)
- Exhibit 98: Data Table on China - Market size and forecast 2022-2027 ($ million)
- Exhibit 99: Chart on China - Year-over-year growth 2022-2027 (%)
- Exhibit 100: Data Table on China - Year-over-year growth 2022-2027 (%)
- 9.10 Italy - Market size and forecast 2022-2027
- Exhibit 101: Chart on Italy - Market size and forecast 2022-2027 ($ million)
- Exhibit 102: Data Table on Italy - Market size and forecast 2022-2027 ($ million)
- Exhibit 103: Chart on Italy - Year-over-year growth 2022-2027 (%)
- Exhibit 104: Data Table on Italy - Year-over-year growth 2022-2027 (%)
- 9.11 Germany - Market size and forecast 2022-2027
- Exhibit 105: Chart on Germany - Market size and forecast 2022-2027 ($ million)
- Exhibit 106: Data Table on Germany - Market size and forecast 2022-2027 ($ million)
- Exhibit 107: Chart on Germany - Year-over-year growth 2022-2027 (%)
- Exhibit 108: Data Table on Germany - Year-over-year growth 2022-2027 (%)
- 9.12 Japan - Market size and forecast 2022-2027
- Exhibit 109: Chart on Japan - Market size and forecast 2022-2027 ($ million)
- Exhibit 110: Data Table on Japan - Market size and forecast 2022-2027 ($ million)
- Exhibit 111: Chart on Japan - Year-over-year growth 2022-2027 (%)
- Exhibit 112: Data Table on Japan - Year-over-year growth 2022-2027 (%)
- 9.13 Market opportunity by geography
- Exhibit 113: Market opportunity by geography ($ million)
10 Drivers, Challenges, and Trends
- 10.1 Market drivers
- 10.2 Market challenges
- 10.3 Impact of drivers and challenges
- Exhibit 114: Impact of drivers and challenges in 2022 and 2027
- 10.4 Market trends
11 Vendor Landscape
- 11.1 Overview
- 11.2 Vendor landscape
- Exhibit 115: Overview on Criticality of inputs and Factors of differentiation
- 11.3 Landscape disruption
- Exhibit 116: Overview on factors of disruption
- 11.4 Industry risks
- Exhibit 117: Impact of key risks on business
12 Vendor Analysis
- 12.1 Vendors covered
- Exhibit 118: Vendors covered
- 12.2 Market positioning of vendors
- Exhibit 119: Matrix on vendor position and classification
- 12.3 Allied Bakery Equipment and Machine Co. Inc.
- Exhibit 120: Allied Bakery Equipment and Machine Co. Inc. - Overview
- Exhibit 121: Allied Bakery Equipment and Machine Co. Inc. - Product / Service
- Exhibit 122: Allied Bakery Equipment and Machine Co. Inc. - Key offerings
- 12.4 ANKO Food Machine Co. Ltd.
- Exhibit 123: ANKO Food Machine Co. Ltd. - Overview
- Exhibit 124: ANKO Food Machine Co. Ltd. - Product / Service
- Exhibit 125: ANKO Food Machine Co. Ltd. - Key offerings
- 12.5 Buhler AG
- Exhibit 126: Buhler AG - Overview
- Exhibit 127: Buhler AG - Business segments
- Exhibit 128: Buhler AG - Key offerings
- Exhibit 129: Buhler AG - Segment focus
- 12.6 Erika record LLC
- Exhibit 130: Erika record LLC - Overview
- Exhibit 131: Erika record LLC - Product / Service
- Exhibit 132: Erika record LLC - Key offerings
- 12.7 FRITSCH Bakery Technologies GmbH and Co. KG
- Exhibit 133: FRITSCH Bakery Technologies GmbH and Co. KG - Overview
- Exhibit 134: FRITSCH Bakery Technologies GmbH and Co. KG - Product / Service
- Exhibit 135: FRITSCH Bakery Technologies GmbH and Co. KG - Key offerings
- 12.8 GEA Group AG
- Exhibit 136: GEA Group AG - Overview
- Exhibit 137: GEA Group AG - Business segments
- Exhibit 138: GEA Group AG - Key offerings
- Exhibit 139: GEA Group AG - Segment focus
- 12.9 Gemini Bakery Equipment Co.
- Exhibit 140: Gemini Bakery Equipment Co. - Overview
- Exhibit 141: Gemini Bakery Equipment Co. - Product / Service
- Exhibit 142: Gemini Bakery Equipment Co. - Key offerings
- 12.10 Global Bakery Solutions Ltd.
- Exhibit 143: Global Bakery Solutions Ltd. - Overview
- Exhibit 144: Global Bakery Solutions Ltd. - Product / Service
- Exhibit 145: Global Bakery Solutions Ltd. - Key offerings
- 12.11 Heat and Control Inc.
- Exhibit 146: Heat and Control Inc. - Overview
- Exhibit 147: Heat and Control Inc. - Product / Service
- Exhibit 148: Heat and Control Inc. - Key offerings
- 12.12 Industrial Bakery Line Srl
- Exhibit 149: Industrial Bakery Line Srl - Overview
- Exhibit 150: Industrial Bakery Line Srl - Product / Service
- Exhibit 151: Industrial Bakery Line Srl - Key offerings
- 12.13 John Bean Technologies Corp.
- Exhibit 152: John Bean Technologies Corp. - Overview
- Exhibit 153: John Bean Technologies Corp. - Business segments
- Exhibit 154: John Bean Technologies Corp. - Key offerings
- Exhibit 155: John Bean Technologies Corp. - Segment focus
- 12.14 Koenig Maschinen GmbH
- Exhibit 156: Koenig Maschinen GmbH - Overview
- Exhibit 157: Koenig Maschinen GmbH - Product / Service
- Exhibit 158: Koenig Maschinen GmbH - Key offerings
- 12.15 Markel Corp.
- Exhibit 159: Markel Corp. - Overview
- Exhibit 160: Markel Corp. - Product / Service
- Exhibit 161: Markel Corp. - Key offerings
- 12.16 Schenck Process Holding GmbH
- Exhibit 162: Schenck Process Holding GmbH - Overview
- Exhibit 163: Schenck Process Holding GmbH - Product / Service
- Exhibit 164: Schenck Process Holding GmbH - Key offerings
- 12.17 The Middleby Corp.
- Exhibit 165: The Middleby Corp. - Overview
- Exhibit 166: The Middleby Corp. - Business segments
- Exhibit 167: The Middleby Corp. - Key offerings
- Exhibit 168: The Middleby Corp. - Segment focus
13 Appendix
- 13.1 Scope of the report
- 13.2 Inclusions and exclusions checklist
- Exhibit 169: Inclusions checklist
- Exhibit 170: Exclusions checklist
- 13.3 Currency conversion rates for US$
- Exhibit 171: Currency conversion rates for US$
- 13.4 Research methodology
- Exhibit 172: Research methodology
- Exhibit 173: Validation techniques employed for market sizing
- Exhibit 174: Information sources
- 13.5 List of abbreviations
- Exhibit 175: List of abbreviations
About Us
Technavio is a leading global technology research and advisory company. Their research and analysis focuses on emerging market trends and provides actionable insights to help businesses identify market opportunities and develop effective strategies to optimize their market positions. With over 500 specialized analysts, Technavio's report library consists of more than 17,000 reports and counting, covering 800 technologies, spanning across 50 countries. Their client base consists of enterprises of all sizes, including more than 100 Fortune 500 companies. This growing client base relies on Technavio's comprehensive coverage, extensive research, and actionable market insights to identify opportunities in existing and potential markets and assess their competitive positions within changing market scenarios.
Contact
Technavio Research
Jesse Maida
Media & Marketing Executive
US: +1 844 364 1100
UK: +44 203 893 3200
Email: media@technavio.com
Website: www.technavio.com/


SOURCE Technavio
© 2024 Benzinga.com. Benzinga does not provide investment advice. All rights reserved.
Trade confidently with insights and alerts from analyst ratings, free reports and breaking news that affects the stocks you care about.

