


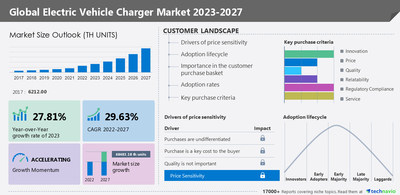
NEW YORK, Dec. 20, 2022 /PRNewswire/ -- Technavio categorizes the global electric vehicle charger market as a part of the global automotive components and accessories market, which covers companies engaged in the production of parts and accessories for automobiles such as passenger cars (PCs), electric vehicles (EVs), commercial vehicles (CVs), heavy-duty vehicles, all-terrain vehicles (ATVs), off-road vehicles, motorcycles, scooters, quad bikes, and three-wheelers. The global electric vehicle charger market size is estimated to increase by 68,483.18 thousand units between 2022 and 2027. The market's growth momentum will progress at a CAGR of 29.63%.

Discover some insights on market size before buying the full report - Request a sample report
Global electric vehicle charger market – Vendor Analysis
Vendor offerings -
- ABB Ltd. - The company offers electric vehicle chargers such as DC fast charging and DC high power and grid chargers.
- Blink Charging Co. - The company offers electric vehicle chargers such as DC fast charging and level-two AC charging stations.
- BorgWarner Inc. - The company offers electric vehicle chargers with a range of DC fast chargers, DC stations, hybrid chargers, high-frequency chargers, and battery recovery and multi-voltage chargers that provide customers with full-function solutions.
- Chargemaster NZ - The company offers electric vehicle chargers such as portable chargemaster chargers.
- For details on vendors and their offerings – Buy the report!
Vendor landscape -
The global electric vehicle charger market is fragmented, with the presence of several global as well as regional vendors. A few prominent vendors that offer electric vehicle chargers in the market are ABB Ltd., Blink Charging Co., BorgWarner Inc., Bosch Automotive Service Solutions Inc, Chargemaster NZ, ChargePoint Inc., ClipperCreek Inc., EV Safe Charge Inc., Evatran Group Inc., EVBox BV, FLO Services USA Inc., GreenPower Motor Co. Inc., Hyundai Motor Co., Leviton Manufacturing Co. Inc., NRG-X Charging Systems (VOLTERIO), SemaConnect Inc., Siemens AG, Tesla Inc., WiTricity Corporation, Zhejiang Benyi Electrical Co., Ltd., and others.
Vendors are trying to manufacture EV chargers that speed up the charging process without hampering the performance of vehicles or reducing the battery life. The integration of vendors with automakers of HEVs and EVs will drive the expansion of the global EV charger market during the forecast period.
Global electric vehicle charger market - Customer landscape
To help companies evaluate and develop growth strategies, the report outlines –
- Key purchase criteria
- Adoption rates
- Adoption lifecycle
- Drivers of price sensitivity
Global electric vehicle charger market - Segmentation assessment
Segment overview
Technavio has segmented the market based on end-user (residential and commercial) and type (slow charger and fast charger).
- The residential segment will contribute significantly to the growth of the global market during the forecast period. This segment includes EV chargers used in homes, multi-dwelling buildings, and workplaces. The electric vehicle charging infrastructure is developing across the world. China dominates this segment, followed by the US and the Netherlands.
Geography overview
Based on geography, the global electric vehicle charger market is segmented into APAC, North America, Europe, South America, and Middle East and Africa. The report provides actionable insights and estimates the contribution of all regions to the growth of the global electric vehicle charger market.
- APAC is estimated to account for 44% of the growth of the global market during the forecast period. China, Japan, and South Korea are expected to dominate the field of electromobility worldwide. The market for EV chargers is growing in China due to the large number of electric vehicles sold in the country. In other countries such as India, public transport is being electrified. Thus, the deployment of electric buses and other EVs for private or public purposes by governments, along with the increasing need to reduce air pollution, is anticipated to drive the demand for EVs in APAC. These factors will, in turn, foster the growth of the EV charger market in the region during the forecast period.
Global electric vehicle charger market – Market dynamics
Leading drivers - Government incentives and subsidies for EV charging infrastructure developments are driving the growth of the market. Incentives for EV chargers and the purchase of EVs are expected to increase installations. This will attract OEMs and private organizations to invest in the development of EV infrastructure. Western European countries such as Belgium, Denmark, and Finland grant tax reductions or exemptions to buyers and owners of EVs. For instance, the city of Helsinki in Finland has invested around USD 5.3 million over the last three years to build public charging stations. Such government incentives are driving the growth of the market.
Key trends - Open and closed platform approaches by EV charger solution providers are key trends in the market. Companies are expected to follow the open and closed platform approaches. For instance, EVgo, a fast charger provider in North America, has developed freedom station plans and chose the open platform approach. Blink network by Car Charging Group is another example of an open network. Such factors will support the growth of the market during the forecast period.
Major challenges - The stringent approvals required for the establishment of charger units will be a significant challenge for the market during the forecast period. Service providers that want to install a charging station must get approval from local governments, plot owners, utility providers, or energy providers. Thus, creating a complete business structure for the establishment of charger stations becomes complicated, as many stages are involved in the value chain. The EV charger market depends mainly on local and state regulations for public and residential chargers. As a result, providers find it difficult to establish charging stations. These factors may restrict the growth of the market during the forecast period.
Drivers, trends, and challenges have an impact on market dynamics, which can impact businesses. Find some insights from a free sample report!
What are the key data covered in this electric vehicle charger market report?
- CAGR of the market during the forecast period
- Detailed information on factors that will drive the growth of the electric vehicle charger market between 2023 and 2027
- Precise estimation of the size of the electric vehicle charger market and its contribution to the parent market
- Accurate predictions about upcoming trends and changes in consumer behavior
- Growth of the electric vehicle charger market across APAC, North America, Europe, South America, and Middle East and Africa
- A thorough analysis of the market's competitive landscape and detailed information about vendors
- Comprehensive analysis of factors that will challenge the growth of electric vehicle charger market vendors
Gain instant access to 17,000+ market research reports.
Technavio's SUBSCRIPTION platform
Related Reports:
- The electric vehicle test equipment market is estimated to grow at a CAGR of 23.11% between 2022 and 2027. The size of the market is forecast to increase by USD 117.98 million. This report extensively covers market segmentation by vehicle type (hybrid electric vehicles, battery electric vehicles, and plug-in hybrid electric vehicles), application (EV component, EV charging, and powertrain), and geography (APAC, Europe, North America, South America, and Middle East and Africa).
- The electric vehicle (EV) charging station market size is expected to increase by USD 15.81 billion from 2021 to 2026, and the market's growth momentum will accelerate at a CAGR of 20.65%. This report extensively covers the market segmentation by type (AC and DC) and geography (APAC, Europe, North America, MEA, and South America).
Electric Vehicle Charger Market Scope | |
Report Coverage | Details |
Page number | 165 |
Base year | 2022 |
Historic period | 2017-2021 |
Forecast period | 2023-2027 |
Growth momentum & CAGR | Accelerate at a CAGR of 29.63% |
Market growth 2023-2027 | 68483.18 thousand units |
Market structure | Fragmented |
YoY growth 2022-2023 (%) | 27.81 |
Regional analysis | APAC, North America, Europe, South America, and Middle East and Africa |
Performing market contribution | APAC at 44% |
Key countries | US, China, Germany, France, and The Netherlands |
Competitive landscape | Leading Vendors, Market Positioning of Vendors, Competitive Strategies, and Industry Risks |
Key companies profiled | ABB Ltd., Blink Charging Co., BorgWarner Inc., Bosch Automotive Service Solutions Inc, Chargemaster NZ, ChargePoint Inc., ClipperCreek Inc., EV Safe Charge Inc., Evatran Group Inc., EVBox BV, FLO Services USA Inc., GreenPower Motor Co. Inc., Hyundai Motor Co., Leviton Manufacturing Co. Inc., NRG-X Charging Systems (VOLTERIO), SemaConnect Inc., Siemens AG, Tesla Inc., WiTricity Corporation, and Zhejiang Benyi Electrical Co., Ltd. |
Market dynamics | Parent market analysis, Market growth inducers and obstacles, Fast-growing and slow-growing segment analysis, COVID-19 impact and recovery analysis and future consumer dynamics, and Market condition analysis for the forecast period. |
Customization purview | If our report has not included the data that you are looking for, you can reach out to our analysts and get segments customized. |
Customization purview | If our report has not included the data that you are looking for, you can reach out to our analysts and get segments customized. |
Browse for Technavio's consumer discretionary market reports
Table of contents
1 Executive Summary
- 1.1 Market overview
- Exhibit 01: Executive Summary – Chart on Market Overview
- Exhibit 02: Executive Summary – Data Table on Market Overview
- Exhibit 03: Executive Summary – Chart on Global Market Characteristics
- Exhibit 04: Executive Summary – Chart on Market by Geography
- Exhibit 05: Executive Summary – Chart on Market Segmentation by End-user
- Exhibit 06: Executive Summary – Chart on Market Segmentation by Type
- Exhibit 07: Executive Summary – Chart on Incremental Growth
- Exhibit 08: Executive Summary – Data Table on Incremental Growth
- Exhibit 09: Executive Summary – Chart on Vendor Market Positioning
2 Market Landscape
- 2.1 Market ecosystem
- Exhibit 10: Parent market
- Exhibit 11: Market Characteristics
3 Market Sizing
- 3.1 Market definition
- Exhibit 12: Offerings of vendors included in the market definition
- 3.2 Market segment analysis
- Exhibit 13: Market segments
- 3.3 Market size 2022
- 3.4 Market outlook: Forecast for 2022-2027
- Exhibit 14: Chart on Global - Market size and forecast 2022-2027 (thousand units)
- Exhibit 15: Data Table on Global - Market size and forecast 2022-2027 (thousand units)
- Exhibit 16: Chart on Global Market- Year-over-year growth 2022-2027 (%)
- Exhibit 17: Data Table on Global Market- Year-over-year growth 2022-2027 (%)
4 Historic Market Size
- 4.1 Global electric vehicle charger market 2017 - 2021
- Exhibit 18: Historic Market Size – Data Table on Global electric vehicle charger market 2017 - 2021 (thousand units)
- 4.2 End-user Segment Analysis 2017 - 2021
- Exhibit 19: Historic Market Size – End-user Segment 2017 - 2021 (thousand units)
- 4.3 Type Segment Analysis 2017 - 2021
- Exhibit 20: Historic Market Size – Type Segment 2017 - 2021 (thousand units)
- 4.4 Geography Segment Analysis 2017 - 2021
- Exhibit 21: Historic Market Size – Geography Segment 2017 - 2021 (thousand units)
- 4.5 Country Segment Analysis 2017 - 2021
- Exhibit 22: Historic Market Size – Country Segment 2017 - 2021 (thousand units)
5 Five Forces Analysis
- 5.1 Five forces summary
- Exhibit 23: Five forces analysis - Comparison between 2022 and 2027
- 5.2 Bargaining power of buyers
- Exhibit 24: Chart on Bargaining power of buyers – Impact of key factors 2022 and 2027
- 5.3 Bargaining power of suppliers
- Exhibit 25: Bargaining power of suppliers – Impact of key factors in 2022 and 2027
- 5.4 Threat of new entrants
- Exhibit 26: Threat of new entrants – Impact of key factors in 2022 and 2027
- 5.5 Threat of substitutes
- Exhibit 27: Threat of substitutes – Impact of key factors in 2022 and 2027
- 5.6 Threat of rivalry
- Exhibit 28: Threat of rivalry – Impact of key factors in 2022 and 2027
- 5.7 Market condition
- Exhibit 29: Chart on Market condition - Five forces 2022 and 2027
6 Market Segmentation by End-user
- 6.1 Market segments
- Exhibit 30: Chart on End-user - Market share 2022-2027 (%)
- Exhibit 31: Data Table on End-user - Market share 2022-2027 (%)
- 6.2 Comparison by End-user
- Exhibit 32: Chart on Comparison by End-user
- Exhibit 33: Data Table on Comparison by End-user
- 6.3 Residential - Market size and forecast 2022-2027
- Exhibit 34: Chart on Residential - Market size and forecast 2022-2027 (thousand units)
- Exhibit 35: Data Table on Residential - Market size and forecast 2022-2027 (thousand units)
- Exhibit 36: Chart on Residential - Year-over-year growth 2022-2027 (%)
- Exhibit 37: Data Table on Residential - Year-over-year growth 2022-2027 (%)
- 6.4 Commercial - Market size and forecast 2022-2027
- Exhibit 38: Chart on Commercial - Market size and forecast 2022-2027 (thousand units)
- Exhibit 39: Data Table on Commercial - Market size and forecast 2022-2027 (thousand units)
- Exhibit 40: Chart on Commercial - Year-over-year growth 2022-2027 (%)
- Exhibit 41: Data Table on Commercial - Year-over-year growth 2022-2027 (%)
- 6.5 Market opportunity by End-user
- Exhibit 42: Market opportunity by End-user (thousand units)
7 Market Segmentation by Type
- 7.1 Market segments
- Exhibit 43: Chart on Type - Market share 2022-2027 (%)
- Exhibit 44: Data Table on Type - Market share 2022-2027 (%)
- 7.2 Comparison by Type
- Exhibit 45: Chart on Comparison by Type
- Exhibit 46: Data Table on Comparison by Type
- 7.3 Slow charger - Market size and forecast 2022-2027
- Exhibit 47: Chart on Slow charger - Market size and forecast 2022-2027 (thousand units)
- Exhibit 48: Data Table on Slow charger - Market size and forecast 2022-2027 (thousand units)
- Exhibit 49: Chart on Slow charger - Year-over-year growth 2022-2027 (%)
- Exhibit 50: Data Table on Slow charger - Year-over-year growth 2022-2027 (%)
- 7.4 Fast charger - Market size and forecast 2022-2027
- Exhibit 51: Chart on Fast charger - Market size and forecast 2022-2027 (thousand units)
- Exhibit 52: Data Table on Fast charger - Market size and forecast 2022-2027 (thousand units)
- Exhibit 53: Chart on Fast charger - Year-over-year growth 2022-2027 (%)
- Exhibit 54: Data Table on Fast charger - Year-over-year growth 2022-2027 (%)
- 7.5 Market opportunity by Type
- Exhibit 55: Market opportunity by Type (thousand units)
8 Customer Landscape
- 8.1 Customer landscape overview
- Exhibit 56: Analysis of price sensitivity, lifecycle, customer purchase basket, adoption rates, and purchase criteria
9 Geographic Landscape
- 9.1 Geographic segmentation
- Exhibit 57: Chart on Market share by geography 2022-2027 (%)
- Exhibit 58: Data Table on Market share by geography 2022-2027 (%)
- 9.2 Geographic comparison
- Exhibit 59: Chart on Geographic comparison
- Exhibit 60: Data Table on Geographic comparison
- 9.3 APAC - Market size and forecast 2022-2027
- Exhibit 61: Chart on APAC - Market size and forecast 2022-2027 (thousand units)
- Exhibit 62: Data Table on APAC - Market size and forecast 2022-2027 (thousand units)
- Exhibit 63: Chart on APAC - Year-over-year growth 2022-2027 (%)
- Exhibit 64: Data Table on APAC - Year-over-year growth 2022-2027 (%)
- 9.4 North America - Market size and forecast 2022-2027
- Exhibit 65: Chart on North America - Market size and forecast 2022-2027 (thousand units)
- Exhibit 66: Data Table on North America - Market size and forecast 2022-2027 (thousand units)
- Exhibit 67: Chart on North America - Year-over-year growth 2022-2027 (%)
- Exhibit 68: Data Table on North America - Year-over-year growth 2022-2027 (%)
- 9.5 Europe - Market size and forecast 2022-2027
- Exhibit 69: Chart on Europe - Market size and forecast 2022-2027 (thousand units)
- Exhibit 70: Data Table on Europe - Market size and forecast 2022-2027 (thousand units)
- Exhibit 71: Chart on Europe - Year-over-year growth 2022-2027 (%)
- Exhibit 72: Data Table on Europe - Year-over-year growth 2022-2027 (%)
- 9.6 South America - Market size and forecast 2022-2027
- Exhibit 73: Chart on South America - Market size and forecast 2022-2027 (thousand units)
- Exhibit 74: Data Table on South America - Market size and forecast 2022-2027 (thousand units)
- Exhibit 75: Chart on South America - Year-over-year growth 2022-2027 (%)
- Exhibit 76: Data Table on South America - Year-over-year growth 2022-2027 (%)
- 9.7 Middle East and Africa - Market size and forecast 2022-2027
- Exhibit 77: Chart on Middle East and Africa - Market size and forecast 2022-2027 (thousand units)
- Exhibit 78: Data Table on Middle East and Africa - Market size and forecast 2022-2027 (thousand units)
- Exhibit 79: Chart on Middle East and Africa - Year-over-year growth 2022-2027 (%)
- Exhibit 80: Data Table on Middle East and Africa - Year-over-year growth 2022-2027 (%)
- 9.8 US - Market size and forecast 2022-2027
- Exhibit 81: Chart on US - Market size and forecast 2022-2027 (thousand units)
- Exhibit 82: Data Table on US - Market size and forecast 2022-2027 (thousand units)
- Exhibit 83: Chart on US - Year-over-year growth 2022-2027 (%)
- Exhibit 84: Data Table on US - Year-over-year growth 2022-2027 (%)
- 9.9 China - Market size and forecast 2022-2027
- Exhibit 85: Chart on China - Market size and forecast 2022-2027 (thousand units)
- Exhibit 86: Data Table on China - Market size and forecast 2022-2027 (thousand units)
- Exhibit 87: Chart on China - Year-over-year growth 2022-2027 (%)
- Exhibit 88: Data Table on China - Year-over-year growth 2022-2027 (%)
- 9.10 Germany - Market size and forecast 2022-2027
- Exhibit 89: Chart on Germany - Market size and forecast 2022-2027 (thousand units)
- Exhibit 90: Data Table on Germany - Market size and forecast 2022-2027 (thousand units)
- Exhibit 91: Chart on Germany - Year-over-year growth 2022-2027 (%)
- Exhibit 92: Data Table on Germany - Year-over-year growth 2022-2027 (%)
- 9.11 France - Market size and forecast 2022-2027
- Exhibit 93: Chart on France - Market size and forecast 2022-2027 (thousand units)
- Exhibit 94: Data Table on France - Market size and forecast 2022-2027 (thousand units)
- Exhibit 95: Chart on France - Year-over-year growth 2022-2027 (%)
- Exhibit 96: Data Table on France - Year-over-year growth 2022-2027 (%)
- 9.12 The Netherlands - Market size and forecast 2022-2027
- Exhibit 97: Chart on The Netherlands - Market size and forecast 2022-2027 (thousand units)
- Exhibit 98: Data Table on The Netherlands - Market size and forecast 2022-2027 (thousand units)
- Exhibit 99: Chart on The Netherlands - Year-over-year growth 2022-2027 (%)
- Exhibit 100: Data Table on The Netherlands - Year-over-year growth 2022-2027 (%)
- 9.13 Market opportunity by geography
- Exhibit 101: Market opportunity by geography (thousand units)
10 Drivers, Challenges, and Trends
- 10.1 Market drivers
- 10.2 Market challenges
- 10.3 Impact of drivers and challenges
- Exhibit 102: Impact of drivers and challenges in 2022 and 2027
- 10.4 Market trends
11 Vendor Landscape
- 11.1 Overview
- 11.2 Vendor landscape
- Exhibit 103: Overview on Criticality of inputs and Factors of differentiation
- 11.3 Landscape disruption
- Exhibit 104: Overview on factors of disruption
- 11.4 Industry risks
- Exhibit 105: Impact of key risks on business
12 Vendor Analysis
- 12.1 Vendors covered
- Exhibit 106: Vendors covered
- 12.2 Market positioning of vendors
- Exhibit 107: Matrix on vendor position and classification
- 12.3 ABB Ltd.
- Exhibit 108: ABB Ltd. - Overview
- Exhibit 109: ABB Ltd. - Business segments
- Exhibit 110: ABB Ltd. - Key news
- Exhibit 111: ABB Ltd. - Key offerings
- Exhibit 112: ABB Ltd. - Segment focus
- 12.4 Blink Charging Co.
- Exhibit 113: Blink Charging Co. - Overview
- Exhibit 114: Blink Charging Co. - Product / Service
- Exhibit 115: Blink Charging Co. - Key news
- Exhibit 116: Blink Charging Co. - Key offerings
- 12.5 BorgWarner Inc.
- Exhibit 117: BorgWarner Inc. - Overview
- Exhibit 118: BorgWarner Inc. - Business segments
- Exhibit 119: BorgWarner Inc. - Key news
- Exhibit 120: BorgWarner Inc. - Key offerings
- Exhibit 121: BorgWarner Inc. - Segment focus
- 12.6 Chargemaster NZ
- Exhibit 122: Chargemaster NZ - Overview
- Exhibit 123: Chargemaster NZ - Product / Service
- Exhibit 124: Chargemaster NZ - Key offerings
- 12.7 ChargePoint Inc.
- Exhibit 125: ChargePoint Inc. - Overview
- Exhibit 126: ChargePoint Inc. - Product / Service
- Exhibit 127: ChargePoint Inc. - Key news
- Exhibit 128: ChargePoint Inc. - Key offerings
- 12.8 ClipperCreek Inc.
- Exhibit 129: ClipperCreek Inc. - Overview
- Exhibit 130: ClipperCreek Inc. - Product / Service
- Exhibit 131: ClipperCreek Inc. - Key offerings
- 12.9 EV Safe Charge Inc.
- Exhibit 132: EV Safe Charge Inc. - Overview
- Exhibit 133: EV Safe Charge Inc. - Product / Service
- Exhibit 134: EV Safe Charge Inc. - Key offerings
- 12.10 Evatran Group Inc.
- Exhibit 135: Evatran Group Inc. - Overview
- Exhibit 136: Evatran Group Inc. - Product / Service
- Exhibit 137: Evatran Group Inc. - Key offerings
- 12.11 EVBox BV
- Exhibit 138: EVBox BV - Overview
- Exhibit 139: EVBox BV - Product / Service
- Exhibit 140: EVBox BV - Key offerings
- 12.12 FLO Services USA Inc.
- Exhibit 141: FLO Services USA Inc. - Overview
- Exhibit 142: FLO Services USA Inc. - Product / Service
- Exhibit 143: FLO Services USA Inc. - Key offerings
- 12.13 GreenPower Motor Co. Inc.
- Exhibit 144: GreenPower Motor Co. Inc. - Overview
- Exhibit 145: GreenPower Motor Co. Inc. - Product / Service
- Exhibit 146: GreenPower Motor Co. Inc. - Key news
- Exhibit 147: GreenPower Motor Co. Inc. - Key offerings
- 12.14 Hyundai Motor Co.
- Exhibit 148: Hyundai Motor Co. - Overview
- Exhibit 149: Hyundai Motor Co. - Product / Service
- Exhibit 150: Hyundai Motor Co. - Key offerings
- 12.15 Leviton Manufacturing Co. Inc.
- Exhibit 151: Leviton Manufacturing Co. Inc. - Overview
- Exhibit 152: Leviton Manufacturing Co. Inc. - Product / Service
- Exhibit 153: Leviton Manufacturing Co. Inc. - Key offerings
- 12.16 NRG-X Charging Systems (VOLTERIO)
- Exhibit 154: NRG-X Charging Systems (VOLTERIO) - Overview
- Exhibit 155: NRG-X Charging Systems (VOLTERIO) - Product / Service
- Exhibit 156: NRG-X Charging Systems (VOLTERIO) - Key offerings
- 12.17 SemaConnect Inc.
- Exhibit 157: SemaConnect Inc. - Overview
- Exhibit 158: SemaConnect Inc. - Product / Service
- Exhibit 159: SemaConnect Inc. - Key offerings
13 Appendix
- 13.1 Scope of the report
- 13.2 Inclusions and exclusions checklist
- Exhibit 160: Inclusions checklist
- Exhibit 161: Exclusions checklist
- 13.3 Currency conversion rates for US$
- Exhibit 162: Currency conversion rates for US$
- 13.4 Research methodology
- Exhibit 163: Research methodology
- Exhibit 164: Validation techniques employed for market sizing
- Exhibit 165: Information sources
- 13.5 List of abbreviations
- Exhibit 166: List of abbreviations
Technavio is a leading global technology research and advisory company. Their research and analysis focus on emerging market trends and provide actionable insights to help businesses identify market opportunities and develop effective strategies to optimize their market positions. With over 500 specialized analysts, Technavio's report library consists of more than 17,000 reports and counting, covering 800 technologies, spanning across 50 countries. Their client base consists of enterprises of all sizes, including more than 100 Fortune 500 companies. This growing client base relies on Technavio's comprehensive coverage, extensive research, and actionable market insights to identify opportunities in existing and potential markets and assess their competitive positions within changing market scenarios.
Contact
Technavio Research
Jesse Maida
Media & Marketing Executive
US: +1 844 364 1100
UK: +44 203 893 3200
Email: media@technavio.com
Website: www.technavio.com/


SOURCE Technavio
© 2024 Benzinga.com. Benzinga does not provide investment advice. All rights reserved.
Trade confidently with insights and alerts from analyst ratings, free reports and breaking news that affects the stocks you care about.

