


NEW YORK, Dec. 6, 2022 /PRNewswire/ -- The HVAC market is fragmented due to the presence of international and regional vendors. Regional vendors are providing customized HVAC systems at lower prices than international vendors to increase their market presence. Although several new vendors are foraying into the market, they find it difficult to compete with international vendors in terms of quality, features, functionalities, and services. During the forecast period, the competitive environment in the market is likely to intensify with increasing product launches, technological innovations, and strategic mergers and acquisitions.

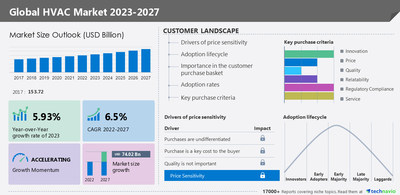
The HVAC market size is forecast to grow by USD 74.02 billion and grow at a CAGR of 6.5% from 2022 to 2027, according to Technavio.
Request Latest PDF Sample Report
HVAC Market 2022-2026: Scope
The HVAC market report covers the following areas:
HVAC Market 2022-2026: Segmentation
- Type
- HVAC equipment: The HVAC equipment segment will be the largest contributor to market growth during the forecast period. Factors such as increase in the demand for energy-saving ACs, rise in disposable income, and boom in residential construction are driving the growth of the segment. Also, new trends, such as the rise in the use of energy recovery ventilation (ERV) units, will significantly contribute to the growth of the segment.
- HVAC services
- Geography
- APAC: APAC will account for 53% of the market's growth during the forecast period. The expanding commercial construction sector is one of the key factors driving the growth of the regional market. In addition, factors such as growing population, climatic conditions, increasing urbanization, and demographic changes are supporting the growth of the HVAC market in APAC.
- Europe
- North America
- South America
- Middle East And Africa
HVAC Market 2022-2026: Vendor Analysis
Arkema Group, Carrier Global Corp., Daikin Industries Ltd., Danfoss AS, Emerson Electric Co., Fujitsu General Ltd., Gree Electric, Haier Smart Home Co. Ltd., Honeywell International Inc., Johnson Controls International Plc, Lennox International Inc., LG Electronics Inc., Melrose Industries Plc, MIDEA Group Co. Ltd., and Mitsubishi Electric Corp. are among some of the major market participants.
What are the Key Data Covered in this HVAC Market Report?
- CAGR of the market during the forecast period.
- Detailed information on factors that will drive the growth of the HVAC market between 2023 and 2027
- Precise estimation of the HVAC market size and its contribution to the parent market.
- Accurate predictions about upcoming trends and changes in consumer behavior.
- Growth of the industry across APAC, Europe, North America, Middle East and Africa, and South America.
- Thorough analysis of the market's competitive landscape and detailed information about vendors.
- Comprehensive analysis of factors that will challenge the growth of HVAC market vendors.
Subscribe to our "Basic Plan" billed annually at USD 5000 that enables you to download 5 reports and view 100 reports every month
Related Reports
- The energy-efficient HVAC systems market size is expected to increase by USD 24.37 billion from 2021 to 2026, and the market's growth momentum will accelerate at a CAGR of 11.02%. The demand for reducing energy consumption and operating costs is notably driving the energy-efficient HVAC systems market growth, although factors such as the higher initial cost of energy-efficient HVAC systems may impede the market growth.
- The HVAC terminal units market size is expected to be valued at USD 1.41 billion by 2026 with a progressing CAGR of 5.05%. The increase in construction activities is notably driving the HVAC terminal units market growth, although factors such as fluctuations in raw material prices may impede the market growth.
HVAC Market Scope | |
Report Coverage | Details |
Page number | 176 |
Base year | 2022 |
Historic period | 2017-2021 |
Forecast period | 2023-2027 |
Growth momentum & CAGR | Accelerate at a CAGR of 6.5% |
Market growth 2023-2027 | USD 74.02 billion |
Market structure | Fragmented |
YoY growth 2022-2023(%) | 5.93 |
Regional analysis | APAC, Europe, North America, Middle East and Africa, and South America |
Performing market contribution | APAC at 53% |
Key countries | US, China, Japan, Germany, and UK |
Competitive landscape | Leading Vendors, Market Positioning of Vendors, Competitive Strategies, and Industry Risks |
Key companies profiled | Arkema Group, Carrier Global Corp., Daikin Industries Ltd., Danfoss AS, Emerson Electric Co., Fujitsu General Ltd., Gree Electric, Haier Smart Home Co. Ltd., Honeywell International Inc., Johnson Controls International Plc, Lennox International Inc., LG Electronics Inc., Melrose Industries Plc, MIDEA Group Co. Ltd., Mitsubishi Electric Corp., Paloma Co. Ltd., Panasonic Holdings Corp., Robert Bosch GmbH, Samsung Electronics Co. Ltd., and Trane Technologies plc |
Market dynamics | Parent market analysis, market growth inducers and obstacles, fast-growing and slow-growing segment analysis, COVID-19 impact and recovery analysis and future consumer dynamics, and market condition analysis for the forecast period. |
Customization purview | If our report has not included the data that you are looking for, you can reach out to our analysts and get segments customized. |
Customization purview | If our report has not included the data that you are looking for, you can reach out to our analysts and get segments customized. |
Table of Contents:
1 Executive Summary
- 1.1 Market overview
- Exhibit 01: Executive Summary – Chart on Market Overview
- Exhibit 02: Executive Summary – Data Table on Market Overview
- Exhibit 03: Executive Summary – Chart on Global Market Characteristics
- Exhibit 04: Executive Summary – Chart on Market by Geography
- Exhibit 05: Executive Summary – Chart on Market Segmentation by Type
- Exhibit 06: Executive Summary – Chart on Market Segmentation by End-user
- Exhibit 07: Executive Summary – Chart on Incremental Growth
- Exhibit 08: Executive Summary – Data Table on Incremental Growth
- Exhibit 09: Executive Summary – Chart on Vendor Market Positioning
2 Market Landscape
- 2.1 Market ecosystem
- Exhibit 10: Parent market
- Exhibit 11: Market Characteristics
3 Market Sizing
- 3.1 Market definition
- Exhibit 12: Offerings of vendors included in the market definition
- 3.2 Market segment analysis
- Exhibit 13: Market segments
- 3.3 Market size 2022
- 3.4 Market outlook: Forecast for 2022-2027
- Exhibit 14: Chart on Global - Market size and forecast 2022-2027 ($ billion)
- Exhibit 15: Data Table on Global - Market size and forecast 2022-2027 ($ billion)
- Exhibit 16: Chart on Global Market: Year-over-year growth 2022-2027 (%)
- Exhibit 17: Data Table on Global Market: Year-over-year growth 2022-2027 (%)
4 Historic Market Size
- 4.1 Global HVAC market 2017 - 2021
- Exhibit 18: Historic Market Size – Data Table on Global HVAC market 2017 - 2021 ($ billion)
- 4.2 Geography Segment Analysis 2017 - 2021
- Exhibit 19: Historic Market Size – Geography Segment 2017 - 2021 ($ billion)
- 4.3 Type Segment Analysis 2017 - 2021
- Exhibit 20: Historic Market Size – Type Segment 2017 - 2021 ($ billion)
- 4.4 End-user Segment Analysis 2017 - 2021
- Exhibit 21: Historic Market Size – End-user Segment 2017 - 2021 ($ billion)
- 4.5 Country Segment Analysis 2017 - 2021
- Exhibit 22: Historic Market Size – Country Segment 2017 - 2021 ($ billion)
5 Five Forces Analysis
- 5.1 Five forces summary
- Exhibit 23: Five forces analysis - Comparison between 2022 and 2027
- 5.2 Bargaining power of buyers
- Exhibit 24: Chart on Bargaining power of buyers – Impact of key factors 2022 and 2027
- 5.3 Bargaining power of suppliers
- Exhibit 25: Bargaining power of suppliers – Impact of key factors in 2022 and 2027
- 5.4 Threat of new entrants
- Exhibit 26: Threat of new entrants – Impact of key factors in 2022 and 2027
- 5.5 Threat of substitutes
- Exhibit 27: Threat of substitutes – Impact of key factors in 2022 and 2027
- 5.6 Threat of rivalry
- Exhibit 28: Threat of rivalry – Impact of key factors in 2022 and 2027
- 5.7 Market condition
- Exhibit 29: Chart on Market condition - Five forces 2022 and 2027
6 Market Segmentation by Type
- 6.1 Market segments
- Exhibit 30: Chart on Type - Market share 2022-2027 (%)
- Exhibit 31: Data Table on Type - Market share 2022-2027 (%)
- 6.2 Comparison by Type
- Exhibit 32: Chart on Comparison by Type
- Exhibit 33: Data Table on Comparison by Type
- 6.3 HVAC equipment - Market size and forecast 2022-2027
- Exhibit 34: Chart on HVAC equipment - Market size and forecast 2022-2027 ($ billion)
- Exhibit 35: Data Table on HVAC equipment - Market size and forecast 2022-2027 ($ billion)
- Exhibit 36: Chart on HVAC equipment - Year-over-year growth 2022-2027 (%)
- Exhibit 37: Data Table on HVAC equipment - Year-over-year growth 2022-2027 (%)
- 6.4 HVAC services - Market size and forecast 2022-2027
- Exhibit 38: Chart on HVAC services - Market size and forecast 2022-2027 ($ billion)
- Exhibit 39: Data Table on HVAC services - Market size and forecast 2022-2027 ($ billion)
- Exhibit 40: Chart on HVAC services - Year-over-year growth 2022-2027 (%)
- Exhibit 41: Data Table on HVAC services - Year-over-year growth 2022-2027 (%)
- 6.5 Market opportunity by Type
- Exhibit 42: Market opportunity by Type ($ billion)
7 Market Segmentation by End-user
- 7.1 Market segments
- Exhibit 43: Chart on End-user - Market share 2022-2027 (%)
- Exhibit 44: Data Table on End-user - Market share 2022-2027 (%)
- 7.2 Comparison by End-user
- Exhibit 45: Chart on Comparison by End-user
- Exhibit 46: Data Table on Comparison by End-user
- 7.3 Non-residential - Market size and forecast 2022-2027
- Exhibit 47: Chart on Non-residential - Market size and forecast 2022-2027 ($ billion)
- Exhibit 48: Data Table on Non-residential - Market size and forecast 2022-2027 ($ billion)
- Exhibit 49: Chart on Non-residential - Year-over-year growth 2022-2027 (%)
- Exhibit 50: Data Table on Non-residential - Year-over-year growth 2022-2027 (%)
- 7.4 Residential - Market size and forecast 2022-2027
- Exhibit 51: Chart on Residential - Market size and forecast 2022-2027 ($ billion)
- Exhibit 52: Data Table on Residential - Market size and forecast 2022-2027 ($ billion)
- Exhibit 53: Chart on Residential - Year-over-year growth 2022-2027 (%)
- Exhibit 54: Data Table on Residential - Year-over-year growth 2022-2027 (%)
- 7.5 Market opportunity by End-user
- Exhibit 55: Market opportunity by End-user ($ billion)
8 Customer Landscape
- 8.1 Customer landscape overview
- Exhibit 56: Analysis of price sensitivity, lifecycle, customer purchase basket, adoption rates, and purchase criteria
9 Geographic Landscape
- 9.1 Geographic segmentation
- Exhibit 57: Chart on Market share by geography 2022-2027 (%)
- Exhibit 58: Data Table on Market share by geography 2022-2027 (%)
- 9.2 Geographic comparison
- Exhibit 59: Chart on Geographic comparison
- Exhibit 60: Data Table on Geographic comparison
- 9.3 APAC - Market size and forecast 2022-2027
- Exhibit 61: Chart on APAC - Market size and forecast 2022-2027 ($ billion)
- Exhibit 62: Data Table on APAC - Market size and forecast 2022-2027 ($ billion)
- Exhibit 63: Chart on APAC - Year-over-year growth 2022-2027 (%)
- Exhibit 64: Data Table on APAC - Year-over-year growth 2022-2027 (%)
- 9.4 Europe - Market size and forecast 2022-2027
- Exhibit 65: Chart on Europe - Market size and forecast 2022-2027 ($ billion)
- Exhibit 66: Data Table on Europe - Market size and forecast 2022-2027 ($ billion)
- Exhibit 67: Chart on Europe - Year-over-year growth 2022-2027 (%)
- Exhibit 68: Data Table on Europe - Year-over-year growth 2022-2027 (%)
- 9.5 North America - Market size and forecast 2022-2027
- Exhibit 69: Chart on North America - Market size and forecast 2022-2027 ($ billion)
- Exhibit 70: Data Table on North America - Market size and forecast 2022-2027 ($ billion)
- Exhibit 71: Chart on North America - Year-over-year growth 2022-2027 (%)
- Exhibit 72: Data Table on North America - Year-over-year growth 2022-2027 (%)
- 9.6 Middle East and Africa - Market size and forecast 2022-2027
- Exhibit 73: Chart on Middle East and Africa - Market size and forecast 2022-2027 ($ billion)
- Exhibit 74: Data Table on Middle East and Africa - Market size and forecast 2022-2027 ($ billion)
- Exhibit 75: Chart on Middle East and Africa - Year-over-year growth 2022-2027 (%)
- Exhibit 76: Data Table on Middle East and Africa - Year-over-year growth 2022-2027 (%)
- 9.7 South America - Market size and forecast 2022-2027
- Exhibit 77: Chart on South America - Market size and forecast 2022-2027 ($ billion)
- Exhibit 78: Data Table on South America - Market size and forecast 2022-2027 ($ billion)
- Exhibit 79: Chart on South America - Year-over-year growth 2022-2027 (%)
- Exhibit 80: Data Table on South America - Year-over-year growth 2022-2027 (%)
- 9.8 China - Market size and forecast 2022-2027
- Exhibit 81: Chart on China - Market size and forecast 2022-2027 ($ billion)
- Exhibit 82: Data Table on China - Market size and forecast 2022-2027 ($ billion)
- Exhibit 83: Chart on China - Year-over-year growth 2022-2027 (%)
- Exhibit 84: Data Table on China - Year-over-year growth 2022-2027 (%)
- 9.9 US - Market size and forecast 2022-2027
- Exhibit 85: Chart on US - Market size and forecast 2022-2027 ($ billion)
- Exhibit 86: Data Table on US - Market size and forecast 2022-2027 ($ billion)
- Exhibit 87: Chart on US - Year-over-year growth 2022-2027 (%)
- Exhibit 88: Data Table on US - Year-over-year growth 2022-2027 (%)
- 9.10 Japan - Market size and forecast 2022-2027
- Exhibit 89: Chart on Japan - Market size and forecast 2022-2027 ($ billion)
- Exhibit 90: Data Table on Japan - Market size and forecast 2022-2027 ($ billion)
- Exhibit 91: Chart on Japan - Year-over-year growth 2022-2027 (%)
- Exhibit 92: Data Table on Japan - Year-over-year growth 2022-2027 (%)
- 9.11 Germany - Market size and forecast 2022-2027
- Exhibit 93: Chart on Germany - Market size and forecast 2022-2027 ($ billion)
- Exhibit 94: Data Table on Germany - Market size and forecast 2022-2027 ($ billion)
- Exhibit 95: Chart on Germany - Year-over-year growth 2022-2027 (%)
- Exhibit 96: Data Table on Germany - Year-over-year growth 2022-2027 (%)
- 9.12 UK - Market size and forecast 2022-2027
- Exhibit 97: Chart on UK - Market size and forecast 2022-2027 ($ billion)
- Exhibit 98: Data Table on UK - Market size and forecast 2022-2027 ($ billion)
- Exhibit 99: Chart on UK - Year-over-year growth 2022-2027 (%)
- Exhibit 100: Data Table on UK - Year-over-year growth 2022-2027 (%)
- 9.13 Market opportunity by geography
- Exhibit 101: Market opportunity by geography ($ billion)
10 Drivers, Challenges, and Trends
- 10.1 Market drivers
- 10.2 Market challenges
- 10.3 Impact of drivers and challenges
- Exhibit 102: Impact of drivers and challenges in 2022 and 2027
- 10.4 Market trends
11 Vendor Landscape
- 11.1 Overview
- 11.2 Vendor landscape
- Exhibit 103: Overview on Criticality of inputs and Factors of differentiation
- 11.3 Landscape disruption
- Exhibit 104: Overview on factors of disruption
- 11.4 Industry risks
- Exhibit 105: Impact of key risks on business
12 Vendor Analysis
- 12.1 Vendors covered
- Exhibit 106: Vendors covered
- 12.2 Market positioning of vendors
- Exhibit 107: Matrix on vendor position and classification
- 12.3 Arkema Group
- Exhibit 108: Arkema Group - Overview
- Exhibit 109: Arkema Group - Business segments
- Exhibit 110: Arkema Group - Key news
- Exhibit 111: Arkema Group - Key offerings
- Exhibit 112: Arkema Group - Segment focus
- 12.4 Carrier Global Corp.
- Exhibit 113: Carrier Global Corp. - Overview
- Exhibit 114: Carrier Global Corp. - Business segments
- Exhibit 115: Carrier Global Corp. - Key news
- Exhibit 116: Carrier Global Corp. - Key offerings
- Exhibit 117: Carrier Global Corp. - Segment focus
- 12.5 Daikin Industries Ltd.
- Exhibit 118: Daikin Industries Ltd. - Overview
- Exhibit 119: Daikin Industries Ltd. - Business segments
- Exhibit 120: Daikin Industries Ltd. - Key news
- Exhibit 121: Daikin Industries Ltd. - Key offerings
- Exhibit 122: Daikin Industries Ltd. - Segment focus
- 12.6 Danfoss AS
- Exhibit 123: Danfoss AS - Overview
- Exhibit 124: Danfoss AS - Business segments
- Exhibit 125: Danfoss AS - Key news
- Exhibit 126: Danfoss AS - Key offerings
- Exhibit 127: Danfoss AS - Segment focus
- 12.7 Emerson Electric Co.
- Exhibit 128: Emerson Electric Co. - Overview
- Exhibit 129: Emerson Electric Co. - Business segments
- Exhibit 130: Emerson Electric Co. - Key offerings
- Exhibit 131: Emerson Electric Co. - Segment focus
- 12.8 Fujitsu General Ltd.
- Exhibit 132: Fujitsu General Ltd. - Overview
- Exhibit 133: Fujitsu General Ltd. - Business segments
- Exhibit 134: Fujitsu General Ltd. - Key offerings
- Exhibit 135: Fujitsu General Ltd. - Segment focus
- 12.9 Haier Smart Home Co. Ltd.
- Exhibit 136: Haier Smart Home Co. Ltd. - Overview
- Exhibit 137: Haier Smart Home Co. Ltd. - Business segments
- Exhibit 138: Haier Smart Home Co. Ltd. - Key offerings
- Exhibit 139: Haier Smart Home Co. Ltd. - Segment focus
- 12.10 Johnson Controls International Plc
- Exhibit 140: Johnson Controls International Plc - Overview
- Exhibit 141: Johnson Controls International Plc - Business segments
- Exhibit 142: Johnson Controls International Plc - Key news
- Exhibit 143: Johnson Controls International Plc - Key offerings
- Exhibit 144: Johnson Controls International Plc - Segment focus
- 12.11 Lennox International Inc.
- Exhibit 145: Lennox International Inc. - Overview
- Exhibit 146: Lennox International Inc. - Business segments
- Exhibit 147: Lennox International Inc. - Key offerings
- Exhibit 148: Lennox International Inc. - Segment focus
- 12.12 LG Electronics Inc.
- Exhibit 149: LG Electronics Inc. - Overview
- Exhibit 150: LG Electronics Inc. - Business segments
- Exhibit 151: LG Electronics Inc. - Key news
- Exhibit 152: LG Electronics Inc. - Key offerings
- Exhibit 153: LG Electronics Inc. - Segment focus
- 12.13 MIDEA Group Co. Ltd.
- Exhibit 154: MIDEA Group Co. Ltd. - Overview
- Exhibit 155: MIDEA Group Co. Ltd. - Business segments
- Exhibit 156: MIDEA Group Co. Ltd. - Key offerings
- Exhibit 157: MIDEA Group Co. Ltd. - Segment focus
- 12.14 Panasonic Holdings Corp.
- Exhibit 158: Panasonic Holdings Corp. - Overview
- Exhibit 159: Panasonic Holdings Corp. - Business segments
- Exhibit 160: Panasonic Holdings Corp. - Key news
- Exhibit 161: Panasonic Holdings Corp. - Key offerings
- Exhibit 162: Panasonic Holdings Corp. - Segment focus
- 12.15 Robert Bosch GmbH
- Exhibit 163: Robert Bosch GmbH - Overview
- Exhibit 164: Robert Bosch GmbH - Business segments
- Exhibit 165: Robert Bosch GmbH - Key news
- Exhibit 166: Robert Bosch GmbH - Key offerings
- Exhibit 167: Robert Bosch GmbH - Segment focus
- 12.16 Samsung Electronics Co. Ltd.
- Exhibit 168: Samsung Electronics Co. Ltd. - Overview
- Exhibit 169: Samsung Electronics Co. Ltd. - Business segments
- Exhibit 170: Samsung Electronics Co. Ltd. - Key news
- Exhibit 171: Samsung Electronics Co. Ltd. - Key offerings
- Exhibit 172: Samsung Electronics Co. Ltd. - Segment focus
- 12.17 Trane Technologies plc
- Exhibit 173: Trane Technologies plc - Overview
- Exhibit 174: Trane Technologies plc - Business segments
- Exhibit 175: Trane Technologies plc - Key offerings
- Exhibit 176: Trane Technologies plc - Segment focus
13 Appendix
- 13.1 Scope of the report
- 13.2 Inclusions and exclusions checklist
- Exhibit 177: Inclusions checklist
- Exhibit 178: Exclusions checklist
- 13.3 Currency conversion rates for US$
- Exhibit 179: Currency conversion rates for US$
- 13.4 Research methodology
- Exhibit 180: Research methodology
- Exhibit 181: Validation techniques employed for market sizing
- Exhibit 182: Information sources
- 13.5 List of abbreviations
- Exhibit 183: List of abbreviations
Technavio is a leading global technology research and advisory company. Their research and analysis focus on emerging market trends and provides actionable insights to help businesses identify market opportunities and develop effective strategies to optimize their market positions. With over 500 specialized analysts, Technavio's report library consists of more than 17,000 reports and counting, covering 800 technologies, spanning across 50 countries. Their client base consists of enterprises of all sizes, including more than 100 Fortune 500 companies. This growing client base relies on Technavio's comprehensive coverage, extensive research, and actionable market insights to identify opportunities in existing and potential markets and assess their competitive positions within changing market scenarios.
Technavio Research
Jesse Maida
Media & Marketing Executive
US: +1 844 364 1100
UK: +44 203 893 3200
Email: media@technavio.com
Website: www.technavio.com/


SOURCE Technavio
© 2024 Benzinga.com. Benzinga does not provide investment advice. All rights reserved.
Trade confidently with insights and alerts from analyst ratings, free reports and breaking news that affects the stocks you care about.

