


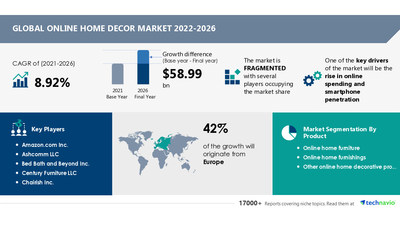
NEW YORK, Nov. 18, 2022 /PRNewswire/ -- The online home decor market size is expected to grow by USD 58.99 billion from 2021 to 2026. In addition, the growth momentum of the market will accelerate at a CAGR of 8.92% during the forecast period, according to Technavio. The rise in online spending and smartphone penetration, the increase in demand for multifunctional furniture, and rising popularity of blogs related to interior designing are propelling the market growth. However, factors such as strict competition from offline channels, long product replacement cycles, and lack of touch-and-feel element will hamper the market growth. Technavio provides a comprehensive report summary describing the market size and forecast along with research methodology. The sample report is available in PDF format

Online Home Decor Market: Geographic Landscape
By geography, the market has been segmented into Europe, North America, APAC, South America, and Middle East and Africa. Europe is going to have lucrative growth during the forecast period. About 42% of the market's overall growth is expected to originate from Europe. The UK and Germany are the key markets for online home decor in Europe. The growth of the market in the region is driven by factors such as the expansion of the urban population base, which is expected to increase the need for residential construction projects. However, market growth in this region will be slower than the growth of the market in APAC.
Learn about the contribution of each region summarized in concise infographics and thorough descriptions. Buy Now to access regional and country-level market information
Online Home Decor Market: Vendor Landscape
The online home decor market is fragmented, with multiple established players. The vendors are deploying organic and inorganic growth strategies to compete in the market. These players compete on different factors, including quality, price, brand, and variety. The acquisition of new brands will help leading competitors maintain their dominance in the global online home decor market during the forecast period. The practice of sustainability is also followed by major competitors. Market players are focusing on the customization of furniture through consumer interactions, which is a trend in the global online home decor market.
Online Home Decor Market: Market Drivers
The rise in online spending and smartphone penetration is driving market growth. Online shopping has gained popularity owing to the high penetration of the Internet, improved economic growth, and purchase and delivery options with the emergence of m-commerce. Security features for online payments, improved online customer services, free delivery, and customer-friendly designs of shopping websites are also contributing to the growth of the market. Rising online sales are also driving the growth of the global online home decor market. The growing emphasis on mobile commerce is primarily driven by the purchase of new smartphones and the creation of more shopping opportunities.
Technavio has identified key trends, drivers, and challenges in the market, which will help vendors improve their strategies to stay ahead of their competitors. View our FREE PDF Sample Report
Online Home Decor Market: Product Landscape
By product, the market has been segmented into online home furniture, online home furnishings, and other online home decorative products. The online home furniture segment will be a major contributor to market growth during the forecast period. The preference for online shopping is rising worldwide, owing to the growing Internet penetration and the increasing number of smartphone users. Online channels enable manufacturers to expand their distribution networks by partnering with third-party e-retailers or creating their own online shopping portals.
Online Home Decor Market: Some Companies Covered
- Amazon.com Inc.
- Ashcomm LLC
- Bed Bath and Beyond Inc.
- Century Furniture LLC
- Chairish Inc.
- Coyuchi Inc.
- D decor Home Fabrics Pvt. Ltd.
- Herman Miller Inc.
- Hoffner Online GmbH & Co. KG
- Home24 SE
- Inter IKEA Holding BV
- LaZBoy Inc.
- Otto GmbH & Co KG
- Pier 1 Imports Inc.
- The Home Depot Inc.
- Urban Ladder Home Decor Solutions Pvt. Ltd.
- Urban Outfitters Inc.
- Walmart Inc.
- Wayfair Inc.
- Williams Sonoma Inc.
Online Home Decor Market: What our Reports Offer
- Market share assessments for the regional and country-level segments
- Strategic recommendations for the new entrants
- Covers market data from 2021 to 2026
- Market trends (drivers, opportunities, investment opportunities, threats, challenges, and recommendations)
- Strategic recommendations in key business segments based on the market estimations
- Competitive landscaping mapping the key common trends
- Company profiling with financials, detailed strategies, and recent developments
- Supply chain trends mapping the latest technological advancements
Get lifetime access to our Technavio Insights! Subscribe to our Basic Plan billed annually at USD 5000
Related Reports
Online Home Decor Market in India Growth, Size, Trends, Analysis Report by Type, Application, Region, and Segment Forecast 2022-2026: Growing demand for eco-friendly home decor items is a key trend. The increasing consciousness of a healthy environment has increased the demand for eco-friendly furniture and other furnishings. Moreover, various legal agencies help vendors in developing eco-friendly home furnishings.
Online Furniture Market Growth, Size, Trends, Analysis Report by Type, Application, Region, and Segment Forecast 2022-2026: Mobile commerce and network marketing are a trend in the market. Smartphones have become an important part of modern life, which has paved the way for online shopping. Hence, retailers such as Amazon.com, Flipkart, and Alibaba Group have launched mobile applications.
Online Home Decor Market Scope | |
Report Coverage | Details |
Page number | 120 |
Base year | 2021 |
Forecast period | 2022-2026 |
Growth momentum & CAGR | Accelerate at a CAGR of 8.92% |
Market growth 2022-2026 | USD 58.99 billion |
Market structure | Fragmented |
YoY growth (%) | 7.49 |
Regional analysis | Europe, North America, APAC, South America, and Middle East and Africa |
Performing market contribution | Europe at 42% |
Key consumer countries | US, Canada, China, UK, and Germany |
Competitive landscape | Leading companies, competitive strategies, consumer engagement scope |
Companies profiled | Amazon.com Inc., Ashcomm LLC, Bed Bath and Beyond Inc., Century Furniture LLC, Chairish Inc., Coyuchi Inc., D decor Home Fabrics Pvt. Ltd., Herman Miller Inc., Hoffner Online GmbH & Co. KG, Home24 SE, Inter IKEA Holding BV, LaZBoy Inc., Otto GmbH & Co KG, Pier 1 Imports Inc., The Home Depot Inc., Urban Ladder Home Decor Solutions Pvt. Ltd., Urban Outfitters Inc., Walmart Inc., Wayfair Inc., and Williams Sonoma Inc. |
Market Dynamics | Parent market analysis, market growth inducers and obstacles, fast-growing and slow-growing segment analysis, COVID-19 impact and future consumer dynamics, and market condition analysis for the forecast period. |
Customization purview | If our report has not included the data that you are looking for, you can reach out to our analysts and get segments customized. |
Browse Consumer Discretionary Market Reports
Table of Contents
1 Executive Summary
- 1.1 Market overview
- Exhibit 01: Executive Summary – Chart on Market Overview
- Exhibit 02: Executive Summary – Data Table on Market Overview
- Exhibit 03: Executive Summary – Chart on Global Market Characteristics
- Exhibit 04: Executive Summary – Chart on Market by Geography
- Exhibit 05: Executive Summary – Chart on Market Segmentation by Product
- Exhibit 06: Executive Summary – Chart on Incremental Growth
- Exhibit 07: Executive Summary – Data Table on Incremental Growth
- Exhibit 08: Executive Summary – Chart on Vendor Market Positioning
2 Market Landscape
- 2.1 Market ecosystem
- Exhibit 09: Parent market
- Exhibit 10: Market Characteristics
3 Market Sizing
- 3.1 Market definition
- Exhibit 11: Offerings of vendors included in the market definition
- 3.2 Market segment analysis
- Exhibit 12: Market segments
- 3.3 Market size 2021
- 3.4 Market outlook: Forecast for 2021-2026
- Exhibit 13: Chart on Global - Market size and forecast 2021-2026 ($ billion)
- Exhibit 14: Data Table on Global - Market size and forecast 2021-2026 ($ billion)
- Exhibit 15: Chart on Global Market: Year-over-year growth 2021-2026 (%)
- Exhibit 16: Data Table on Global Market: Year-over-year growth 2021-2026 (%)
4 Five Forces Analysis
- 4.1 Five forces summary
- Exhibit 17: Five forces analysis - Comparison between 2021 and 2026
- 4.2 Bargaining power of buyers
- Exhibit 18: Chart on Bargaining power of buyers – Impact of key factors 2021 and 2026
- 4.3 Bargaining power of suppliers
- Exhibit 19: Bargaining power of suppliers – Impact of key factors in 2021 and 2026
- 4.4 Threat of new entrants
- Exhibit 20: Threat of new entrants – Impact of key factors in 2021 and 2026
- 4.5 Threat of substitutes
- Exhibit 21: Threat of substitutes – Impact of key factors in 2021 and 2026
- 4.6 Threat of rivalry
- Exhibit 22: Threat of rivalry – Impact of key factors in 2021 and 2026
- 4.7 Market condition
- Exhibit 23: Chart on Market condition - Five forces 2021 and 2026
5 Market Segmentation by Product
- 5.1 Market segments
- Exhibit 24: Chart on Product - Market share 2021-2026 (%)
- Exhibit 25: Data Table on Product - Market share 2021-2026 (%)
- 5.2 Comparison by Product
- Exhibit 26: Chart on Comparison by Product
- Exhibit 27: Data Table on Comparison by Product
- 5.3 Online home furniture - Market size and forecast 2021-2026
- Exhibit 28: Chart on Online home furniture - Market size and forecast 2021-2026 ($ billion)
- Exhibit 29: Data Table on Online home furniture - Market size and forecast 2021-2026 ($ billion)
- Exhibit 30: Chart on Online home furniture - Year-over-year growth 2021-2026 (%)
- Exhibit 31: Data Table on Online home furniture - Year-over-year growth 2021-2026 (%)
- 5.4 Online home furnishings - Market size and forecast 2021-2026
- Exhibit 32: Chart on Online home furnishings - Market size and forecast 2021-2026 ($ billion)
- Exhibit 33: Data Table on Online home furnishings - Market size and forecast 2021-2026 ($ billion)
- Exhibit 34: Chart on Online home furnishings - Year-over-year growth 2021-2026 (%)
- Exhibit 35: Data Table on Online home furnishings - Year-over-year growth 2021-2026 (%)
- 5.5 Other online home decorative products - Market size and forecast 2021-2026
- Exhibit 36: Chart on Other online home decorative products - Market size and forecast 2021-2026 ($ billion)
- Exhibit 37: Data Table on Other online home decorative products - Market size and forecast 2021-2026 ($ billion)
- Exhibit 38: Chart on Other online home decorative products - Year-over-year growth 2021-2026 (%)
- Exhibit 39: Data Table on Other online home decorative products - Year-over-year growth 2021-2026 (%)
- 5.6 Market opportunity by Product
- Exhibit 40: Market opportunity by Product ($ billion)
6 Customer Landscape
- 6.1 Customer landscape overview
- Exhibit 41: Analysis of price sensitivity, lifecycle, customer purchase basket, adoption rates, and purchase criteria
7 Geographic Landscape
- 7.1 Geographic segmentation
- Exhibit 42: Chart on Market share by geography 2021-2026 (%)
- Exhibit 43: Data Table on Market share by geography 2021-2026 (%)
- 7.2 Geographic comparison
- Exhibit 44: Chart on Geographic comparison
- Exhibit 45: Data Table on Geographic comparison
- 7.3 Europe - Market size and forecast 2021-2026
- Exhibit 46: Chart on Europe - Market size and forecast 2021-2026 ($ billion)
- Exhibit 47: Data Table on Europe - Market size and forecast 2021-2026 ($ billion)
- Exhibit 48: Chart on Europe - Year-over-year growth 2021-2026 (%)
- Exhibit 49: Data Table on Europe - Year-over-year growth 2021-2026 (%)
- 7.4 North America - Market size and forecast 2021-2026
- Exhibit 50: Chart on North America - Market size and forecast 2021-2026 ($ billion)
- Exhibit 51: Data Table on North America - Market size and forecast 2021-2026 ($ billion)
- Exhibit 52: Chart on North America - Year-over-year growth 2021-2026 (%)
- Exhibit 53: Data Table on North America - Year-over-year growth 2021-2026 (%)
- 7.5 APAC - Market size and forecast 2021-2026
- Exhibit 54: Chart on APAC - Market size and forecast 2021-2026 ($ billion)
- Exhibit 55: Data Table on APAC - Market size and forecast 2021-2026 ($ billion)
- Exhibit 56: Chart on APAC - Year-over-year growth 2021-2026 (%)
- Exhibit 57: Data Table on APAC - Year-over-year growth 2021-2026 (%)
- 7.6 South America - Market size and forecast 2021-2026
- Exhibit 58: Chart on South America - Market size and forecast 2021-2026 ($ billion)
- Exhibit 59: Data Table on South America - Market size and forecast 2021-2026 ($ billion)
- Exhibit 60: Chart on South America - Year-over-year growth 2021-2026 (%)
- Exhibit 61: Data Table on South America - Year-over-year growth 2021-2026 (%)
- 7.7 Middle East and Africa - Market size and forecast 2021-2026
- Exhibit 62: Chart on Middle East and Africa - Market size and forecast 2021-2026 ($ billion)
- Exhibit 63: Data Table on Middle East and Africa - Market size and forecast 2021-2026 ($ billion)
- Exhibit 64: Chart on Middle East and Africa - Year-over-year growth 2021-2026 (%)
- Exhibit 65: Data Table on Middle East and Africa - Year-over-year growth 2021-2026 (%)
- 7.8 US - Market size and forecast 2021-2026
- Exhibit 66: Chart on US - Market size and forecast 2021-2026 ($ billion)
- Exhibit 67: Data Table on US - Market size and forecast 2021-2026 ($ billion)
- Exhibit 68: Chart on US - Year-over-year growth 2021-2026 (%)
- Exhibit 69: Data Table on US - Year-over-year growth 2021-2026 (%)
- 7.9 Germany - Market size and forecast 2021-2026
- Exhibit 70: Chart on Germany - Market size and forecast 2021-2026 ($ billion)
- Exhibit 71: Data Table on Germany - Market size and forecast 2021-2026 ($ billion)
- Exhibit 72: Chart on Germany - Year-over-year growth 2021-2026 (%)
- Exhibit 73: Data Table on Germany - Year-over-year growth 2021-2026 (%)
- 7.10 China - Market size and forecast 2021-2026
- Exhibit 74: Chart on China - Market size and forecast 2021-2026 ($ billion)
- Exhibit 75: Data Table on China - Market size and forecast 2021-2026 ($ billion)
- Exhibit 76: Chart on China - Year-over-year growth 2021-2026 (%)
- Exhibit 77: Data Table on China - Year-over-year growth 2021-2026 (%)
- 7.11 UK - Market size and forecast 2021-2026
- Exhibit 78: Chart on UK - Market size and forecast 2021-2026 ($ billion)
- Exhibit 79: Data Table on UK - Market size and forecast 2021-2026 ($ billion)
- Exhibit 80: Chart on UK - Year-over-year growth 2021-2026 (%)
- Exhibit 81: Data Table on UK - Year-over-year growth 2021-2026 (%)
- 7.12 Canada - Market size and forecast 2021-2026
- Exhibit 82: Chart on Canada - Market size and forecast 2021-2026 ($ billion)
- Exhibit 83: Data Table on Canada - Market size and forecast 2021-2026 ($ billion)
- Exhibit 84: Chart on Canada - Year-over-year growth 2021-2026 (%)
- Exhibit 85: Data Table on Canada - Year-over-year growth 2021-2026 (%)
- 7.13 Market opportunity by geography
- Exhibit 86: Market opportunity by geography ($ billion)
8 Drivers, Challenges, and Trends
- 8.1 Market drivers
- 8.2 Market challenges
- 8.3 Impact of drivers and challenges
- Exhibit 87: Impact of drivers and challenges in 2021 and 2026
- 8.4 Market trends
9 Vendor Landscape
- 9.1 Overview
- 9.2 Vendor landscape
- Exhibit 88: Overview on Criticality of inputs and Factors of differentiation
- 9.3 Landscape disruption
- Exhibit 89: Overview on factors of disruption
- 9.4 Industry risks
- Exhibit 90: Impact of key risks on business
10 Vendor Analysis
- 10.1 Vendors covered
- Exhibit 91: Vendors covered
- 10.2 Market positioning of vendors
- Exhibit 92: Matrix on vendor position and classification
- 10.3 Amazon.com Inc.
- Exhibit 93: Amazon.com Inc. - Overview
- Exhibit 94: Amazon.com Inc. - Business segments
- Exhibit 95: Amazon.com Inc. - Key news
- Exhibit 96: Amazon.com Inc. - Key offerings
- Exhibit 97: Amazon.com Inc. - Segment focus
- 10.4 Ashcomm LLC
- Exhibit 98: Ashcomm LLC - Overview
- Exhibit 99: Ashcomm LLC - Product / Service
- Exhibit 100: Ashcomm LLC - Key offerings
- 10.5 Bed Bath and Beyond Inc.
- Exhibit 101: Bed Bath and Beyond Inc. - Overview
- Exhibit 102: Bed Bath and Beyond Inc. - Product / Service
- Exhibit 103: Bed Bath and Beyond Inc. - Key news
- Exhibit 104: Bed Bath and Beyond Inc. - Key offerings
- 10.6 Herman Miller Inc.
- Exhibit 105: Herman Miller Inc. - Overview
- Exhibit 106: Herman Miller Inc. - Business segments
- Exhibit 107: Herman Miller Inc. - Key offerings
- Exhibit 108: Herman Miller Inc. - Segment focus
- 10.7 Inter IKEA Holding BV
- Exhibit 109: Inter IKEA Holding BV - Overview
- Exhibit 110: Inter IKEA Holding BV - Product / Service
- Exhibit 111: Inter IKEA Holding BV - Key news
- Exhibit 112: Inter IKEA Holding BV - Key offerings
- 10.8 Urban Ladder Home Decor Solutions Pvt. Ltd.
- Exhibit 113: Urban Ladder Home Decor Solutions Pvt. Ltd. - Overview
- Exhibit 114: Urban Ladder Home Decor Solutions Pvt. Ltd. - Key offerings
- 10.9 Urban Outfitters Inc.
- Exhibit 115: Urban Outfitters Inc. - Overview
- Exhibit 116: Urban Outfitters Inc. - Business segments
- Exhibit 117: Urban Outfitters Inc. - Key offerings
- Exhibit 118: Urban Outfitters Inc. - Segment focus
- 10.10 Walmart Inc.
- Exhibit 119: Walmart Inc. - Overview
- Exhibit 120: Walmart Inc. - Business segments
- Exhibit 121: Walmart Inc. - Key news
- Exhibit 122: Walmart Inc. - Key offerings
- Exhibit 123: Walmart Inc. - Segment focus
- 10.11 Wayfair Inc.
- Exhibit 124: Wayfair Inc. - Overview
- Exhibit 125: Wayfair Inc. - Business segments
- Exhibit 126: Wayfair Inc. - Key news
- Exhibit 127: Wayfair Inc. - Key offerings
- Exhibit 128: Wayfair Inc. - Segment focus
- 10.12 Williams Sonoma Inc.
- Exhibit 129: Williams Sonoma Inc. - Overview
- Exhibit 130: Williams Sonoma Inc. - Business segments
- Exhibit 131: Williams Sonoma Inc. - Key news
- Exhibit 132: Williams Sonoma Inc. - Key offerings
- Exhibit 133: Williams Sonoma Inc. - Segment focus
11 Appendix
- 11.1 Scope of the report
- 11.2 Inclusions and exclusions checklist
- Exhibit 134: Inclusions checklist
- Exhibit 135: Exclusions checklist
- 11.3 Currency conversion rates for US$
- Exhibit 136: Currency conversion rates for US$
- 11.4 Research methodology
- Exhibit 137: Research methodology
- Exhibit 138: Validation techniques employed for market sizing
- Exhibit 139: Information sources
- 11.5 List of abbreviations
- Exhibit 140: List of abbreviations
Technavio is a leading global technology research and advisory company. Their research and analysis focus on emerging market trends and provide actionable insights to help businesses identify market opportunities and develop effective strategies to optimize their market positions. With over 500 specialized analysts, Technavio's report library consists of more than 17,000 reports and counting, covering 800 technologies, spanning across 50 countries. Their client base consists of enterprises of all sizes, including more than 100 Fortune 500 companies. This growing client base relies on Technavio's comprehensive coverage, extensive research, and actionable market insights to identify opportunities in existing and potential markets and assess their competitive positions within changing market scenarios.
Contact
Technavio Research
Jesse Maida
Media & Marketing Executive
US: +1 844 364 1100
UK: +44 203 893 3200
Email: media@technavio.com
Website: www.technavio.com/


SOURCE Infiniti Research, Inc.
© 2024 Benzinga.com. Benzinga does not provide investment advice. All rights reserved.
Trade confidently with insights and alerts from analyst ratings, free reports and breaking news that affects the stocks you care about.

