


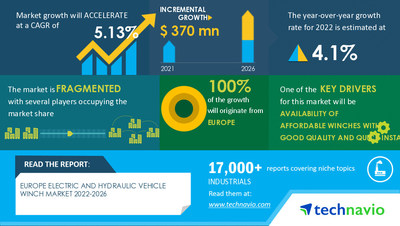
NEW YORK, Nov. 14, 2022 /PRNewswire/ -- According to the research report, Europe Electric and Hydraulic Vehicle Winch Market will grow by USD 370 million with YOY growth of 4.1% in 2022 at a CAGR of 5.13% during the forecast period. The report is segmented by type and geography. The availability of reasonably priced, high-quality, and easy-to-install winches is a major element fueling the expansion of the European electric and hydraulic vehicle winch market. Request a FREE Sample Report.

Europe Electric and Hydraulic Vehicle Winch Market: Segment Analysis
- By Type
- Electric vehicle
- Hydraulic vehicle
The electric and hydraulic vehicle winch market in Europe's share growth in the electric vehicle segment will be significant during the forecast period. When compared to hydraulic vehicles, the electric vehicle (EV) segment of the electric and hydraulic vehicle winch market in Europe is anticipated to have substantial expansion. An electric vehicle (EV) is a vehicle that runs on batteries and has an electronic traction motor. EVs can run entirely or mostly on electricity. The main reasons propelling the expansion of the EV segment of the electric and hydraulic vehicle winch market in Europe are the tightening of fuel economy rules in the region and increased commitments from domestic automakers. Download a Free Sample Report.
Europe Electric and Hydraulic Vehicle Winch Market: Vendor Insights
The European electric and hydraulic vehicle winch market has some well-established players that design and produce electric and hydraulic winches for various industries. The manufacturers of electric winch equipment continuously work toward developing stronger and more innovative designs for their customers. Over the coming years, prominent vendors are expected to focus on adopting digital solutions to increase the efficiency of an electric winch. Despite the presence of a large number of global vendors, there are many regional vendors that offer high-quality equipment at low prices.
The report analyzes the market's competitive landscape and offers information on several market vendors, including:
- Bosch Rexroth AG
- Friedrich Koster GmbH & Co. KG
- FUKUSHIMA LTD.
- haacon hebetechnik Gmbh
- Harken Inc.
- Ingersoll Rand Inc.
- Ironman 4X4 Pty Ltd.
- Mile Marker Industries
- Naust Marine EHF.
- PACCAR WINCH
- Pierce Arrow Inc.
- Ramsey Winch
- Smittybilt Inc.
- Superwinch
- T MAX
- Thern Inc.
Find additional highlights on the growth strategies adopted by vendors and their product offerings, Buy Sample Report.
Europe Electric and Hydraulic Vehicle Winch Market: Drivers & Challenges:
The availability of reasonably priced, high-quality, and easy-to-install winches is a major element fueling the expansion of the European electric and hydraulic vehicle winch market. The market for automobile trailer recovery systems in Europe is expanding, offering a greater range of solutions of higher quality and durability. The European electric and hydraulic vehicle winch market is a key segment of the European trailer recovery systems market, which has experienced advancements in system design and functionality to give a greater performance in towing applications. The availability of such reasonably priced car winch systems with high-quality components from reputable suppliers is thus fueling the development of the electric and hydraulic vehicle winch market in Europe.
However, the major challenge to the expansion of the European electric and hydraulic vehicle winch industry is the increasingly competitive value chain, which leads to shrinking profit margins for suppliers.
Get lifetime access to our Technavio Insights! Subscribe to our "Basic Plan" billed annually at USD 5000.
Related Reports:
Pressure Washer Market by End-user, Type, and Geography - Forecast and Analysis 2022-2026: The report extensively covers the pressure washer market segmentation by end-user (consumer, commercial, and industrial), type (electric pressure washers and electric-driven pressure washers), and geography (North America, Europe, APAC, the Middle East and Africa, and South America).
Computer Numerical Control Solutions Market by End-user, Solution, and Geography - Forecast and Analysis 2022-2026: The report extensively covers the computer numerical control solutions market segmentation by end-user (automotive, aerospace, industrial machinery, and others), solution (servo drives, servo motors, and controllers), and geography (APAC, North America, Europe, South America, and the Middle East and Africa).
Electric And Hydraulic Vehicle Winch Market in Europe Scope | |
Report Coverage | Details |
Page number | 120 |
Base year | 2021 |
Forecast period | 2022-2026 |
Growth momentum & CAGR | Accelerate at a CAGR of 5.13% |
Market growth 2022-2026 | $370 million |
Market structure | Fragmented |
YoY growth (%) | 4.1 |
Competitive landscape | Leading companies, Competitive Strategies, Consumer engagement scope |
Key companies profiled | Bosch Rexroth AG, Friedrich Koster GmbH & Co. KG, FUKUSHIMA LTD., haacon hebetechnik Gmbh, Harken Inc., Ingersoll Rand Inc., Ironman 4X4 Pty Ltd., Mile Marker Industries, Naust Marine EHF., PACCAR WINCH, Pierce Arrow Inc., Ramsey Winch, Smittybilt Inc., Superwinch, T MAX, Thern Inc., TJM Products Pty Ltd., Trelleborg AB, WARN Industries Inc., and Westin Automotive Inc. |
Market dynamics | Parent market analysis, Market growth inducers and obstacles, Fast-growing and slow-growing segment analysis, COVID-19 impact and recovery analysis and future consumer dynamics, and Market condition analysis for the forecast period. |
Customization purview | If our report has not included the data that you are looking for, you can reach out to our analysts and get segments customized. |
Table of Contents
1 Executive Summary
- 1.1 Market Overview
- Exhibit 01: Executive Summary – Chart on Market Overview
- Exhibit 02: Executive Summary – Data Table on Market Overview
- Exhibit 03: Executive Summary – Chart on Country Market Characteristics
- Exhibit 04: Executive Summary – Chart on Market by Geography
- Exhibit 05: Executive Summary – Chart on Market Segmentation by Type
- Exhibit 06: Executive Summary – Chart on Incremental Growth
- Exhibit 07: Executive Summary – Data Table on Incremental Growth
- Exhibit 08: Executive Summary – Chart on Vendor Market Positioning
2 Market Landscape
- 2.1 Market ecosystem
- Exhibit 09: Parent market
- Exhibit 10: Market Characteristics
3 Market Sizing
- 3.1 Market definition
- Exhibit 11: Offerings of vendors included in the market definition
- 3.2 Market segment analysis
- Exhibit 12: Market segments
- 3.3 Market size 2021
- 3.4 Market outlook: Forecast for 2021-2026
- Exhibit 13: Chart on Europe - Market size and forecast 2021-2026 ($ million)
- Exhibit 14: Data Table on Regional - Market size and forecast 2021-2026 ($ million)
- Exhibit 15: Chart on Europe: Year-over-year growth 2021-2026 (%)
- Exhibit 16: Data Table on Regional - Market size and forecast 2021-2026 ($ million)
4 Five Forces Analysis
- 4.1 Five forces summary
- Exhibit 17: Five forces analysis - Comparison between 2021 and 2026
- 4.2 Bargaining power of buyers
- Exhibit 18: Chart on Bargaining power of buyers – Impact of key factors 2021 and 2026
- 4.3 Bargaining power of suppliers
- Exhibit 19: Bargaining power of suppliers – Impact of key factors in 2021 and 2026
- 4.4 Threat of new entrants
- Exhibit 20: Threat of new entrants – Impact of key factors in 2021 and 2026
- 4.5 Threat of substitutes
- Exhibit 21: Threat of substitutes – Impact of key factors in 2021 and 2026
- 4.6 Threat of rivalry
- Exhibit 22: Threat of rivalry – Impact of key factors in 2021 and 2026
- 4.7 Market condition
- Exhibit 23: Chart on Market condition - Five forces 2021 and 2026
5 Market Segmentation by Type
- 5.1 Market segments
- Exhibit 24: Chart on Type - Market share 2021-2026 (%)
- Exhibit 25: Data Table on Type - Market share 2021-2026 (%)
- 5.2 Comparison by Type
- Exhibit 26: Chart on Comparison by Type
- Exhibit 27: Data Table on Comparison by Type
- 5.3 Electric vehicle - Market size and forecast 2021-2026
- Exhibit 28: Chart on Electric vehicle - Market size and forecast 2021-2026 ($ million)
- Exhibit 29: Data Table on Electric vehicle - Market size and forecast 2021-2026 ($ million)
- Exhibit 30: Chart on Electric vehicle - Year-over-year growth 2021-2026 (%)
- Exhibit 31: Data Table on Electric vehicle - Year-over-year growth 2021-2026 (%)
- 5.4 Hydraulic vehicle - Market size and forecast 2021-2026
- Exhibit 32: Chart on Hydraulic vehicle - Market size and forecast 2021-2026 ($ million)
- Exhibit 33: Data Table on Hydraulic vehicle - Market size and forecast 2021-2026 ($ million)
- Exhibit 34: Chart on Hydraulic vehicle - Year-over-year growth 2021-2026 (%)
- Exhibit 35: Data Table on Hydraulic vehicle - Year-over-year growth 2021-2026 (%)
- 5.5 Market opportunity by Type
- Exhibit 36: Market opportunity by Type ($ million)
6 Customer Landscape
- 6.1 Customer landscape overview
- Exhibit 37: Analysis of price sensitivity, lifecycle, customer purchase basket, adoption rates, and purchase criteria
7 Geographic Landscape
- 7.1 Geographic segmentation
- Exhibit 38: Chart on Market share by geography - 2021-2026 (%)
- Exhibit 39: Data Table on Market share by geography - 2021-2026 (%)
- 7.2 Geographic comparison
- Exhibit 40: Chart on Geographic comparison
- Exhibit 41: Data Table on Geographic comparison
- 7.3 Germany - Market size and forecast 2021-2026
- Exhibit 42: Chart on Germany - Market size and forecast 2021-2026 ($ million)
- Exhibit 43: Data Table on Germany - Market size and forecast 2021-2026 ($ million)
- Exhibit 44: Chart on Germany - Year-over-year growth 2021-2026 (%)
- Exhibit 45: Data Table on Germany - Year-over-year growth 2021-2026 (%)
- 7.4 UK - Market size and forecast 2021-2026
- Exhibit 46: Chart on UK - Market size and forecast 2021-2026 ($ million)
- Exhibit 47: Data Table on UK - Market size and forecast 2021-2026 ($ million)
- Exhibit 48: Chart on UK - Year-over-year growth 2021-2026 (%)
- Exhibit 49: Data Table on UK - Year-over-year growth 2021-2026 (%)
- 7.5 France - Market size and forecast 2021-2026
- Exhibit 50: Chart on France - Market size and forecast 2021-2026 ($ million)
- Exhibit 51: Data Table on France - Market size and forecast 2021-2026 ($ million)
- Exhibit 52: Chart on France - Year-over-year growth 2021-2026 (%)
- Exhibit 53: Data Table on France - Year-over-year growth 2021-2026 (%)
- 7.6 Italy - Market size and forecast 2021-2026
- Exhibit 54: Chart on Italy - Market size and forecast 2021-2026 ($ million)
- Exhibit 55: Data Table on Italy - Market size and forecast 2021-2026 ($ million)
- Exhibit 56: Chart on Italy - Year-over-year growth 2021-2026 (%)
- Exhibit 57: Data Table on Italy - Year-over-year growth 2021-2026 (%)
- 7.7 Rest of Europe - Market size and forecast 2021-2026
- Exhibit 58: Chart on Rest of Europe - Market size and forecast 2021-2026 ($ million)
- Exhibit 59: Data Table on Rest of Europe - Market size and forecast 2021-2026 ($ million)
- Exhibit 60: Chart on Rest of Europe - Year-over-year growth 2021-2026 (%)
- Exhibit 61: Data Table on Rest of Europe - Year-over-year growth 2021-2026 (%)
- 7.8 Market opportunity by geography
- Exhibit 62: Market opportunity by geography ($ million)
8 Drivers, Challenges, and Trends
- 8.1 Market drivers
- 8.2 Market challenges
- 8.3 Impact of drivers and challenges
- Exhibit 63: Impact of drivers and challenges in 2021 and 2026
- 8.4 Market trends
9 Vendor Landscape
- 9.1 Overview
- 9.2 Vendor landscape
- Exhibit 64: Overview on Criticality of inputs and Factors of differentiation
- 9.3 Landscape disruption
- Exhibit 65: Overview on factors of disruption
- 9.4 Industry risks
- Exhibit 66: Impact of key risks on business
10 Vendor Analysis
- 10.1 Vendors covered
- Exhibit 67: Vendors covered
- 10.2 Market positioning of vendors
- Exhibit 68: Matrix on vendor position and classification
- 10.3 Ironman 4X4 Pty Ltd.
- Exhibit 69: Ironman 4X4 Pty Ltd. - Overview
- Exhibit 70: Ironman 4X4 Pty Ltd. - Product / Service
- Exhibit 71: Ironman 4X4 Pty Ltd. - Key offerings
- 10.4 Mile Marker Industries
- Exhibit 72: Mile Marker Industries - Overview
- Exhibit 73: Mile Marker Industries - Product / Service
- Exhibit 74: Mile Marker Industries - Key offerings
- 10.5 Pierce Arrow Inc.
- Exhibit 75: Pierce Arrow Inc. - Overview
- Exhibit 76: Pierce Arrow Inc. - Product / Service
- Exhibit 77: Pierce Arrow Inc. - Key offerings
- 10.6 Ramsey Winch
- Exhibit 78: Ramsey Winch - Overview
- Exhibit 79: Ramsey Winch - Product / Service
- Exhibit 80: Ramsey Winch - Key offerings
- 10.7 Smittybilt Inc.
- Exhibit 81: Smittybilt Inc. - Overview
- Exhibit 82: Smittybilt Inc. - Product / Service
- Exhibit 83: Smittybilt Inc. - Key offerings
- 10.8 Superwinch
- Exhibit 84: Superwinch - Overview
- Exhibit 85: Superwinch - Product / Service
- Exhibit 86: Superwinch - Key offerings
- 10.9 T MAX
- Exhibit 87: T MAX - Overview
- Exhibit 88: T MAX - Product / Service
- Exhibit 89: T MAX - Key offerings
- 10.10 TJM Products Pty Ltd.
- Exhibit 90: TJM Products Pty Ltd. - Overview
- Exhibit 91: TJM Products Pty Ltd. - Product / Service
- Exhibit 92: TJM Products Pty Ltd. - Key offerings
- 10.11 WARN Industries Inc.
- Exhibit 93: WARN Industries Inc. - Overview
- Exhibit 94: WARN Industries Inc. - Product / Service
- Exhibit 95: WARN Industries Inc. - Key offerings
- 10.12 Westin Automotive Inc.
- Exhibit 96: Westin Automotive Inc. - Overview
- Exhibit 97: Westin Automotive Inc. - Product / Service
- Exhibit 98: Westin Automotive Inc. - Key offerings
11 Appendix
- 11.1 Scope of the report
- 11.2 Inclusions and exclusions checklist
- Exhibit 99: Inclusions checklist
- Exhibit 100: Exclusions checklist
- 11.3 Currency conversion rates for US$
- Exhibit 101: Currency conversion rates for US$
- 11.4 Research methodology
- Exhibit 102: Research methodology
- Exhibit 103: Validation techniques employed for market sizing
- Exhibit 104: Information sources
- 11.5 List of abbreviations
- Exhibit 105: List of abbreviations
Technavio is a leading global technology research and advisory company. Their research and analysis focus on emerging market trends and provides actionable insights to help businesses identify market opportunities and develop effective strategies to optimize their market positions. With over 500 specialized analysts, Technavio's report library consists of more than 17,000 reports and counting, covering 800 technologies, spanning across 50 countries. Their client base consists of enterprises of all sizes, including more than 100 Fortune 500 companies. This growing client base relies on Technavio's comprehensive coverage, extensive research, and actionable market insights to identify opportunities in existing and potential markets and assess their competitive positions within changing market scenarios.
Contact
Technavio Research
Jesse Maida
Media & Marketing Executive
US: +1 844 364 1100
UK: +44 203 893 3200
Email: media@technavio.com
Website: www.technavio.com/


SOURCE Technavio
© 2024 Benzinga.com. Benzinga does not provide investment advice. All rights reserved.
Trade confidently with insights and alerts from analyst ratings, free reports and breaking news that affects the stocks you care about.

