


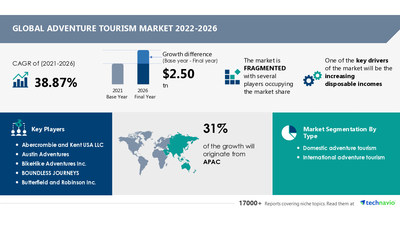
NEW YORK, Nov. 11, 2022 /PRNewswire/ -- The adventure tourism market size is expected to grow by USD 2.50 trillion from 2021 to 2026. In addition, the growth momentum of the market will accelerate at a CAGR of 38.87% during the forecast period, according to Technavio. The market has been segmented by type (domestic adventure tourism and international adventure tourism), source (indirect contribution, direct contribution, and induced contribution), and geography (Europe, APAC, North America, South America, and Middle East and Africa). The report offers a detailed analysis of the current market scenario, the latest trends and drivers, and the overall market environment. Download FREE Sample Report

Adventure Tourism Market: Segmentation Analysis
APAC is expected to lead the adventure tourism market during the forecast period. The region will account for 31% of the market's growth. The region is expected to register the highest growth owing to factors such as the significant increase in disposable income and the presence of numerous exotic destinations. Moreover, market growth in this region will be faster than the growth of the market in other regions. China and Japan are the key countries for the adventure tourism market in the region.
Get lifetime access to our Technavio Insights! Subscribe to our Basic Plan billed annually at USD 5000
The domestic adventure tourism segment is expected to witness significant growth during the forecast period, as the COVID-19 outbreak has restricted international travel, and consumer spending power has declined due to the economic slowdown. The growth in domestic adventure tourism is also driven by the absence of currency exchange rates, favorable government regulations, and familiarity with the culture and language. In addition, the growth of this segment is driven by the strong growth in developing economies owing to an increase in support opportunities by economic development and regional economic benefits.
Learn about the contribution of each segment summarized in concise infographics and thorough descriptions. View a FREE PDF Sample Report
Adventure Tourism Market: Driver and Trend
The increasing disposable income is driving market growth. For instance, according to the data stated by the Bureau of Economic Analysis, in 2019, the disposable personal income (DPI) after the income tax increased from 0.3% in May 2019 to 0.4% in June 2019. According to the data published by the Department of Commerce, 95.5 million international visitors are expected to visit the US annually by 2023. This will boost the demand for luxurious travel to various destinations, which, in turn, will fuel the market growth during the forecast period.
Online reviews encouraging the travel industry is a key trend in the market. Travelers tend to check online reviews before planning a visit, owing to easy internet access and the rise in smartphone penetration. They get all the necessary information and tools in terms of testimonials through these reviews. This allows travelers to plan their journey and obtain food and lodging facilities in advance. In addition, online reviews provide direct access to images, videos, reviews, weather reports, and maps and guides of the destination. These factors will further support the market growth.
Know more about the global trends impacting the future of the market. Buy Now for detailed information about market dynamics
Related Reports
Wellness Tourism Market Growth, Size, Trends, Analysis Report by Type, Application, Region, and Segment Forecast 2022-2026: The emergence of online wellness aggregators is a key trend. The use of the Internet to create an online repository and track user preferences are the upcoming trends in this market. This would further boost the growth of the hotels and other wellness centers that match up to customer expectations.
Amusement Park Market Growth, Size, Trends, Analysis Report by Type, Application, Region, and Segment Forecast 2022-2026: The introduction of virtual theme parks is a key market trend. Virtual reality involves the creation of a 3D, computer-generated environment. This immersive environment simulates experience through senses and perceptions.
Adventure Tourism Market Scope | |
Report Coverage | Details |
Page number | 120 |
Base year | 2021 |
Forecast period | 2022-2026 |
Growth momentum & CAGR | Accelerate at a CAGR of 38.87% |
Market growth 2022-2026 | USD 2.50 trillion |
Market structure | Fragmented |
YoY growth (%) | 24.26 |
Regional analysis | Europe, APAC, North America, South America, and Middle East and Africa |
Performing market contribution | APAC at 31% |
Key consumer countries | US, China, Japan, Germany, Italy, US, China, Japan, Germany, and Italy |
Competitive landscape | Leading companies, Competitive strategies, Consumer engagement scope |
Key companies profiled | Abercrombie and Kent USA LLC, Austin Adventures, BikeHike Adventures Inc., BOUNDLESS JOURNEYS, Butterfield and Robinson Inc., Exodus Travels Ltd., Explore Worldwide Ltd., G Adventures, Geographic Expeditions Inc., Intrepid Group, Kensington Tours Ltd., Lindblad Expeditions Holdings Inc., MT Sobek, Passages Exotic Expeditions Ltd, Recreational Equipment Inc., ROW Adventures, The Walt Disney Co., Trafalgar Tours Pty Ltd, Travelopia, and TUI AG |
Market dynamics | Parent market analysis, Market growth inducers and obstacles, Fast-growing and slow-growing segment analysis, COVID-19 impact and recovery analysis and future consumer dynamics, and Market condition analysis for the forecast period. |
Customization purview | If our report has not included the data that you are looking for, you can reach out to our analysts and get segments customized. |
Browse Consumer Discretionary Market Reports
Table of Contents
1 Executive Summary
- 1.1 Market overview
- Exhibit 01: Executive Summary – Chart on Market Overview
- Exhibit 02: Executive Summary – Data Table on Market Overview
- Exhibit 03: Executive Summary – Chart on Global Market Characteristics
- Exhibit 04: Executive Summary – Chart on Market by Geography
- Exhibit 05: Executive Summary – Chart on Market Segmentation by Type
- Exhibit 06: Executive Summary – Chart on Market Segmentation by Source
- Exhibit 07: Executive Summary – Chart on Incremental Growth
- Exhibit 08: Executive Summary – Data Table on Incremental Growth
- Exhibit 09: Executive Summary – Chart on Vendor Market Positioning
2 Market Landscape
- 2.1 Market ecosystem
- Exhibit 10: Parent market
- Exhibit 11: Market Characteristics
3 Market Sizing
- 3.1 Market definition
- Exhibit 12: Offerings of vendors included in the market definition
- 3.2 Market segment analysis
- Exhibit 13: Market segments
- 3.3 Market size 2021
- 3.4 Market outlook: Forecast for 2021-2026
- Exhibit 14: Chart on Global - Market size and forecast 2021-2026 ($ billion)
- Exhibit 15: Data Table on Global - Market size and forecast 2021-2026 ($ billion)
- Exhibit 16: Chart on Global Market: Year-over-year growth 2021-2026 (%)
- Exhibit 17: Data Table on Global Market: Year-over-year growth 2021-2026 (%)
4 Five Forces Analysis
- 4.1 Five forces summary
- Exhibit 18: Five forces analysis - Comparison between2021 and 2026
- 4.2 Bargaining power of buyers
- Exhibit 19: Chart on Bargaining power of buyers – Impact of key factors 2021 and 2026
- 4.3 Bargaining power of suppliers
- Exhibit 20: Bargaining power of suppliers – Impact of key factors in 2021 and 2026
- 4.4 Threat of new entrants
- Exhibit 21: Threat of new entrants – Impact of key factors in 2021 and 2026
- 4.5 Threat of substitutes
- Exhibit 22: Threat of substitutes – Impact of key factors in 2021 and 2026
- 4.6 Threat of rivalry
- Exhibit 23: Threat of rivalry – Impact of key factors in 2021 and 2026
- 4.7 Market condition
- Exhibit 24: Chart on Market condition - Five forces 2021 and 2026
5 Market Segmentation by Type
- 5.1 Market segments
- Exhibit 25: Chart on Type - Market share 2021-2026 (%)
- Exhibit 26: Data Table on Type - Market share 2021-2026 (%)
- 5.2 Comparison by Type
- Exhibit 27: Chart on Comparison by Type
- Exhibit 28: Data Table on Comparison by Type
- 5.3 Domestic adventure tourism - Market size and forecast 2021-2026
- Exhibit 29: Chart on Domestic adventure tourism - Market size and forecast 2021-2026 ($ billion)
- Exhibit 30: Data Table on Domestic adventure tourism - Market size and forecast 2021-2026 ($ billion)
- Exhibit 31: Chart on Domestic adventure tourism - Year-over-year growth 2021-2026 (%)
- Exhibit 32: Data Table on Domestic adventure tourism - Year-over-year growth 2021-2026 (%)
- 5.4 International adventure tourism - Market size and forecast 2021-2026
- Exhibit 33: Chart on International adventure tourism - Market size and forecast 2021-2026 ($ billion)
- Exhibit 34: Data Table on International adventure tourism - Market size and forecast 2021-2026 ($ billion)
- Exhibit 35: Chart on International adventure tourism - Year-over-year growth 2021-2026 (%)
- Exhibit 36: Data Table on International adventure tourism - Year-over-year growth 2021-2026 (%)
- 5.5 Market opportunity by Type
- Exhibit 37: Market opportunity by Type ($ billion)
6 Market Segmentation by Source
- 6.1 Market segments
- Exhibit 38: Chart on Source - Market share 2021-2026 (%)
- Exhibit 39: Data Table on Source - Market share 2021-2026 (%)
- 6.2 Comparison by Source
- Exhibit 40: Chart on Comparison by Source
- Exhibit 41: Data Table on Comparison by Source
- 6.3 Indirect contribution - Market size and forecast 2021-2026
- Exhibit 42: Chart on Indirect contribution - Market size and forecast 2021-2026 ($ billion)
- Exhibit 43: Data Table on Indirect contribution - Market size and forecast 2021-2026 ($ billion)
- Exhibit 44: Chart on Indirect contribution - Year-over-year growth 2021-2026 (%)
- Exhibit 45: Data Table on Indirect contribution - Year-over-year growth 2021-2026 (%)
- 6.4 Direct contribution - Market size and forecast 2021-2026
- Exhibit 46: Chart on Direct contribution - Market size and forecast 2021-2026 ($ billion)
- Exhibit 47: Data Table on Direct contribution - Market size and forecast 2021-2026 ($ billion)
- Exhibit 48: Chart on Direct contribution - Year-over-year growth 2021-2026 (%)
- Exhibit 49: Data Table on Direct contribution - Year-over-year growth 2021-2026 (%)
- 6.5 Induced contribution - Market size and forecast 2021-2026
- Exhibit 50: Chart on Induced contribution - Market size and forecast 2021-2026 ($ billion)
- Exhibit 51: Data Table on Induced contribution - Market size and forecast 2021-2026 ($ billion)
- Exhibit 52: Chart on Induced contribution - Year-over-year growth 2021-2026 (%)
- Exhibit 53: Data Table on Induced contribution - Year-over-year growth 2021-2026 (%)
- 6.6 Market opportunity by Source
- Exhibit 54: Market opportunity by Source ($ billion)
7 Customer Landscape
- 7.1 Customer landscape overview
- Exhibit 55: Analysis of price sensitivity, lifecycle, customer purchase basket, adoption rates, and purchase criteria
8 Geographic Landscape
- 8.1 Geographic segmentation
- Exhibit 56: Chart on Market share by geography 2021-2026 (%)
- Exhibit 57: Data Table on Market share by geography 2021-2026 (%)
- 8.2 Geographic comparison
- Exhibit 58: Chart on Geographic comparison
- Exhibit 59: Data Table on Geographic comparison
- 8.3 Europe - Market size and forecast 2021-2026
- Exhibit 60: Chart on Europe - Market size and forecast 2021-2026 ($ billion)
- Exhibit 61: Data Table on Europe - Market size and forecast 2021-2026 ($ billion)
- Exhibit 62: Chart on Europe - Year-over-year growth 2021-2026 (%)
- Exhibit 63: Data Table on Europe - Year-over-year growth 2021-2026 (%)
- 8.4 APAC - Market size and forecast 2021-2026
- Exhibit 64: Chart on APAC - Market size and forecast 2021-2026 ($ billion)
- Exhibit 65: Data Table on APAC - Market size and forecast 2021-2026 ($ billion)
- Exhibit 66: Chart on APAC - Year-over-year growth 2021-2026 (%)
- Exhibit 67: Data Table on APAC - Year-over-year growth 2021-2026 (%)
- 8.5 North America - Market size and forecast 2021-2026
- Exhibit 68: Chart on North America - Market size and forecast 2021-2026 ($ billion)
- Exhibit 69: Data Table on North America - Market size and forecast 2021-2026 ($ billion)
- Exhibit 70: Chart on North America - Year-over-year growth 2021-2026 (%)
- Exhibit 71: Data Table on North America - Year-over-year growth 2021-2026 (%)
- 8.6 South America - Market size and forecast 2021-2026
- Exhibit 72: Chart on South America - Market size and forecast 2021-2026 ($ billion)
- Exhibit 73: Data Table on South America - Market size and forecast 2021-2026 ($ billion)
- Exhibit 74: Chart on South America - Year-over-year growth 2021-2026 (%)
- Exhibit 75: Data Table on South America - Year-over-year growth 2021-2026 (%)
- 8.7 Middle East and Africa - Market size and forecast 2021-2026
- Exhibit 76: Chart on Middle East and Africa - Market size and forecast 2021-2026 ($ billion)
- Exhibit 77: Data Table on Middle East and Africa - Market size and forecast 2021-2026 ($ billion)
- Exhibit 78: Chart on Middle East and Africa - Year-over-year growth 2021-2026 (%)
- Exhibit 79: Data Table on Middle East and Africa - Year-over-year growth 2021-2026 (%)
- 8.8 US - Market size and forecast 2021-2026
- Exhibit 80: Chart on US - Market size and forecast 2021-2026 ($ billion)
- Exhibit 81: Data Table on US - Market size and forecast 2021-2026 ($ billion)
- Exhibit 82: Chart on US - Year-over-year growth 2021-2026 (%)
- Exhibit 83: Data Table on US - Year-over-year growth 2021-2026 (%)
- 8.9 China - Market size and forecast 2021-2026
- Exhibit 84: Chart on China - Market size and forecast 2021-2026 ($ billion)
- Exhibit 85: Data Table on China - Market size and forecast 2021-2026 ($ billion)
- Exhibit 86: Chart on China - Year-over-year growth 2021-2026 (%)
- Exhibit 87: Data Table on China - Year-over-year growth 2021-2026 (%)
- 8.10 Germany - Market size and forecast 2021-2026
- Exhibit 88: Chart on Germany - Market size and forecast 2021-2026 ($ billion)
- Exhibit 89: Data Table on Germany - Market size and forecast 2021-2026 ($ billion)
- Exhibit 90: Chart on Germany - Year-over-year growth 2021-2026 (%)
- Exhibit 91: Data Table on Germany - Year-over-year growth 2021-2026 (%)
- 8.11 Italy - Market size and forecast 2021-2026
- Exhibit 92: Chart on Italy - Market size and forecast 2021-2026 ($ billion)
- Exhibit 93: Data Table on Italy - Market size and forecast 2021-2026 ($ billion)
- Exhibit 94: Chart on Italy - Year-over-year growth 2021-2026 (%)
- Exhibit 95: Data Table on Italy - Year-over-year growth 2021-2026 (%)
- 8.12 Japan - Market size and forecast 2021-2026
- Exhibit 96: Chart on Japan - Market size and forecast 2021-2026 ($ billion)
- Exhibit 97: Data Table on Japan - Market size and forecast 2021-2026 ($ billion)
- Exhibit 98: Chart on Japan - Year-over-year growth 2021-2026 (%)
- Exhibit 99: Data Table on Japan - Year-over-year growth 2021-2026 (%)
- 8.13 Market opportunity by geography
- Exhibit 100: Market opportunity by geography ($ billion)
9 Drivers, Challenges, and Trends
- 9.1 Market drivers
- 9.2 Market challenges
- 9.3 Impact of drivers and challenges
- Exhibit 101: Impact of drivers and challenges in 2021 and 2026
- 9.4 Market trends
10 Vendor Landscape
- 10.1 Overview
- 10.2 Vendor landscape
- Exhibit 102: Overview on Criticality of inputs and Factors of differentiation
- 10.3 Landscape disruption
- Exhibit 103: Overview on factors of disruption
- 10.4 Industry risks
- Exhibit 104: Impact of key risks on business
11 Vendor Analysis
- 11.1 Vendors covered
- Exhibit 105: Vendors covered
- 11.2 Market positioning of vendors
- Exhibit 106: Matrix on vendor position and classification
- 11.3 Abercrombie and Kent USA LLC
- Exhibit 107: Abercrombie and Kent USA LLC - Overview
- Exhibit 108: Abercrombie and Kent USA LLC - Product / Service
- Exhibit 109: Abercrombie and Kent USA LLC - Key offerings
- 11.4 Austin Adventures
- Exhibit 110: Austin Adventures - Overview
- Exhibit 111: Austin Adventures - Product / Service
- Exhibit 112: Austin Adventures - Key offerings
- 11.5 Butterfield and Robinson Inc.
- Exhibit 113: Butterfield and Robinson Inc. - Overview
- Exhibit 114: Butterfield and Robinson Inc. - Product / Service
- Exhibit 115: Butterfield and Robinson Inc. - Key offerings
- 11.6 G Adventures
- Exhibit 116: G Adventures - Overview
- Exhibit 117: G Adventures - Product / Service
- Exhibit 118: G Adventures - Key offerings
- 11.7 Intrepid Group
- Exhibit 119: Intrepid Group - Overview
- Exhibit 120: Intrepid Group - Product / Service
- Exhibit 121: Intrepid Group - Key offerings
- 11.8 Lindblad Expeditions Holdings Inc.
- Exhibit 122: Lindblad Expeditions Holdings Inc. - Overview
- Exhibit 123: Lindblad Expeditions Holdings Inc. - Business segments
- Exhibit 124: Lindblad Expeditions Holdings Inc. - Key offerings
- Exhibit 125: Lindblad Expeditions Holdings Inc. - Segment focus
- 11.9 MT Sobek
- Exhibit 126: MT Sobek - Overview
- Exhibit 127: MT Sobek - Product / Service
- Exhibit 128: MT Sobek - Key offerings
- 11.10 Recreational Equipment Inc.
- Exhibit 129: Recreational Equipment Inc. - Overview
- Exhibit 130: Recreational Equipment Inc. - Product / Service
- Exhibit 131: Recreational Equipment Inc. - Key offerings
- 11.11 The Walt Disney Co.
- Exhibit 132: The Walt Disney Co. - Overview
- Exhibit 133: The Walt Disney Co. - Business segments
- Exhibit 134: The Walt Disney Co. - Key offerings
- Exhibit 135: The Walt Disney Co. - Segment focus
- 11.12 TUI AG
- Exhibit 136: TUI AG - Overview
- Exhibit 137: TUI AG - Business segments
- Exhibit 138: TUI AG - Key offerings
- Exhibit 139: TUI AG - Segment focus
12 Appendix
- 12.1 Scope of the report
- 12.2 Inclusions and exclusions checklist
- Exhibit 140: Inclusions checklist
- Exhibit 141: Exclusions checklist
- 12.3 Currency conversion rates for US$
- Exhibit 142: Currency conversion rates for US$
- 12.4 Research methodology
- Exhibit 143: Research methodology
- Exhibit 144: Validation techniques employed for market sizing
- Exhibit 145: Information sources
- 12.5 List of abbreviations
- Exhibit 146: List of abbreviations
Technavio is a leading global technology research and advisory company. Their research and analysis focus on emerging market trends and provide actionable insights to help businesses identify market opportunities and develop effective strategies to optimize their market positions.
With over 500 specialized analysts, Technavio's report library consists of more than 17,000 reports and counting, covering 800 technologies, spanning across 50 countries. Their client base consists of enterprises of all sizes, including more than 100 Fortune 500 companies. This growing client base relies on Technavio's comprehensive coverage, extensive research, and actionable market insights to identify opportunities in existing and potential markets and assess their competitive positions within changing market scenarios.
Technavio Research
Jesse Maida
Media & Marketing Executive
US: +1 844 364 1100
UK: +44 203 893 3200
Email: media@technavio.com
Website: www.technavio.com/


SOURCE Technavio
© 2024 Benzinga.com. Benzinga does not provide investment advice. All rights reserved.
Trade confidently with insights and alerts from analyst ratings, free reports and breaking news that affects the stocks you care about.

