


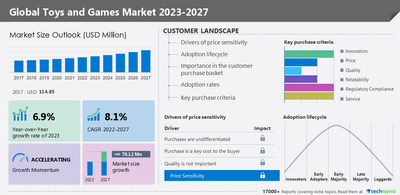
NEW YORK, Nov. 8, 2022 /PRNewswire/ -- Technavio categorizes the global toys and games market as a part of the parent leisure products market, covering a variety of categories, including musical instruments, sports equipment, recreational vehicles, camping equipment, toys, bicycles, and other consumer-oriented games. Our research report has extensively covered external factors influencing the parent market growth during the forecast period. The Global Toys and Games Market share is set to increase by USD 70.12 million from 2022 to 2027. Moreover, the market's growth momentum will accelerate at a CAGR of 8.1% as per the latest market forecast report by Technavio. The market will also record a 6.9% Y-O-Y growth rate during the forecast period.

To know more about the historic market size – Request a Free Sample Report!
Our report analyzes the Life Cycle of the Global Toys and Games Market from the innovator's stage to the laggard's stage. The report illustrates the lifecycle of the global toys and games market, focusing on the adoption rates of the major countries such as the US, China, India, Germany, and the UK. To help companies evaluate and develop growth strategies for 2022-2027. Our researchers have included –
- Key purchase criteria
- Adoption rates
- Adoption lifecycles
- Drivers of price sensitivity
- To unlock the detailed information on the customer landscape - Request a FREE Sample Now!
Vendor Landscape - The global toys and games market is fragmented. The market is expected to fragment further during the forecast period. Vendors follow some criticality of inputs to compete in the market, including labor, CAPEX, and research and development (R&D). They invest significantly in building infrastructure suitable for manufacturing toys and games and focus on building brand and brand equity to differentiate themselves. Manufacturers strategize their product advertisements to attract consumers by highlighting the features of newly launched products, which helps manufacturers gain a competitive advantage. Vendors differentiate themselves based on regulatory compliance, quality, and innovation and offer products with various features and applications. The price differentiation among these vendors is low due to similar product offerings and growing competition. Some of the key vendors in this market include 4M Industrial Development Ltd., Atlas Games, Clementoni Spa, Elenco Electronics Inc., and Franckh Kosmos Verlags GmbH & Co. KG.
To know about all 15 major vendor offerings – Download a FREE sample Now!
Technavio's market research report entails detailed information on regional opportunities in store for vendors, which will assist in generating sales revenues. The Global Toys and Games Market as per geography is categorized into North America, Europe, APAC, South America, and the Middle East and Africa. The report provides an accurate prediction of the contribution of all regions to the growth of the Global Toys and Games Market size and actionable market understanding.
- Regional Highlights - North America is the fastest-growing region in the global toys and games market compared to other regions. 31% of the market's growth will originate from North America. The demand for traditional toys and games is expected to increase during the forecast period owing to numerous licensing opportunities in the US. Consumers are shifting their focus toward scientific and educational toys, which is increasing the demand for premium toys.
- Revenue Generating Segment Highlights - The Global Toys and Games Market as per product segmentation is categorized into Activity and Ride-on Toys, Infant and Preschool Toys, Games and Puzzles, Plush Toys, and Others. The toys and games market share growth by the activity and ride-on toys segment will be significant during the forecast period. These toys mainly include sport, outdoor, and model vehicle toys. Ride-on toys help in improving the mobility of infants. The advantages of such toys are driving the growth of this segment.
Download a FREE Sample Report that can help you to strategize your sales revenue - Get it now!
- Major Driver - The growth of the middle-class population and the increasing disposable incomes are driving market growth. The rising disposable income has led to an increase in consumer purchasing power and living standards, particularly in developing countries such as India and China.
- Major Trend - The emergence of three-dimensional (3D) printing is a trend in the market. 3D printers are expected to become more affordable over the coming years. Many players are introducing 3D printing tools for building and modifying toys at home. Such innovations will propel the growth of the market during the forecast period.
- Major Challenges - The seasonal demand and the short life of merchandise and collectibles may challenge market growth. The demand for these products does not remain fixed and is subject to changing consumer needs. Hence, merchandise purchasing becomes very challenging.
To know about other factors of market dynamics – Request a Free Sample!
Register for a free trial today and gain instant access to 17,000+ market research reports.
Technavio's SUBSCRIPTION platform
- CAGR of the market during the forecast period 2023-2027
- Detailed information on factors that will assist the toys and games market growth during the next five years
- Estimation of the toys and games market size and its contribution to the parent market
- Predictions on upcoming trends and changes in consumer behavior
- The growth of the toys and games market
- Analysis of the market's competitive landscape and detailed information on vendors
- Comprehensive details of factors that will challenge the growth of the toys and games market vendors
- The construction toys market is projected to grow by USD 1.23 billion with a CAGR of 2.79% during the forecast period 2021 to 2026. The market is segmented by distribution channel (offline and online) and geography (APAC, North America, Europe, South America, and Middle East and Africa).
- The smart toys market is projected to grow by USD 4.27 billion during the forecast period 2021 to 2026. The market is segmented by technology (Wi-Fi, Bluetooth, and others), distribution channel (offline and online), and geography (North America, Europe, APAC, Middle East and Africa, and South America).
Toys And Games Market Scope | |
Report Coverage | Details |
Page number | 120 |
Base year | 2022 |
Historical year | 2017-2021 |
Forecast period | 2023-2027 |
Growth momentum & CAGR | Accelerate at a CAGR of 8.1% |
Market growth 2023-2027 | USD 70.12 million |
Market structure | Fragmented |
YoY growth (%) | 6.9 |
Regional analysis | North America, Europe, APAC, South America, and the Middle East and Africa |
Performing market contribution | North America at 31% |
Key consumer countries | US, China, India, Germany, and UK |
Competitive landscape | Leading companies, competitive strategies, consumer engagement scope |
Key companies profiled | 4M Industrial Development Ltd., Atlas Games, Clementoni Spa, Elenco Electronics Inc., Franckh Kosmos Verlags GmbH & Co. KG, Goliath Games LLC, Hasbro Inc., JAKKS Pacific Inc., Kids2 Inc., Learning Resources Ltd., LEGO System AS, Mattel Inc., MGA Entertainment Inc., Playmates Holdings Ltd., Ravensburger AG, Simba Dickie Group GmbH, Smartivity Labs Pvt. Ltd., Spin Master Corp., TOMY Co. Ltd., and VTech Holdings Ltd. |
Market Dynamics | Parent market analysis, market growth inducers and obstacles, fast-growing and slow-growing segment analysis, COVID-19 impact and recovery analysis and future consumer dynamics, and market condition analysis for the forecast period. |
Customization purview | If our report has not included the data that you are looking for, you can reach out to our analysts and get segments customized. |
Browse Consumer Discretionary Market Reports
1 Executive Summary
- 1.1 Market overview
- Exhibit 01: Executive Summary – Chart on Market Overview
- Exhibit 02: Executive Summary – Data Table on Market Overview
- Exhibit 03: Executive Summary – Chart on Global Market Characteristics
- Exhibit 04: Executive Summary – Chart on Market by Geography
- Exhibit 05: Executive Summary – Chart on Market Segmentation by Product
- Exhibit 06: Executive Summary – Chart on Market Segmentation by Distribution Channel
- Exhibit 07: Executive Summary – Chart on Incremental Growth
- Exhibit 08: Executive Summary – Data Table on Incremental Growth
- Exhibit 09: Executive Summary – Chart on Vendor Market Positioning
2 Market Landscape
- 2.1 Market ecosystem
- Exhibit 10: Parent market
- Exhibit 11: Market Characteristics
3 Market Sizing
- 3.1 Market definition
- Exhibit 12: Offerings of vendors included in the market definition
- 3.2 Market segment analysis
- Exhibit 13: Market segments
- 3.3 Market size 2022
- 3.4 Market outlook: Forecast for 2022-2027
- Exhibit 14: Chart on Global - Market size and forecast 2022-2027 ($ million)
- Exhibit 15: Data Table on Global - Market size and forecast 2022-2027 ($ million)
- Exhibit 16: Chart on Global Market: Year-over-year growth 2022-2027 (%)
- Exhibit 17: Data Table on Global Market: Year-over-year growth 2022-2027 (%)
4 Historic Market Size
- 4.1 Global toys and games market 2017 - 2021
- Exhibit 18: Historic Market Size – Data Table on Global toys and games market 2017 - 2021 ($ million)
- 4.2 Product Segment Analysis 2017 - 2021
- Exhibit 19: Historic Market Size – Product Segment 2017 - 2021 ($ million)
- 4.3 Distribution channel Segment Analysis 2017 - 2021
- Exhibit 20: Historic Market Size – Distribution channel Segment 2017 - 2021 ($ million)
- 4.4 Geography Segment Analysis 2017 - 2021
- Exhibit 21: Historic Market Size – Geography Segment 2017 - 2021 ($ million)
- 4.5 Country Segment Analysis 2017 - 2021
- Exhibit 22: Historic Market Size – Country Segment 2017 - 2021 ($ million)
5 Five Forces Analysis
- 5.1 Five forces summary
- Exhibit 23: Five forces analysis - Comparison between2022 and 2027
- 5.2 Bargaining power of buyers
- Exhibit 24: Chart on Bargaining power of buyers – Impact of key factors 2022 and 2027
- 5.3 Bargaining power of suppliers
- Exhibit 25: Bargaining power of suppliers – Impact of key factors in 2022 and 2027
- 5.4 Threat of new entrants
- Exhibit 26: Threat of new entrants – Impact of key factors in 2022 and 2027
- 5.5 Threat of substitutes
- Exhibit 27: Threat of substitutes – Impact of key factors in 2022 and 2027
- 5.6 Threat of rivalry
- Exhibit 28: Threat of rivalry – Impact of key factors in 2022 and 2027
- 5.7 Market condition
- Exhibit 29: Chart on Market condition - Five forces 2022 and 2027
6 Market Segmentation by Product
- 6.1 Market segments
- Exhibit 30: Chart on Product - Market share 2022-2027 (%)
- Exhibit 31: Data Table on Product - Market share 2022-2027 (%)
- 6.2 Comparison by Product
- Exhibit 32: Chart on Comparison by Product
- Exhibit 33: Data Table on Comparison by Product
- 6.3 Activity and ride-on toys - Market size and forecast 2022-2027
- Exhibit 34: Chart on Activity and ride-on toys - Market size and forecast 2022-2027 ($ million)
- Exhibit 35: Data Table on Activity and ride-on toys - Market size and forecast 2022-2027 ($ million)
- Exhibit 36: Chart on Activity and ride-on toys - Year-over-year growth 2022-2027 (%)
- Exhibit 37: Data Table on Activity and ride-on toys - Year-over-year growth 2022-2027 (%)
- 6.4 Infant and pre-school toys - Market size and forecast 2022-2027
- Exhibit 38: Chart on Infant and pre-school toys - Market size and forecast 2022-2027 ($ million)
- Exhibit 39: Data Table on Infant and pre-school toys - Market size and forecast 2022-2027 ($ million)
- Exhibit 40: Chart on Infant and pre-school toys - Year-over-year growth 2022-2027 (%)
- Exhibit 41: Data Table on Infant and pre-school toys - Year-over-year growth 2022-2027 (%)
- 6.5 Games and puzzles - Market size and forecast 2022-2027
- Exhibit 42: Chart on Games and puzzles - Market size and forecast 2022-2027 ($ million)
- Exhibit 43: Data Table on Games and puzzles - Market size and forecast 2022-2027 ($ million)
- Exhibit 44: Chart on Games and puzzles - Year-over-year growth 2022-2027 (%)
- Exhibit 45: Data Table on Games and puzzles - Year-over-year growth 2022-2027 (%)
- 6.6 Plush toys - Market size and forecast 2022-2027
- Exhibit 46: Chart on Plush toys - Market size and forecast 2022-2027 ($ million)
- Exhibit 47: Data Table on Plush toys - Market size and forecast 2022-2027 ($ million)
- Exhibit 48: Chart on Plush toys - Year-over-year growth 2022-2027 (%)
- Exhibit 49: Data Table on Plush toys - Year-over-year growth 2022-2027 (%)
- 6.7 Others - Market size and forecast 2022-2027
- Exhibit 50: Chart on Others - Market size and forecast 2022-2027 ($ million)
- Exhibit 51: Data Table on Others - Market size and forecast 2022-2027 ($ million)
- Exhibit 52: Chart on Others - Year-over-year growth 2022-2027 (%)
- Exhibit 53: Data Table on Others - Year-over-year growth 2022-2027 (%)
- 6.8 Market opportunity by Product
- Exhibit 54: Market opportunity by Product ($ million)
7 Market Segmentation by Distribution Channel
- 7.1 Market segments
- Exhibit 55: Chart on Distribution Channel - Market share 2022-2027 (%)
- Exhibit 56: Data Table on Distribution Channel - Market share 2022-2027 (%)
- 7.2 Comparison by Distribution Channel
- Exhibit 57: Chart on Comparison by Distribution Channel
- Exhibit 58: Data Table on Comparison by Distribution Channel
- 7.3 Offline - Market size and forecast 2022-2027
- Exhibit 59: Chart on Offline - Market size and forecast 2022-2027 ($ million)
- Exhibit 60: Data Table on Offline - Market size and forecast 2022-2027 ($ million)
- Exhibit 61: Chart on Offline - Year-over-year growth 2022-2027 (%)
- Exhibit 62: Data Table on Offline - Year-over-year growth 2022-2027 (%)
- 7.4 Online - Market size and forecast 2022-2027
- Exhibit 63: Chart on Online - Market size and forecast 2022-2027 ($ million)
- Exhibit 64: Data Table on Online - Market size and forecast 2022-2027 ($ million)
- Exhibit 65: Chart on Online - Year-over-year growth 2022-2027 (%)
- Exhibit 66: Data Table on Online - Year-over-year growth 2022-2027 (%)
- 7.5 Market opportunity by Distribution Channel
- Exhibit 67: Market opportunity by Distribution Channel ($ million)
8 Customer Landscape
- 8.1 Customer landscape overview
- Exhibit 68: Analysis of price sensitivity, lifecycle, customer purchase basket, adoption rates, and purchase criteria
9 Geographic Landscape
- 9.1 Geographic segmentation
- Exhibit 69: Chart on Market share by geography 2022-2027 (%)
- Exhibit 70: Data Table on Market share by geography 2022-2027 (%)
- 9.2 Geographic comparison
- Exhibit 71: Chart on Geographic comparison
- Exhibit 72: Data Table on Geographic comparison
- 9.3 North America - Market size and forecast 2022-2027
- Exhibit 73: Chart on North America - Market size and forecast 2022-2027 ($ million)
- Exhibit 74: Data Table on North America - Market size and forecast 2022-2027 ($ million)
- Exhibit 75: Chart on North America - Year-over-year growth 2022-2027 (%)
- Exhibit 76: Data Table on North America - Year-over-year growth 2022-2027 (%)
- 9.4 Europe - Market size and forecast 2022-2027
- Exhibit 77: Chart on Europe - Market size and forecast 2022-2027 ($ million)
- Exhibit 78: Data Table on Europe - Market size and forecast 2022-2027 ($ million)
- Exhibit 79: Chart on Europe - Year-over-year growth 2022-2027 (%)
- Exhibit 80: Data Table on Europe - Year-over-year growth 2022-2027 (%)
- 9.5 APAC - Market size and forecast 2022-2027
- Exhibit 81: Chart on APAC - Market size and forecast 2022-2027 ($ million)
- Exhibit 82: Data Table on APAC - Market size and forecast 2022-2027 ($ million)
- Exhibit 83: Chart on APAC - Year-over-year growth 2022-2027 (%)
- Exhibit 84: Data Table on APAC - Year-over-year growth 2022-2027 (%)
- 9.6 South America - Market size and forecast 2022-2027
- Exhibit 85: Chart on South America - Market size and forecast 2022-2027 ($ million)
- Exhibit 86: Data Table on South America - Market size and forecast 2022-2027 ($ million)
- Exhibit 87: Chart on South America - Year-over-year growth 2022-2027 (%)
- Exhibit 88: Data Table on South America - Year-over-year growth 2022-2027 (%)
- 9.7 Middle East and Africa - Market size and forecast 2022-2027
- Exhibit 89: Chart on Middle East and Africa - Market size and forecast 2022-2027 ($ million)
- Exhibit 90: Data Table on Middle East and Africa - Market size and forecast 2022-2027 ($ million)
- Exhibit 91: Chart on Middle East and Africa - Year-over-year growth 2022-2027 (%)
- Exhibit 92: Data Table on Middle East and Africa - Year-over-year growth 2022-2027 (%)
- 9.8 US - Market size and forecast 2022-2027
- Exhibit 93: Chart on US - Market size and forecast 2022-2027 ($ million)
- Exhibit 94: Data Table on US - Market size and forecast 2022-2027 ($ million)
- Exhibit 95: Chart on US - Year-over-year growth 2022-2027 (%)
- Exhibit 96: Data Table on US - Year-over-year growth 2022-2027 (%)
- 9.9 Germany - Market size and forecast 2022-2027
- Exhibit 97: Chart on Germany - Market size and forecast 2022-2027 ($ million)
- Exhibit 98: Data Table on Germany - Market size and forecast 2022-2027 ($ million)
- Exhibit 99: Chart on Germany - Year-over-year growth 2022-2027 (%)
- Exhibit 100: Data Table on Germany - Year-over-year growth 2022-2027 (%)
- 9.10 China - Market size and forecast 2022-2027
- Exhibit 101: Chart on China - Market size and forecast 2022-2027 ($ million)
- Exhibit 102: Data Table on China - Market size and forecast 2022-2027 ($ million)
- Exhibit 103: Chart on China - Year-over-year growth 2022-2027 (%)
- Exhibit 104: Data Table on China - Year-over-year growth 2022-2027 (%)
- 9.11 UK - Market size and forecast 2022-2027
- Exhibit 105: Chart on UK - Market size and forecast 2022-2027 ($ million)
- Exhibit 106: Data Table on UK - Market size and forecast 2022-2027 ($ million)
- Exhibit 107: Chart on UK - Year-over-year growth 2022-2027 (%)
- Exhibit 108: Data Table on UK - Year-over-year growth 2022-2027 (%)
- 9.12 India - Market size and forecast 2022-2027
- Exhibit 109: Chart on India - Market size and forecast 2022-2027 ($ million)
- Exhibit 110: Data Table on India - Market size and forecast 2022-2027 ($ million)
- Exhibit 111: Chart on India - Year-over-year growth 2022-2027 (%)
- Exhibit 112: Data Table on India - Year-over-year growth 2022-2027 (%)
- 9.13 Market opportunity by geography
- Exhibit 113: Market opportunity by geography ($ million)
10 Drivers, Challenges, and Trends
- 10.1 Market drivers
- 10.2 Market challenges
- 10.3 Impact of drivers and challenges
- Exhibit 114: Impact of drivers and challenges in 2022 and 2027
- 10.4 Market trends
11 Vendor Landscape
- 11.1 Overview
- 11.2 Vendor landscape
- Exhibit 115: Overview on Criticality of inputs and Factors of differentiation
- 11.3 Landscape disruption
- Exhibit 116: Overview on factors of disruption
- 11.4 Industry risks
- Exhibit 117: Impact of key risks on business
12 Vendor Analysis
- 12.1 Vendors covered
- Exhibit 118: Vendors covered
- 12.2 Market positioning of vendors
- Exhibit 119: Matrix on vendor position and classification
- 12.3 4M Industrial Development Ltd.
- Exhibit 120: 4M Industrial Development Ltd. - Overview
- Exhibit 121: 4M Industrial Development Ltd. - Product / Service
- Exhibit 122: 4M Industrial Development Ltd. - Key offerings
- 12.4 Atlas Games
- Exhibit 123: Atlas Games - Overview
- Exhibit 124: Atlas Games - Product / Service
- Exhibit 125: Atlas Games - Key offerings
- 12.5 Clementoni Spa
- Exhibit 126: Clementoni Spa - Overview
- Exhibit 127: Clementoni Spa - Product / Service
- Exhibit 128: Clementoni Spa - Key offerings
- 12.6 Franckh Kosmos Verlags GmbH and Co. KG
- Exhibit 129: Franckh Kosmos Verlags GmbH and Co. KG - Overview
- Exhibit 130: Franckh Kosmos Verlags GmbH and Co. KG - Product / Service
- Exhibit 131: Franckh Kosmos Verlags GmbH and Co. KG - Key offerings
- 12.7 Goliath Games LLC
- Exhibit 132: Goliath Games LLC - Overview
- Exhibit 133: Goliath Games LLC - Product / Service
- Exhibit 134: Goliath Games LLC - Key offerings
- 12.8 Hasbro Inc.
- Exhibit 135: Hasbro Inc. - Overview
- Exhibit 136: Hasbro Inc. - Business segments
- Exhibit 137: Hasbro Inc. - Key news
- Exhibit 138: Hasbro Inc. - Key offerings
- Exhibit 139: Hasbro Inc. - Segment focus
- 12.9 JAKKS Pacific Inc.
- Exhibit 140: JAKKS Pacific Inc. - Overview
- Exhibit 141: JAKKS Pacific Inc. - Business segments
- Exhibit 142: JAKKS Pacific Inc. - Key offerings
- Exhibit 143: JAKKS Pacific Inc. - Segment focus
- 12.10 Kids2 Inc.
- Exhibit 144: Kids2 Inc. - Overview
- Exhibit 145: Kids2 Inc. - Product / Service
- Exhibit 146: Kids2 Inc. - Key offerings
- 12.11 LEGO System AS
- Exhibit 147: LEGO System AS - Overview
- Exhibit 148: LEGO System AS - Product / Service
- Exhibit 149: LEGO System AS - Key news
- Exhibit 150: LEGO System AS - Key offerings
- 12.12 Mattel Inc.
- Exhibit 151: Mattel Inc. - Overview
- Exhibit 152: Mattel Inc. - Business segments
- Exhibit 153: Mattel Inc. - Key news
- Exhibit 154: Mattel Inc. - Key offerings
- Exhibit 155: Mattel Inc. - Segment focus
- 12.13 MGA Entertainment Inc.
- Exhibit 156: MGA Entertainment Inc. - Overview
- Exhibit 157: MGA Entertainment Inc. - Product / Service
- Exhibit 158: MGA Entertainment Inc. - Key offerings
- 12.14 Playmates Holdings Ltd.
- Exhibit 159: Playmates Holdings Ltd. - Overview
- Exhibit 160: Playmates Holdings Ltd. - Business segments
- Exhibit 161: Playmates Holdings Ltd. - Key offerings
- Exhibit 162: Playmates Holdings Ltd. - Segment focus
- 12.15 Ravensburger AG
- Exhibit 163: Ravensburger AG - Overview
- Exhibit 164: Ravensburger AG - Product / Service
- Exhibit 165: Ravensburger AG - Key offerings
- 12.16 TOMY Co. Ltd.
- Exhibit 166: TOMY Co. Ltd. - Overview
- Exhibit 167: TOMY Co. Ltd. - Business segments
- Exhibit 168: TOMY Co. Ltd. - Key offerings
- Exhibit 169: TOMY Co. Ltd. - Segment focus
- 12.17 VTech Holdings Ltd.
- Exhibit 170: VTech Holdings Ltd. - Overview
- Exhibit 171: VTech Holdings Ltd. - Business segments
- Exhibit 172: VTech Holdings Ltd. - Key offerings
- Exhibit 173: VTech Holdings Ltd. - Segment focus
13 Appendix
- 13.1 Scope of the report
- 13.2 Inclusions and exclusions checklist
- Exhibit 174: Inclusions checklist
- Exhibit 175: Exclusions checklist
- 13.3 Currency conversion rates for US$
- Exhibit 176: Currency conversion rates for US$
- 13.4 Research methodology
- Exhibit 177: Research methodology
- Exhibit 178: Validation techniques employed for market sizing
- Exhibit 179: Information sources
- 13.5 List of abbreviations
- Exhibit 180: List of abbreviations
Technavio is a leading global technology research and advisory company. Their research and analysis focus on emerging market trends and provide actionable insights to help businesses identify market opportunities and develop effective strategies to optimize their market positions. With over 500 specialized analysts, Technavio's report library consists of more than 17,000 reports and counting, covering 800 technologies, spanning 50 countries. Their client base consists of enterprises of all sizes, including more than 100 Fortune 500 companies. This growing client base relies on Technavio's comprehensive coverage, extensive research, and actionable market insights to identify opportunities in existing and potential markets and assess their competitive positions within changing market scenarios.
Contact
Technavio Research
Jesse Maida
Media & Marketing Executive
US: +1 844 364 1100
UK: +44 203 893 3200
Email: media@technavio.com
Website: www.technavio.com/


SOURCE Technavio
© 2024 Benzinga.com. Benzinga does not provide investment advice. All rights reserved.
Trade confidently with insights and alerts from analyst ratings, free reports and breaking news that affects the stocks you care about.

