


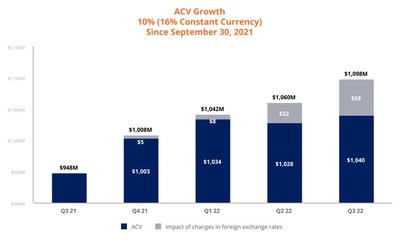
- Annual contract value (ACV) grows 16 percent in constant currency year over year
- Pega Cloud ACV grows 39 percent in constant currency year over year
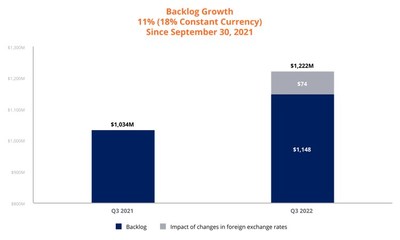
- Total backlog grows 11 percent (18 percent in constant currency) year over year
CAMBRIDGE, Mass., Oct. 26, 2022 /PRNewswire/ -- Pegasystems Inc. PEGA, the low-code platform provider that builds agility into the world's leading organizations, released its financial results for the third quarter of 2022.
"Q3 2022 was by far the best quarter of the year for Pega," said Alan Trefler, founder and CEO, Pegasystems. "We've prioritized our go to market efforts to promote profitable growth. The focus we're driving is being embraced by the organization, and we're excited about the results we're seeing."
"We are excited to see growth acceleration in key performance metrics despite significant foreign exchange headwinds," said Ken Stillwell, COO and CFO, Pegasystems. "We also continue to make progress on improving operational discipline and driving profitable growth to achieve the Rule of 40 as we exit 2024."
Financial and performance metrics (1) | |||||||||||
(Dollars in thousands, except per share amounts) | Three Months Ended September 30, | Nine Months Ended September 30, | |||||||||
2022 | 2021 | Change | 2022 | 2021 | Change | ||||||
Total revenue | $ 270,731 | $ 256,268 | 6 % | $ 921,375 | $ 895,469 | 3 % | |||||
Net (loss) - GAAP | $ (93,520) | $ (56,468) | (66) % | $ (380,195) | $ (25,794) | (1374) % | |||||
Net (loss) income - non-GAAP | $ (27,498) | $ (29,671) | 7 % | $ (8,730) | $ 15,761 | * | |||||
Diluted (loss) per share - GAAP | $ (1.14) | $ (0.69) | (65) % | $ (4.65) | $ (0.32) | (1353) % | |||||
Diluted (loss) earnings per share - non-GAAP | $ (0.34) | $ (0.36) | 6 % | $ (0.11) | $ 0.18 | * | |||||
* not meaningful | |||||||||||
(Dollars in thousands) | Three Months Ended September 30, | Change | Nine Months Ended September 30, | Change | |||||||||||||
2022 | 2021 | 2022 | 2021 | ||||||||||||||
Pega Cloud | $ 97,359 | 36 % | $ 78,369 | 31 % | $ 18,990 | 24 % | $ 281,182 | 31 % | $ 219,520 | 25 % | $ 61,662 | 28 % | |||||
Maintenance | 77,526 | 29 % | 83,188 | 32 % | (5,662) | (7) % | 235,568 | 25 % | 237,531 | 26 % | (1,963) | (1) % | |||||
Subscription services | 174,885 | 65 % | 161,557 | 63 % | 13,328 | 8 % | 516,750 | 56 % | 457,051 | 51 % | 59,699 | 13 % | |||||
Subscription license | 31,112 | 11 % | 35,421 | 14 % | (4,309) | (12) % | 210,245 | 23 % | 251,226 | 28 % | (40,981) | (16) % | |||||
Subscription | 205,997 | 76 % | 196,978 | 77 % | 9,019 | 5 % | 726,995 | 79 % | 708,277 | 79 % | 18,718 | 3 % | |||||
Perpetual license | 9,223 | 3 % | 2,874 | 1 % | 6,349 | 221 % | 18,929 | 2 % | 20,922 | 2 % | (1,993) | (10) % | |||||
Consulting | 55,511 | 21 % | 56,416 | 22 % | (905) | (2) % | 175,451 | 19 % | 166,270 | 19 % | 9,181 | 6 % | |||||
$ 270,731 | 100 % | $ 256,268 | 100 % | $ 14,463 | 6 % | $ 921,375 | 100 % | $ 895,469 | 100 % | $ 25,906 | 3 % | ||||||
(1) See the Schedules at the end of this release for additional information, including a reconciliation of our non-GAAP and GAAP measures. | |||||||||||||||||

A conference call and audio-only webcast will be conducted at 5:00 p.m. EDT on Wednesday, October 26, 2022. Members of the public and investors are invited to join the call and participate in the question and answer session by dialing 1-888-256-1007 (domestic), 1-323-701-0225 (international), or via webcast (https://viavid.webcasts.com/starthere.jsp?ei=1574684&tp_key=adfbdc0fb8) by logging onto www.pega.com at least five minutes prior to the event's broadcast and clicking on the webcast icon in the Investors section.
We believe that non-GAAP financial measures help investors understand our core operating results and prospects, consistent with how management measures and forecasts our performance without the effect of often one-time charges and other items outside our normal operations. The supplementary non-GAAP financial measures are not meant to be superior to or a substitute for financial measures prepared under U.S. GAAP.
Reconciliations of our non-GAAP and GAAP measures are at the end of this release.
Certain statements in this press release may be "forward-looking statements" as defined in the Private Securities Litigation Reform Act of 1995.
Words such as expects, anticipates, intends, plans, believes, will, could, should, estimates, may, targets, strategies, projects, forecasts, guidance, likely, and usually, or variations of such words and other similar expressions identify forward-looking statements, which are based on current expectations and assumptions.
Forward-looking statements deal with future events and are subject to risks and uncertainties that are difficult to predict, including, but not limited to:
- our future financial performance and business plans;
- the adequacy of our liquidity and capital resources;
- the continued payment of our quarterly dividends;
- the timing of revenue recognition;
- management of our transition to a more subscription-based business model;
- variation in demand for our products and services, including among clients in the public sector;
- reliance on key personnel;
- global economic and political conditions and uncertainty, including continued impacts from the ongoing COVID-19 pandemic and the war in Ukraine;
- reliance on third-party service providers, including hosting providers;
- compliance with our debt obligations and covenants;
- the potential impact of our convertible senior notes and Capped Call Transactions;
- foreign currency exchange rates;
- the potential legal and financial liabilities and damage to our reputation due to cyber-attacks;
- security breaches and security flaws;
- our ability to protect our intellectual property rights, costs associated with defending such rights, intellectual property rights claims and other related claims by third parties against us, including related costs, damages, and other relief that may be granted against us;
- our client retention rate; and
- management of our growth.
These risks and others that may cause actual results to differ materially from those expressed in such forward-looking statements are described further in Part I of our Annual Report on Form 10-K for the year ended December 31, 2021, Part II of our Quarterly Report on Form 10-Q for the quarter ended September 30, 2022, and other filings we make with the U.S. Securities and Exchange Commission ("SEC").
Except as required by applicable law, we do not undertake and expressly disclaim any obligation to update or revise these forward-looking statements publicly, whether due to new information, future events, or otherwise.
The forward-looking statements in this press release represent our views as of October 26, 2022.
Pega provides a powerful low-code platform that builds agility into the world's leading organizations so they can adapt to change. Clients use our AI-powered decisioning and workflow automation to solve their most pressing business challenges – from personalizing engagement to automating service to streamlining operations. Since 1983, we've built our scalable and flexible architecture to help enterprises meet today's customer demands while continuously transforming for tomorrow. For more information on Pegasystems PEGA, visit www.pega.com.
Press contact:
Lisa Pintchman
VP, Corporate Communications
lisapintchman.rogers@pega.com
617-866-6022
Twitter: @pega
Investor contact:
Peter Welburn
VP, Corporate Development & Investor Relations
PegaInvestorRelations@pega.com
617-498-8968
All trademarks are the property of their respective owners.
PEGASYSTEMS INC. UNAUDITED CONDENSED CONSOLIDATED STATEMENTS OF OPERATIONS (in thousands, except per share amounts) | |||||||
Three Months Ended September 30, | Nine Months Ended September 30, | ||||||
2022 | 2021 | 2022 | 2021 | ||||
Revenue | |||||||
Subscription services | $ 174,885 | $ 161,557 | $ 516,750 | $ 457,051 | |||
Subscription license | 31,112 | 35,421 | 210,245 | 251,226 | |||
Perpetual license | 9,223 | 2,874 | 18,929 | 20,922 | |||
Consulting | 55,511 | 56,416 | 175,451 | 166,270 | |||
Total revenue | 270,731 | 256,268 | 921,375 | 895,469 | |||
Cost of revenue | |||||||
Subscription services | 34,541 | 30,817 | 103,104 | 88,206 | |||
Subscription license | 628 | 606 | 1,923 | 1,811 | |||
Perpetual license | 103 | 50 | 173 | 151 | |||
Consulting | 57,778 | 52,749 | 171,162 | 161,032 | |||
Total cost of revenue | 93,050 | 84,222 | 276,362 | 251,200 | |||
Gross profit | 177,681 | 172,046 | 645,013 | 644,269 | |||
Operating expenses | |||||||
Selling and marketing | 153,517 | 152,479 | 472,951 | 457,641 | |||
Research and development | 75,342 | 64,728 | 221,173 | 191,565 | |||
General and administrative | 26,043 | 20,176 | 94,530 | 57,607 | |||
Total operating expenses | 254,902 | 237,383 | 788,654 | 706,813 | |||
(Loss) from operations | (77,221) | (65,337) | (143,641) | (62,544) | |||
Foreign currency transaction gain (loss) | 3,826 | 518 | 8,415 | (4,983) | |||
Interest income | 520 | 166 | 1,036 | 555 | |||
Interest expense | (1,992) | (1,908) | (5,882) | (5,747) | |||
(Loss) on capped call transactions | (6,876) | (14,735) | (56,381) | (7,543) | |||
Other (loss) income, net | (29) | 2 | 6,497 | 108 | |||
(Loss) before provision for (benefit from) income taxes | (81,772) | (81,294) | (189,956) | (80,154) | |||
Provision for (benefit from) income taxes | 11,748 | (24,826) | 190,239 | (54,360) | |||
Net (loss) | $ (93,520) | $ (56,468) | $ (380,195) | $ (25,794) | |||
(Loss) per share | |||||||
Basic | $ (1.14) | $ (0.69) | $ (4.65) | $ (0.32) | |||
Diluted | $ (1.14) | $ (0.69) | $ (4.65) | $ (0.32) | |||
Weighted-average number of common shares outstanding | |||||||
Basic | 81,996 | 81,526 | 81,842 | 81,284 | |||
Diluted | 81,996 | 81,526 | 81,842 | 81,284 | |||
PEGASYSTEMS INC. UNAUDITED RECONCILIATION OF SELECTED GAAP MEASURES TO NON-GAAP MEASURES
| ||||||
(in thousands, except percentages and per share amounts) | Three Months Ended September 30, | Nine Months Ended September 30, | ||||
2022 | 2021 | Change | 2022 | 2021 | Change | |
Net (loss) - GAAP | $ (93,520) | $ (56,468) | (66) % | $ (380,195) | $ (25,794) | (1,374) % |
Stock-based compensation (1) | 33,774 | 28,695 | 93,301 | 89,483 | ||
Capped call transactions | 6,876 | 14,735 | 56,381 | 7,543 | ||
Litigation | 4,470 | 4,087 | 32,420 | 8,416 | ||
Convertible senior notes | 724 | 677 | 2,163 | 2,025 | ||
Headquarters lease | — | (5,428) | — | (15,111) | ||
Amortization of intangible assets | 1,048 | 1,002 | 3,045 | 3,006 | ||
Foreign currency transaction (gain) loss | (3,826) | (518) | (8,415) | 4,983 | ||
Other | 3,452 | 3 | (131) | 15 | ||
Income tax effects (2) | 19,504 | (16,456) | 192,701 | (58,805) | ||
Net (loss) income - non-GAAP | $ (27,498) | $ (29,671) | 7 % | $ (8,730) | $ 15,761 | * |
Diluted (loss) per share - GAAP | $ (1.14) | $ (0.69) | (65) % | $ (4.65) | $ (0.32) | (1,353) % |
non-GAAP adjustments | 0.80 | 0.33 | 4.54 | 0.50 | ||
Diluted (loss) earnings per share - non-GAAP | $ (0.34) | $ (0.36) | 6 % | $ (0.11) | $ 0.18 | * |
Diluted weighted-average number of common shares outstanding - GAAP | 81,996 | 81,526 | 1 % | 81,842 | 81,284 | 1 % |
non-GAAP Adjustments | — | — | — | 4,718 | ||
Diluted weighted-average number of common shares outstanding - non-GAAP | 81,996 | 81,526 | 1 % | 81,842 | 86,002 | (5) % |
* not meaningful | ||||||
Our non-GAAP financial measures reflect the following adjustments:
- Stock-based compensation: We have excluded stock-based compensation from our non-GAAP operating expenses and profitability measures. Although stock-based compensation is a key incentive offered to our employees, and we believe such compensation contributed to our revenues recognized during the periods presented and is expected to contribute to our future revenues, we continue to evaluate our business performance excluding stock-based compensation.
- Capped call transactions: We have excluded gains and losses related to our capped call transactions held at fair value under U.S. GAAP. The capped call transactions are expected to reduce common stock dilution and/or offset any potential cash payments we must make, other than for principal and interest, upon conversion of the Notes. We believe excluding these amounts from our non-GAAP financial measures is useful to investors as the types of events giving rise to them are not representative of our core business operations and ongoing operating performance. In addition, we reflect the effect of the capped call transactions on the weighted-average number of common shares outstanding in our non-GAAP financial measures as we believe it provides investors with useful information when evaluating our financial performance on a per-share basis.
- Litigation: Includes legal fees and related expenses arising from proceedings outside of the ordinary course of business. We believe excluding these expenses from our non-GAAP financial measures is useful to investors as the disputes giving rise to them are not representative of our core business operations and ongoing operating performance.
- Convertible senior notes: In February 2020, we issued convertible senior notes with an aggregate principal amount of $600 million, due March 1, 2025, in a private placement. We believe excluding the amortization of debt discounts and issuance costs provides a useful comparison of our operational performance in different periods.
- Headquarters lease: In February 2021, we agreed to accelerate our exit from our then Cambridge, Massachusetts headquarters to October 1, 2021, in exchange for a one-time payment from our landlord of $18 million, which was received in October 2021. We believe excluding the impact from our non-GAAP financial measures is useful to investors as the modified lease, including the $18 million payment, is not representative of our core business operations and ongoing operating performance.
- Amortization of intangible assets: We have excluded the amortization of intangible assets from our non-GAAP operating expenses and profitability measures. Amortization of intangible assets fluctuates in amount and frequency and is significantly affected by the timing and size of acquisitions. Investors should note that intangible assets contributed to our revenues recognized during the periods presented and are expected to contribute to future revenues. Amortization of intangible assets is likely to recur in future periods.
- Foreign currency transaction (gain) loss: We have excluded foreign currency transaction gains and losses from our non-GAAP profitability measures. Foreign currency transaction gains and losses fluctuate in amount and frequency and are significantly affected by foreign exchange market rates. Foreign currency transaction gains and losses are likely to recur in future periods.
- Other: We have excluded gains and losses from our venture investments, capital advisory expenses, expenses incurred due to the cancellation of in-person sales and marketing events. We believe excluding these amounts from our non-GAAP financial measures is useful to investors as the types of events giving rise to them are not representative of our core business operations and ongoing operating performance.
(1) Stock-based compensation: | |||||||
Three Months Ended September 30, | Nine Months Ended September 30, | ||||||
(in thousands) | 2022 | 2021 | 2022 | 2021 | |||
Cost of revenue | $ 6,797 | $ 5,114 | $ 19,754 | $ 16,889 | |||
Selling and marketing | 12,933 | 13,376 | 36,524 | 41,844 | |||
Research and development | 7,724 | 6,231 | 22,425 | 19,343 | |||
General and administrative | 6,320 | 3,974 | 14,598 | 11,407 | |||
$ 33,774 | $ 28,695 | $ 93,301 | $ 89,483 | ||||
Income tax benefit | $ (600) | $ (5,845) | $ (1,505) | $ (18,028) | |||
(2) Effective income tax rates: | |||||||
Nine Months Ended September 30, | |||||||
2022 | 2021 | ||||||
GAAP | 100 % | (68) % | |||||
non-GAAP | 22 % | 22 % | |||||
Our GAAP effective income tax rate is subject to significant fluctuations due to several factors, including excess tax benefits generated by our stock-based compensation plans, gains and losses on our capped call transactions, tax credits for stock-based compensation awards to research and development employees, and unfavorable foreign stock-based compensation adjustments. We determine our non-GAAP income tax rate using applicable rates in taxing jurisdictions and assessing certain factors, including our historical and forecasted earnings by jurisdiction, discrete items, and our ability to realize tax assets. Under GAAP we recorded a valuation allowance on our deferred tax assets of $192 million in the three months ended June 30, 2022. See "Note 12. Income Taxes" in Part I, Item 1 of our Quarterly Report on Form 10-Q for the three months ended September 30, 2022 for additional information. We believe it is beneficial for our management to review our non-GAAP results consistent with our annual plan's effective income tax rate as established at the beginning of each year, given tax rate volatility.
PEGASYSTEMS INC. UNAUDITED CONDENSED CONSOLIDATED BALANCE SHEETS (in thousands) | |||
September 30, 2022 | December 31, 2021 | ||
Assets | |||
Current assets: | |||
Cash and cash equivalents | $ 107,626 | $ 159,965 | |
Marketable securities | 168,085 | 202,814 | |
Total cash, cash equivalents, and marketable securities | 275,711 | 362,779 | |
Accounts receivable | 139,670 | 182,717 | |
Unbilled receivables | 182,403 | 226,714 | |
Other current assets | 62,457 | 68,008 | |
Total current assets | 660,241 | 840,218 | |
Unbilled receivables | 108,285 | 129,789 | |
Goodwill | 81,201 | 81,923 | |
Other long-term assets | 316,731 | 541,601 | |
Total assets | $ 1,166,458 | $ 1,593,531 | |
Liabilities and stockholders' equity | |||
Current liabilities: | |||
Accounts payable | $ 13,562 | $ 15,281 | |
Accrued expenses | 61,012 | 63,890 | |
Accrued compensation and related expenses | 85,999 | 120,946 | |
Deferred revenue | 245,146 | 275,844 | |
Other current liabilities | 8,253 | 9,443 | |
Total current liabilities | 413,972 | 485,404 | |
Convertible senior notes, net | 592,884 | 590,722 | |
Operating lease liabilities | 82,705 | 87,818 | |
Other long-term liabilities | 11,936 | 13,499 | |
Total liabilities | 1,101,497 | 1,177,443 | |
Total stockholders' equity | 64,961 | 416,088 | |
Total liabilities and stockholders' equity | $ 1,166,458 | $ 1,593,531 | |
PEGASYSTEMS INC. UNAUDITED CONDENSED CONSOLIDATED STATEMENTS OF CASH FLOWS (in thousands) | |||
Nine Months Ended September 30, | |||
2022 | 2021 | ||
Net (loss) | $ (380,195) | $ (25,794) | |
Adjustments to reconcile net (loss) to cash (used in) operating activities | |||
Non-cash items | 372,684 | 118,309 | |
Change in operating assets and liabilities, net | (5,935) | (97,836) | |
Cash (used in) operating activities | (13,446) | (5,321) | |
Cash provided by investing activities | 10,104 | 42,730 | |
Cash (used in) financing activities | (43,484) | (91,431) | |
Effect of exchange rate changes on cash and cash equivalents | (5,513) | (1,466) | |
Net (decrease) in cash and cash equivalents | (52,339) | (55,488) | |
Cash and cash equivalents, beginning of period | 159,965 | 171,899 | |
Cash and cash equivalents, end of period | $ 107,626 | $ 116,411 | |
PEGASYSTEMS INC. ANNUAL CONTRACT VALUE (in thousands, except percentages) | ||||||
Annual contract value ("ACV") - ACV represents the annualized value of our active contracts as of the measurement date. | ||||||
September 30, 2022 | September 30, 2021 | Change | ||||
Pega Cloud | $ 416,030 | $ 320,653 | $ 95,377 | 30 % | ||
Maintenance | 310,104 | 332,752 | (22,648) | (7) % | ||
Subscription services | 726,134 | 653,405 | 72,729 | 11 % | ||
Subscription license | 314,110 | 294,320 | 19,790 | 7 % | ||
$ 1,040,244 | $ 947,725 | $ 92,519 | 10 % | |||
PEGASYSTEMS INC.
| ||||||||||||
Remaining performance obligations ("Backlog") - Expected future revenue from existing non-cancellable contracts: | ||||||||||||
Subscription services | Subscription license | Perpetual license | Consulting | Total | ||||||||
Maintenance | Pega Cloud | |||||||||||
1 year or less | $ 191,045 | $ 328,111 | $ 69,753 | $ 814 | $ 27,968 | $ 617,691 | 53 % | |||||
1-2 years | 55,141 | 213,304 | 4,113 | 4,505 | 6,699 | 283,762 | 25 % | |||||
2-3 years | 24,496 | 115,416 | 1,420 | 2,252 | 1,648 | 145,232 | 13 % | |||||
Greater than 3 years | 16,198 | 82,807 | 1,734 | — | 508 | 101,247 | 9 % | |||||
$ 286,880 | $ 739,638 | $ 77,020 | $ 7,571 | $ 36,823 | $ 1,147,932 | 100 % | ||||||
% of Total | 25 % | 64 % | 7 % | 1 % | 3 % | 100 % | ||||||
Change since September 30, 2021 | ||||||||||||
$ (40,816) | $ 168,177 | $ 10,218 | $ (15,400) | $ (8,273) | $ 113,906 | |||||||
(12) % | 29 % | 15 % | (67) % | (18) % | 11 % | |||||||
As of September 30, 2021: | ||||||||||||
Subscription services | Subscription license | Perpetual license | Consulting | Total | ||||||||
Maintenance | Pega Cloud | |||||||||||
1 year or less | $ 196,667 | $ 284,359 | $ 49,265 | $ 15,686 | $ 31,673 | $ 577,650 | 56 % | |||||
1-2 years | 59,360 | 177,214 | 16,872 | 1,064 | 6,561 | 261,071 | 25 % | |||||
2-3 years | 37,734 | 79,775 | 420 | 4,094 | 5,165 | 127,188 | 12 % | |||||
Greater than 3 years | 33,935 | 30,113 | 245 | 2,127 | 1,697 | 68,117 | 7 % | |||||
$ 327,696 | $ 571,461 | $ 66,802 | $ 22,971 | $ 45,096 | $ 1,034,026 | 100 % | ||||||
% of Total | 33 % | 55 % | 6 % | 2 % | 4 % | 100 % | ||||||
RECONCILIATION OF GAAP BACKLOG AND CONSTANT CURRENCY BACKLOG | |||
(in millions, except percentages ) | Q3 2022 | 1 Year Growth Rate | |
Backlog - GAAP | $ 1,148 | 11 % | |
Impact of changes in foreign exchange rates | 74 | 7 % | |
Backlog - Constant Currency | $ 1,222 | 18 % | |
Note: Constant currency Backlog is calculated by applying foreign exchange rates for the earliest period shown to all periods. The above constant currency measures reflect foreign exchange rates applicable as of Q3 2021.


SOURCE Pegasystems Inc.
© 2024 Benzinga.com. Benzinga does not provide investment advice. All rights reserved.
Date | ticker | name | Actual EPS | EPS Surprise | Actual Rev | Rev Surprise |
|---|
Trade confidently with insights and alerts from analyst ratings, free reports and breaking news that affects the stocks you care about.

