


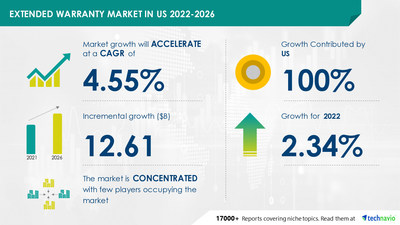
NEW YORK, Oct. 24, 2022 /PRNewswire/ -- The extended warranty market size in the US is expected to grow by USD 12.61 billion from 2021 to 2026. In addition, the growth momentum of the market will accelerate at a CAGR of 4.55% during the forecast period, according to Technavio. The high demand for household appliances is driving the extended warranty market growth in the US. However, security threats are challenging market growth.

Find a comprehensive report summary that describes the market size and forecast along with the research methodology. The FREE sample report is available in PDF format
- Automotive - size and forecast 2021-2026
- Consumer electronics - size and forecast 2021-2026
- Home appliances - size and forecast 2021-2026
- Mobile devices and PCs - size and forecast 2021-2026
- Others - size and forecast 2021-2026
- Businesses - size and forecast 2021-2026
- Individuals - size and forecast 2021-2026
Learn about the contribution of each segment summarized in concise infographics and thorough descriptions. View a FREE PDF Sample Report
The automotive segment will be the largest contributor to market growth during the forecast period. This growth is attributed to factors such as the presence of major automotive industries in the country. The automotive industry in the US is mature, and it is expected to witness a moderate growth rate during the forecast period. Some of the top automotive manufacturers in the US, such as General Motors Co. and Ford Motor Co., are leaders in technological advances and innovations. In addition, consumers in the US have a high disposable income, which is increasing the demand for luxurious vehicles. Thus, demand for and sales of automobiles in the US are high. Customers in the US prefer extended warranties for their automobiles. Extended warranties provide various benefits such as reimbursement of damage on rental cars and repair or replacement of gadgets due to accidental damage or theft. These factors are expected to fuel the market growth during the forecast period.
Get lifetime access to our Technavio Insights! Subscribe to our "Basic Plan" billed annually at USD 5000
The extended warranty market in the US is concentrated due to the presence of a smaller number of players in the market. Vendors are deploying growth strategies such as innovative solutions, service features, brand recognition, pricing, and service portfolios to compete in the market. Value-added services can help in driving the market's growth in the future. Hence, most vendors have started to focus on cross-selling their services by providing additional coverage to clients. They are also focusing on expanding their businesses and geographical presence to raise their profit margins and market share, which, in turn, will drive the growth of the market during the forecast period.
This report provides a full list of key vendors, their strategies, and the latest developments. Buy Now to gain access to exclusive vendor information
- Allianz Group
- American International Group Inc.
- AmTrust Financial Services Inc.
- Assurant Inc.
- Asurion LLC
- AXA Group
- Carchex LLC
- Chubb Ltd.
- Endurance Warranty Services LLC
- The Allstate Corp.
Auto Extended Warranty Market by End-user and Geography - Forecast and Analysis - 2022-2026: This report extensively covers segmentation by end-user (personal and commercial) and geography (North America, Europe, APAC, South America, and the Middle East and Africa). 41% of the market's growth will originate from North America during the forecast period. The market share growth in the personal segment will be significant.
Cleaning Services Market by End-user, and Geography - Forecast and Analysis 2022-2026: This report extensively covers market segmentation by end-user (commercial and residential) and geography (North America, Europe, APAC, South America, and the Middle East and Africa). 33% of the market's growth will originate from APAC during the forecast period. The market share growth in the commercial segment will be significant.
Extended Warranty Market Scope in US | |
Report Coverage | Details |
Page number | 120 |
Base year | 2021 |
Forecast period | 2022-2026 |
Growth momentum & CAGR | Accelerate at a CAGR of 4.55% |
Market growth 2022-2026 | USD 12.61 billion |
Market structure | Concentrated |
YoY growth (%) | 2.34 |
Regional analysis | US |
Competitive landscape | Leading companies, competitive strategies, consumer engagement scope |
Key companies profiled | Allianz Group, American International Group Inc., AmTrust Financial Services Inc., Assurant Inc., Asurion LLC, AXA Group, Carchex LLC, Chubb Ltd., Endurance Warranty Services LLC, and The Allstate Corp. |
Market dynamics | Parent market analysis, market growth inducers and obstacles, fast-growing and slow-growing segment analysis, COVID-19 impact and recovery analysis and future consumer dynamics, and market condition analysis for the forecast period. |
Customization purview | If our report has not included the data that you are looking for, you can reach out to our analysts and get segments customized. |
Browse Consumer Discretionary Market Reports
1 Executive Summary
- 1.1 Market overview
- Exhibit 01: Executive Summary – Chart on Market Overview
- Exhibit 02: Executive Summary – Data Table on Market Overview
- Exhibit 03: Executive Summary – Chart on Country Market Characteristics
- Exhibit 04: Executive Summary – Chart on Market Segmentation by Device
- Exhibit 05: Executive Summary – Chart on Market Segmentation by End-user
- Exhibit 06: Executive Summary – Chart on Vendor Market Positioning
2 Market Landscape
- 2.1 Market ecosystem
- Exhibit 07: Parent market
- Exhibit 08: Market Characteristics
3 Market Sizing
- 3.1 Market definition
- Exhibit 09: Offerings of vendors included in the market definition
- 3.2 Market segment analysis
- Exhibit 10: Market segments
- 3.3 Market size 2021
- 3.4 Market outlook: Forecast for 2021-2026
- Exhibit 11: Chart on US - Market size and forecast 2021-2026 ($ million)
- Exhibit 12: Data Table on US - Market size and forecast 2021-2026 ($ million)
- Exhibit 13: Chart on US: Year-over-year growth 2021-2026 (%)
- Exhibit 14: Data Table on US: Year-over-year growth 2021-2026 (%)
4 Five Forces Analysis
- 4.1 Five forces summary
- Exhibit 15: Five forces analysis - Comparison between 2021 and 2026
- 4.2 Bargaining power of buyers
- Exhibit 16: Chart on Bargaining power of buyers – Impact of key factors 2021 and 2026
- 4.3 Bargaining power of suppliers
- Exhibit 17: Bargaining power of suppliers – Impact of key factors in 2021 and 2026
- 4.4 Threat of new entrants
- Exhibit 18: Threat of new entrants – Impact of key factors in 2021 and 2026
- 4.5 Threat of substitutes
- Exhibit 19: Threat of substitutes – Impact of key factors in 2021 and 2026
- 4.6 Threat of rivalry
- Exhibit 20: Threat of rivalry – Impact of key factors in 2021 and 2026
- 4.7 Market condition
- Exhibit 21: Chart on Market condition - Five forces 2021 and 2026
5 Market Segmentation by Device
- 5.1 Market segments
- Exhibit 22: Chart on Device - Market share 2021-2026 (%)
- Exhibit 23: Data Table on Device - Market share 2021-2026 (%)
- 5.2 Comparison by Device
- Exhibit 24: Chart on Comparison by Device
- Exhibit 25: Data Table on Comparison by Device
- 5.3 Automobile - Market size and forecast 2021-2026
- Exhibit 26: Chart on Automobile - Market size and forecast 2021-2026 ($ million)
- Exhibit 27: Data Table on Automobile - Market size and forecast 2021-2026 ($ million)
- Exhibit 28: Chart on Automobile - Year-over-year growth 2021-2026 (%)
- Exhibit 29: Data Table on Automobile - Year-over-year growth 2021-2026 (%)
- 5.4 Consumer electronics - Market size and forecast 2021-2026
- Exhibit 30: Chart on Consumer electronics - Market size and forecast 2021-2026 ($ million)
- Exhibit 31: Data Table on Consumer electronics - Market size and forecast 2021-2026 ($ million)
- Exhibit 32: Chart on Consumer electronics - Year-over-year growth 2021-2026 (%)
- Exhibit 33: Data Table on Consumer electronics - Year-over-year growth 2021-2026 (%)
- 5.5 Home appliances - Market size and forecast 2021-2026
- Exhibit 34: Chart on Home appliances - Market size and forecast 2021-2026 ($ million)
- Exhibit 35: Data Table on Home appliances - Market size and forecast 2021-2026 ($ million)
- Exhibit 36: Chart on Home appliances - Year-over-year growth 2021-2026 (%)
- Exhibit 37: Data Table on Home appliances - Year-over-year growth 2021-2026 (%)
- 5.6 Mobile devices and PCs - Market size and forecast 2021-2026
- Exhibit 38: Chart on Mobile devices and PCs - Market size and forecast 2021-2026 ($ million)
- Exhibit 39: Data Table on Mobile devices and PCs - Market size and forecast 2021-2026 ($ million)
- Exhibit 40: Chart on Mobile devices and PCs - Year-over-year growth 2021-2026 (%)
- Exhibit 41: Data Table on Mobile devices and PCs - Year-over-year growth 2021-2026 (%)
- 5.7 Others - Market size and forecast 2021-2026
- Exhibit 42: Chart on Others - Market size and forecast 2021-2026 ($ million)
- Exhibit 43: Data Table on Others - Market size and forecast 2021-2026 ($ million)
- Exhibit 44: Chart on Others - Year-over-year growth 2021-2026 (%)
- Exhibit 45: Data Table on Others - Year-over-year growth 2021-2026 (%)
- 5.8 Market opportunity by Device
- Exhibit 46: Market opportunity by Device ($ million)
6 Market Segmentation by End-user
- 6.1 Market segments
- Exhibit 47: Chart on End-user - Market share 2021-2026 (%)
- Exhibit 48: Data Table on End-user - Market share 2021-2026 (%)
- 6.2 Comparison by End-user
- Exhibit 49: Chart on Comparison by End-user
- Exhibit 50: Data Table on Comparison by End-user
- 6.3 Businesses - Market size and forecast 2021-2026
- Exhibit 51: Chart on Businesses - Market size and forecast 2021-2026 ($ million)
- Exhibit 52: Data Table on Businesses - Market size and forecast 2021-2026 ($ million)
- Exhibit 53: Chart on Businesses - Year-over-year growth 2021-2026 (%)
- Exhibit 54: Data Table on Businesses - Year-over-year growth 2021-2026 (%)
- 6.4 Individuals - Market size and forecast 2021-2026
- Exhibit 55: Chart on Individuals - Market size and forecast 2021-2026 ($ million)
- Exhibit 56: Data Table on Individuals - Market size and forecast 2021-2026 ($ million)
- Exhibit 57: Chart on Individuals - Year-over-year growth 2021-2026 (%)
- Exhibit 58: Data Table on Individuals - Year-over-year growth 2021-2026 (%)
- 6.5 Market opportunity by End-user
- Exhibit 59: Market opportunity by End-user ($ million)
7 Customer Landscape
- 7.1 Customer landscape overview
- Exhibit 60: Analysis of price sensitivity, lifecycle, customer purchase basket, adoption rates, and purchase criteria
8 Drivers, Challenges, and Trends
- 8.1 Market drivers
- 8.2 Market challenges
- 8.3 Impact of drivers and challenges
- Exhibit 61: Impact of drivers and challenges in 2021 and 2026
- 8.4 Market trends
9 Vendor Landscape
- 9.1 Overview
- 9.2 Vendor landscape
- Exhibit 62: Overview on Criticality of inputs and Factors of differentiation
- 9.3 Landscape disruption
- Exhibit 63: Overview on factors of disruption
- 9.4 Industry risks
- Exhibit 64: Impact of key risks on business
10 Vendor Analysis
- 10.1 Vendors covered
- Exhibit 65: Vendors covered
- 10.2 Market positioning of vendors
- Exhibit 66: Matrix on vendor position and classification
- 10.3 Allianz Group
- Exhibit 67: Allianz Group - Overview
- Exhibit 68: Allianz Group - Business segments
- Exhibit 69: Allianz Group - Key news
- Exhibit 70: Allianz Group - Key offerings
- Exhibit 71: Allianz Group - Segment focus
- 10.4 American International Group Inc.
- Exhibit 72: American International Group Inc. - Overview
- Exhibit 73: American International Group Inc. - Business segments
- Exhibit 74: American International Group Inc. - Key news
- Exhibit 75: American International Group Inc. - Key offerings
- Exhibit 76: American International Group Inc. - Segment focus
- 10.5 AmTrust Financial Services Inc.
- Exhibit 77: AmTrust Financial Services Inc. - Overview
- Exhibit 78: AmTrust Financial Services Inc. - Product / Service
- Exhibit 79: AmTrust Financial Services Inc. - Key news
- Exhibit 80: AmTrust Financial Services Inc. - Key offerings
- 10.6 Assurant Inc.
- Exhibit 81: Assurant Inc. - Overview
- Exhibit 82: Assurant Inc. - Business segments
- Exhibit 83: Assurant Inc. - Key offerings
- Exhibit 84: Assurant Inc. - Segment focus
- 10.7 Asurion LLC
- Exhibit 85: Asurion LLC - Overview
- Exhibit 86: Asurion LLC - Product / Service
- Exhibit 87: Asurion LLC - Key offerings
- 10.8 AXA Group
- Exhibit 88: AXA Group - Overview
- Exhibit 89: AXA Group - Business segments
- Exhibit 90: AXA Group - Key offerings
- Exhibit 91: AXA Group - Segment focus
- 10.9 Carchex LLC
- Exhibit 92: Carchex LLC - Overview
- Exhibit 93: Carchex LLC - Product / Service
- Exhibit 94: Carchex LLC - Key offerings
- 10.10 Chubb Ltd.
- Exhibit 95: Chubb Ltd. - Overview
- Exhibit 96: Chubb Ltd. - Business segments
- Exhibit 97: Chubb Ltd. - Key news
- Exhibit 98: Chubb Ltd. - Key offerings
- Exhibit 99: Chubb Ltd. - Segment focus
- 10.11 Endurance Warranty Services LLC
- Exhibit 100: Endurance Warranty Services LLC - Overview
- Exhibit 101: Endurance Warranty Services LLC - Product / Service
- Exhibit 102: Endurance Warranty Services LLC - Key offerings
- 10.12 The Allstate Corp.
- Exhibit 103: The Allstate Corp. - Overview
- Exhibit 104: The Allstate Corp. - Business segments
- Exhibit 105: The Allstate Corp. - Key offerings
- Exhibit 106: The Allstate Corp. - Segment focus
11 Appendix
- 11.1 Scope of the report
- 11.2 Inclusions and exclusions checklist
- Exhibit 107: Inclusions checklist
- Exhibit 108: Exclusions checklist
- 11.3 Currency conversion rates for US$
- Exhibit 109: Currency conversion rates for US$
- 11.4 Research methodology
- Exhibit 110: Research methodology
- Exhibit 111: Validation techniques employed for market sizing
- Exhibit 112: Information sources
- 11.5 List of abbreviations
- Exhibit 113: List of abbreviations
Technavio is a leading global technology research and advisory company. Their research and analysis focus on emerging market trends and provide actionable insights to help businesses identify market opportunities and develop effective strategies to optimize their market positions.
With over 500 specialized analysts, Technavio's report library consists of more than 17,000 reports and counting, covering 800 technologies, spanning across 50 countries. Their client base consists of enterprises of all sizes, including more than 100 Fortune 500 companies. This growing client base relies on Technavio's comprehensive coverage, extensive research, and actionable market insights to identify opportunities in existing and potential markets and assess their competitive positions within changing market scenarios.
Contacts
Technavio Research
Jesse Maida
Media & Marketing Executive
US: +1 844 364 1100
UK: +44 203 893 3200
Email: media@technavio.com
Website: www.technavio.com/


SOURCE Technavio
© 2024 Benzinga.com. Benzinga does not provide investment advice. All rights reserved.
Trade confidently with insights and alerts from analyst ratings, free reports and breaking news that affects the stocks you care about.

