


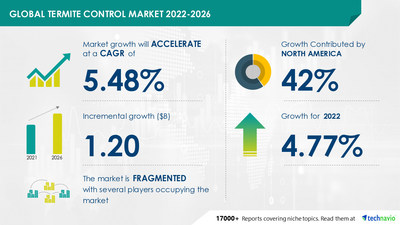
NEW YORK, Oct. 24, 2022 /PRNewswire/ -- The Termite Control Market size is expected to grow by USD 1.2 billion from 2021 to 2026. In addition, the growth momentum of the market will accelerate at a CAGR of 5.48% during the forecast period, according to Technavio. The increasing demand from the agriculture sector is driving the termite control market growth. However, factors such as the increasing availability of DIY termite control products may challenge market growth.

Find a comprehensive report summary that describes the market size and forecast along with the research methodology. The FREE sample report is available in PDF format
Termite Control Market is segmented as below:
- Application
- Commercial
- Residential
- Agriculture
- Others
- Geography
- North America
- Europe
- APAC
- Middle East And Africa
- South America
Learn about the contribution of each segment summarized in concise infographics and thorough descriptions. Buy Full Report
The termite control market share growth in the commercial segment will be significant during the forecast period. The commercial segment was the largest segment of the global termite control market in 2021 and will continue to remain the largest segment during the forecast period. The stringent regulatory requirements to keep the threat of termite infestation under control lead to the high demand for termite control services from the commercial sector. Audits are mandatory by many government authorities for certifications, such as ISO 9001 and ISO 22000, in the commercial sector. Such factors in the commercial segment will boost market growth during the forecast period.
The termite control market report covers the following areas:
The global termite control market is fragmented due to the presence of a significant number of global and regional vendors. These vendors are included in the report based on their offerings to the global termite control market. They are identified based on their revenue, market dominance, geographical presence, product portfolio, and financials. Vendors compete based on several factors, such as quality, price, service, brand image, distribution, and marketing. Regulations compelling the use of eco-friendly products and techniques have brought more competition to the industry. Therefore, the launch of new eco-friendly termite control products will intensify the competition in the market in focus during the forecast period.
We provide a detailed analysis of around 25 vendors operating in the termite control market, including Annex Pest Control, Anticimex International AB, Aptive Environmental LLC, Arrow Exterminators Inc, BASF SE, China National Chemical Corp. Ltd., Dodson Pest Control Inc., Dow Inc., Dynamic Sanito SEA Pte. Ltd, Ecolab Inc., FMC Corp., Green Pest Solutions, Lifecycle Pest Control and Sanitization services, Lloyd Pest Control, Massey Services Inc., Nikkei Inc., Pelsis Ltd., Rentokil Initial Plc, Rollins Inc., SANIX Inc., and Sumitomo Chemical Co. Ltd.
Subscribe to our "Basic Plan" billed annually at USD 5000 that enables you to download 5 reports and view 100 reports per month
- CAGR of the market during the forecast period 2022-2026
- Detailed information on factors that will assist termite control market growth during the next five years
- Estimation of the termite control market size and its contribution to the parent market
- Predictions on upcoming trends and changes in consumer behavior
- The growth of the termite control market
- Analysis of the market's competitive landscape and detailed information on vendors
- Comprehensive details of factors that will challenge the growth of termite control market vendors
Pest Control Services Market by Application, End-user, and Geography – Forecast and Analysis 2022-2026: The increase in demand for insurance-based pest control services is driving the growth of the global pest control services market. Significant costs associated with pest control services are propelling many vendors in the market to create insurance-based pest control services for both residential and commercial customers. There is a growing interest from customers in including pest control coverage as a standard feature in home insurance plans.
Automated Pest Monitoring System Market by End-user and Geography – Forecast and Analysis 2022-2026: The automated pest monitoring system market share for the agriculture sector is expected to increase by USD 103.2 million from 2020 to 2025, and the market's growth momentum will accelerate at a CAGR of 9.28%.
Termite Control Market Scope | |
Report Coverage | Details |
Page number | 120 |
Base year | 2021 |
Forecast period | 2022-2026 |
Growth momentum & CAGR | Accelerate at a CAGR of 5.48% |
Market growth 2022-2026 | USD 1.20 billion |
Market structure | Fragmented |
YoY growth (%) | 4.77 |
Regional analysis | North America, Europe, APAC, Middle East and Africa, and South America |
Performing market contribution | North America at 42% |
Key consumer countries | US, China, India, Germany, and France |
Competitive landscape | Leading companies, competitive strategies, consumer engagement scope |
Companies profiled | Annex Pest Control, Anticimex International AB, Aptive Environmental LLC, Arrow Exterminators Inc, BASF SE, China National Chemical Corp. Ltd., Dodson Pest Control Inc., Dow Inc., Dynamic Sanito SEA Pte. Ltd, Ecolab Inc., FMC Corp., Green Pest Solutions, Lifecycle Pest Control and Sanitization services, Lloyd Pest Control, Massey Services Inc., Nikkei Inc., Pelsis Ltd., Rentokil Initial Plc, Rollins Inc., SANIX Inc., and Sumitomo Chemical Co. Ltd. |
Market Dynamics | Parent market analysis, Market growth inducers and obstacles, Fast-growing and slow-growing segment analysis, COVID-19 impact and future consumer dynamics, and market condition analysis for the forecast period. |
Customization purview | If our report has not included the data that you are looking for, you can reach out to our analysts and get segments customized. |
1 Executive Summary
- 1.1 Market Overview
- Exhibit 01: Executive Summary – Chart on Market Overview
- Exhibit 02: Executive Summary – Data Table on Market Overview
- Exhibit 03: Executive Summary – Chart on Global Market Characteristics
- Exhibit 04: Executive Summary – Chart on Market by Geography
- Exhibit 05: Executive Summary – Chart on Market Segmentation by Application
- Exhibit 06: Executive Summary – Chart on Incremental Growth
- Exhibit 07: Executive Summary – Data Table on Incremental Growth
- Exhibit 08: Executive Summary – Chart on Vendor Market Positioning
2 Market Landscape
- 2.1 Market ecosystem
- Exhibit 09: Parent market
- Exhibit 10: Market Characteristics
3 Market Sizing
- 3.1 Market Definition
- Exhibit 11: Offerings of vendors included in the market definition
- 3.2 Market segment analysis
- Exhibit 12: Market segments
- 3.3 Market size 2021
- 3.4 Market outlook: Forecast for 2021-2026
- Exhibit 13: Chart on Global - Market size and forecast 2021-2026 ($ million)
- Exhibit 14: Data Table on Global - Market size and forecast 2021-2026 ($ million)
- Exhibit 15: Chart on Global Market: Year-over-year growth 2021-2026 (%)
- Exhibit 16: Data Table on Global Market: Year-over-year growth 2021-2026 (%)
4 Five Forces Analysis
- 4.1 Five forces summary
- Exhibit 17: Five forces analysis - Comparison between 2021 and 2026
- 4.2 Bargaining power of buyers
- Exhibit 18: Chart on Bargaining power of buyers – Impact of key factors 2021 and 2026
- 4.3 Bargaining power of suppliers
- Exhibit 19: Bargaining power of suppliers – Impact of key factors in 2021 and 2026
- 4.4 Threat of new entrants
- Exhibit 20: Threat of new entrants – Impact of key factors in 2021 and 2026
- 4.5 Threat of substitutes
- Exhibit 21: Threat of substitutes – Impact of key factors in 2021 and 2026
- 4.6 Threat of rivalry
- Exhibit 22: Threat of rivalry – Impact of key factors in 2021 and 2026
- 4.7 Market condition
- Exhibit 23: Chart on Market condition - Five forces 2021 and 2026
5 Market Segmentation by Application
- 5.1 Market segments
- Exhibit 24: Chart on Application - Market share 2021-2026 (%)
- Exhibit 25: Data Table on Application - Market share 2021-2026 (%)
- 5.2 Comparison by Application
- Exhibit 26: Chart on Comparison by Application
- Exhibit 27: Data Table on Comparison by Application
- 5.3 Commercial - Market size and forecast 2021-2026
- Exhibit 28: Chart on Commercial - Market size and forecast 2021-2026 ($ million)
- Exhibit 29: Data Table on Commercial - Market size and forecast 2021-2026 ($ million)
- Exhibit 30: Chart on Commercial - Year-over-year growth 2021-2026 (%)
- Exhibit 31: Data Table on Commercial - Year-over-year growth 2021-2026 (%)
- 5.4 Residential - Market size and forecast 2021-2026
- Exhibit 32: Chart on Residential - Market size and forecast 2021-2026 ($ million)
- Exhibit 33: Data Table on Residential - Market size and forecast 2021-2026 ($ million)
- Exhibit 34: Chart on Residential - Year-over-year growth 2021-2026 (%)
- Exhibit 35: Data Table on Residential - Year-over-year growth 2021-2026 (%)
- 5.5 Agriculture - Market size and forecast 2021-2026
- Exhibit 36: Chart on Agriculture - Market size and forecast 2021-2026 ($ million)
- Exhibit 37: Data Table on Agriculture - Market size and forecast 2021-2026 ($ million)
- Exhibit 38: Chart on Agriculture - Year-over-year growth 2021-2026 (%)
- Exhibit 39: Data Table on Agriculture - Year-over-year growth 2021-2026 (%)
- 5.6 Others - Market size and forecast 2021-2026
- Exhibit 40: Chart on Others - Market size and forecast 2021-2026 ($ million)
- Exhibit 41: Data Table on Others - Market size and forecast 2021-2026 ($ million)
- Exhibit 42: Chart on Others - Year-over-year growth 2021-2026 (%)
- Exhibit 43: Data Table on Others - Year-over-year growth 2021-2026 (%)
- 5.7 Market opportunity by Application
- Exhibit 44: Market opportunity by Application ($ million)
6 Customer Landscape
- 6.1 Customer landscape overview
- Exhibit 45: Analysis of price sensitivity, lifecycle, customer purchase basket, adoption rates, and purchase criteria
7 Geographic Landscape
- 7.1 Geographic segmentation
- Exhibit 46: Chart on Market share by geography 2021-2026 (%)
- Exhibit 47: Data Table on Market share by geography 2021-2026 (%)
- 7.2 Geographic comparison
- Exhibit 48: Chart on Geographic comparison
- Exhibit 49: Data Table on Geographic comparison
- 7.3 North America - Market size and forecast 2021-2026
- Exhibit 50: Chart on North America - Market size and forecast 2021-2026 ($ million)
- Exhibit 51: Data Table on North America - Market size and forecast 2021-2026 ($ million)
- Exhibit 52: Chart on North America - Year-over-year growth 2021-2026 (%)
- Exhibit 53: Data Table on North America - Year-over-year growth 2021-2026 (%)
- 7.4 Europe - Market size and forecast 2021-2026
- Exhibit 54: Chart on Europe - Market size and forecast 2021-2026 ($ million)
- Exhibit 55: Data Table on Europe - Market size and forecast 2021-2026 ($ million)
- Exhibit 56: Chart on Europe - Year-over-year growth 2021-2026 (%)
- Exhibit 57: Data Table on Europe - Year-over-year growth 2021-2026 (%)
- 7.5 APAC - Market size and forecast 2021-2026
- Exhibit 58: Chart on APAC - Market size and forecast 2021-2026 ($ million)
- Exhibit 59: Data Table on APAC - Market size and forecast 2021-2026 ($ million)
- Exhibit 60: Chart on APAC - Year-over-year growth 2021-2026 (%)
- Exhibit 61: Data Table on APAC - Year-over-year growth 2021-2026 (%)
- 7.6 Middle East and Africa - Market size and forecast 2021-2026
- Exhibit 62: Chart on Middle East and Africa - Market size and forecast 2021-2026 ($ million)
- Exhibit 63: Data Table on Middle East and Africa - Market size and forecast 2021-2026 ($ million)
- Exhibit 64: Chart on Middle East and Africa - Year-over-year growth 2021-2026 (%)
- Exhibit 65: Data Table on Middle East and Africa - Year-over-year growth 2021-2026 (%)
- 7.7 South America - Market size and forecast 2021-2026
- Exhibit 66: Chart on South America - Market size and forecast 2021-2026 ($ million)
- Exhibit 67: Data Table on South America - Market size and forecast 2021-2026 ($ million)
- Exhibit 68: Chart on South America - Year-over-year growth 2021-2026 (%)
- Exhibit 69: Data Table on South America - Year-over-year growth 2021-2026 (%)
- 7.8 US - Market size and forecast 2021-2026
- Exhibit 70: Chart on US - Market size and forecast 2021-2026 ($ million)
- Exhibit 71: Data Table on US - Market size and forecast 2021-2026 ($ million)
- Exhibit 72: Chart on US - Year-over-year growth 2021-2026 (%)
- Exhibit 73: Data Table on US - Year-over-year growth 2021-2026 (%)
- 7.9 Germany - Market size and forecast 2021-2026
- Exhibit 74: Chart on Germany - Market size and forecast 2021-2026 ($ million)
- Exhibit 75: Data Table on Germany - Market size and forecast 2021-2026 ($ million)
- Exhibit 76: Chart on Germany - Year-over-year growth 2021-2026 (%)
- Exhibit 77: Data Table on Germany - Year-over-year growth 2021-2026 (%)
- 7.10 China - Market size and forecast 2021-2026
- Exhibit 78: Chart on China - Market size and forecast 2021-2026 ($ million)
- Exhibit 79: Data Table on China - Market size and forecast 2021-2026 ($ million)
- Exhibit 80: Chart on China - Year-over-year growth 2021-2026 (%)
- Exhibit 81: Data Table on China - Year-over-year growth 2021-2026 (%)
- 7.11 France - Market size and forecast 2021-2026
- Exhibit 82: Chart on France - Market size and forecast 2021-2026 ($ million)
- Exhibit 83: Data Table on France - Market size and forecast 2021-2026 ($ million)
- Exhibit 84: Chart on France - Year-over-year growth 2021-2026 (%)
- Exhibit 85: Data Table on France - Year-over-year growth 2021-2026 (%)
- 7.12 India - Market size and forecast 2021-2026
- Exhibit 86: Chart on India - Market size and forecast 2021-2026 ($ million)
- Exhibit 87: Data Table on India - Market size and forecast 2021-2026 ($ million)
- Exhibit 88: Chart on India - Year-over-year growth 2021-2026 (%)
- Exhibit 89: Data Table on India - Year-over-year growth 2021-2026 (%)
- 7.13 Market opportunity by geography
- Exhibit 90: Market opportunity by geography ($ million)
8 Drivers, Challenges, and Trends
- 8.1 Market drivers
- 8.2 Market challenges
- 8.3 Impact of drivers and challenges
- Exhibit 91: Impact of drivers and challenges in 2021 and 2026
- 8.4 Market trends
9 Vendor Landscape
- 9.1 Overview
- 9.2 Vendor landscape
- Exhibit 92: Overview on Criticality of inputs and Factors of differentiation
- 9.3 Landscape disruption
- Exhibit 93: Overview on factors of disruption
- 9.4 Industry risks
- Exhibit 94: Impact of key risks on business
10 Vendor Analysis
- 10.1 Vendors covered
- Exhibit 95: Vendors covered
- 10.2 Market positioning of vendors
- Exhibit 96: Matrix on vendor position and classification
- 10.3 Anticimex International AB
- Exhibit 97: Anticimex International AB - Overview
- Exhibit 98: Anticimex International AB - Business segments
- Exhibit 99: Anticimex International AB - Key offerings
- Exhibit 100: Anticimex International AB - Segment focus
- 10.4 Aptive Environmental LLC
- Exhibit 101: Aptive Environmental LLC - Overview
- Exhibit 102: Aptive Environmental LLC - Product / Service
- Exhibit 103: Aptive Environmental LLC - Key offerings
- 10.5 Arrow Exterminators Inc
- Exhibit 104: Arrow Exterminators Inc - Overview
- Exhibit 105: Arrow Exterminators Inc - Product / Service
- Exhibit 106: Arrow Exterminators Inc - Key offerings
- 10.6 BASF SE
- Exhibit 107: BASF SE - Overview
- Exhibit 108: BASF SE - Business segments
- Exhibit 109: BASF SE - Key news
- Exhibit 110: BASF SE - Key offerings
- Exhibit 111: BASF SE - Segment focus
- 10.7 China National Chemical Corp. Ltd.
- Exhibit 112: China National Chemical Corp. Ltd. - Overview
- Exhibit 113: China National Chemical Corp. Ltd. - Product / Service
- Exhibit 114: China National Chemical Corp. Ltd. - Key offerings
- 10.8 Ecolab Inc.
- Exhibit 115: Ecolab Inc. - Overview
- Exhibit 116: Ecolab Inc. - Business segments
- Exhibit 117: Ecolab Inc. - Key news
- Exhibit 118: Ecolab Inc. - Key offerings
- Exhibit 119: Ecolab Inc. - Segment focus
- 10.9 FMC Corp.
- Exhibit 120: FMC Corp. - Overview
- Exhibit 121: FMC Corp. - Product / Service
- Exhibit 122: FMC Corp. - Key offerings
- 10.10 Massey Services Inc.
- Exhibit 123: Massey Services Inc. - Overview
- Exhibit 124: Massey Services Inc. - Product / Service
- Exhibit 125: Massey Services Inc. - Key offerings
- 10.11 Rentokil Initial Plc
- Exhibit 126: Rentokil Initial Plc - Overview
- Exhibit 127: Rentokil Initial Plc - Business segments
- Exhibit 128: Rentokil Initial Plc - Key offerings
- Exhibit 129: Rentokil Initial Plc - Segment focus
- 10.12 Sumitomo Chemical Co. Ltd.
- Exhibit 130: Sumitomo Chemical Co. Ltd. - Overview
- Exhibit 131: Sumitomo Chemical Co. Ltd. - Business segments
- Exhibit 132: Sumitomo Chemical Co. Ltd. - Key offerings
- Exhibit 133: Sumitomo Chemical Co. Ltd. - Segment focus
11 Appendix
- 11.1 Scope of the report
- 11.2 Inclusions and exclusions checklist
- Exhibit 134: Inclusions checklist
- Exhibit 135: Exclusions checklist
- 11.3 Currency conversion rates for US$
- Exhibit 136: Currency conversion rates for US$
- 11.4 Research methodology
- Exhibit 137: Research methodology
- Exhibit 138: Validation techniques employed for market sizing
- Exhibit 139: Information sources
- 11.5 List of abbreviations
- Exhibit 140: List of abbreviations
Technavio is a leading global technology research and advisory company. Their research and analysis focus on emerging market trends and provide actionable insights to help businesses identify market opportunities and develop effective strategies to optimize their market positions. With over 500 specialized analysts, Technavio's report library consists of more than 17,000 reports and counting, covering 800 technologies, spanning 50 countries. Their client base consists of enterprises of all sizes, including more than 100 Fortune 500 companies. This growing client base relies on Technavio's comprehensive coverage, extensive research, and actionable market insights to identify opportunities in existing and potential markets and assess their competitive positions within changing market scenarios.
Contact
Technavio Research
Jesse Maida
Media & Marketing Executive
US: +1 844 364 1100
UK: +44 203 893 3200
Email: media@technavio.com
Website: www.technavio.com/


SOURCE Technavio
© 2024 Benzinga.com. Benzinga does not provide investment advice. All rights reserved.
Trade confidently with insights and alerts from analyst ratings, free reports and breaking news that affects the stocks you care about.

