


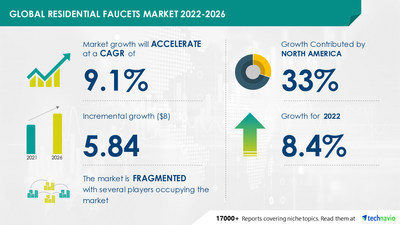
NEW YORK, Oct. 17, 2022 /PRNewswire/ -- The residential faucets market size is expected to grow by USD 5.84 billion, accelerating at a CAGR of 9.1% between 2021 and 2026. The report identifies CERA Sanitaryware Ltd, Delta Faucet Co., Fortune Brands Home and Security Inc., Kingston Brass Inc., Kohler Co., Kraus USA Inc., LIXIL Corp., LIXIL Water Technology Americas., Lowes Companies Inc., Masco Corp., Moen Inc., Oras Ltd., Spectrum Brands Holdings Inc., The Jaquar Group., Toto Ltd., Ultra Faucets, VIGO INDUSTRIES LLC., and Zurn Water Solutions Corp. among others as the dominant player in the market. The report provides a comprehensive analysis of the market size, vendor landscape, new product launches, key strategies adopted by vendors, and much more Request a free sample report.

The market is driven by product premiumization through product innovation and wide product assortment. The market for residential faucets, especially in the kitchen and bathroom segments, is gradually synchronizing with changing customer needs and aspirations, which has made vendors in the global residential faucets market consistently create innovations in fittings, including residential faucet products. Thus, product innovation and wide product assortment lead to the premiumization of products, which is responsible for driving the price quotient of the residential faucets during the forecast period.
Although product premiumization through product innovation and wide product assortment will create significant growth opportunities for vendors. However, an increase in raw material and labor costs will reduce the growth potential in the market. Metallic raw goods and components parts for manufacturing residential faucets are expensive. Hence, the cost of manufacture increases with a rise in the price of metals such as aluminum, iron, copper, or other raw materials. This affects the profit margins of manufacturers and retailers. The average cost of labor across the world is also on the rise. Owing to these factors, the increase in raw material and labor costs is expected to hinder the growth of the market in focus during the forecast period. To know more about Drivers, challenges and trends Request a free sample report.
Major Five Residential Faucets Companies:
- CERA Sanitaryware Ltd
- Delta Faucet Co
- Fortune Brands Home and Security Inc
- Kingston Brass Inc
- Kohler Co.
- Kraus USA Inc
- LIXIL Corp
- LIXIL Water Technology Americas
- Lowes Companies Inc
- Masco Corp.
- Moen Inc.
- Oras Ltd
- Spectrum Brands Holdings Inc.
- The Jaquar Group
- Toto Ltd
- Ultra-Faucets
- VIGO INDUSTRIES LLC
- Zurn Water Solutions Corp
Residential Faucets Market Application Outlook (Revenue, USD bn, 2021-2026)
- Bathroom faucets - size and forecast 2021-2026
- Kitchen faucets - size and forecast 2021-2026
The residential faucets market share growth in the bathroom faucets segment will be significant during the forecast period. In developed economies, such as the US, the UK, and Germany, the market in focus is witnessing a demand for premium products from consumers. In developing countries such as China and India, volume sales of residential faucets are gaining traction. Owing to these factors, the increasing demand for the bathroom faucets segment is expected to fuel the growth of the global residential faucets market during the forecast period.
Residential Faucets Market Geography Outlook (Revenue, USD bn, 2021-2026)
- North America - size and forecast 2021-2026
- APAC – size, and forecast 2021-2026
- Europe – size, and forecast 2021-2026
- Middle East and Africa - size and forecast 2021-2026
- South America - size and forecast 2021-2026
33% of the market's growth will originate from North America during the forecast period. The construction of residential buildings, houses, and societies has triggered the demand for home improvement and, in turn, will facilitate the residential faucets market growth in North America over the forecast period. To know more about the segment Request a free sample report.
Related Reports:
- Global Portable Air Purifier Market 2022-2026: The global portable air purifier market is segmented by application (residential and commercial) and geography (APAC, North America, Europe, South America, and Middle East and Africa). The residential segment will have the largest share of the market. By geography, APAC will emerge as the dominant market. View Report Snapshot Here.
- Global Saw Blades Market 2022-2026: The global saw blades market is segmented by product (stone cutting saw blades, circular saw blades, band saw blades, chain saw blades, and others) and geography (Europe, APAC, North America, Middle East, and Africa, and South America). The stone cutting saw blades have the largest share of the market. By Geography, Europe will emerge as the dominant market. View Report Snapshot Here.
Residential Faucets Market Scope | |
Report Coverage | Details |
Page number | 120 |
Base year | 2021 |
Forecast period | 2022-2026 |
Growth momentum & CAGR | Accelerate at a CAGR of 9.1% |
Market growth 2022-2026 | USD 5.84 billion |
Market structure | Fragmented |
YoY growth (%) | 8.4 |
Regional analysis | North America, APAC, Europe, Middle East and Africa, and South America |
Performing market contribution | North America at 33% |
Key consumer countries | US, China, Japan, Russia, and UK |
Competitive landscape | Leading companies, competitive strategies, consumer engagement scope |
Companies profiled | CERA Sanitaryware Ltd, Delta Faucet Co, Fortune Brands Home and Security Inc, Kingston Brass Inc, Kohler Co., Kraus USA Inc, LIXIL Corp, LIXIL Water Technology Americas, Lowes Companies Inc, Masco Corp., Moen Inc., Oras Ltd, Spectrum Brands Holdings Inc., The Jaquar Group, Toto Ltd, Ultra Faucets, VIGO INDUSTRIES LLC, and Zurn Water Solutions Corp |
Market Dynamics | Parent market analysis, Market growth inducers and obstacles, Fast-growing and slow-growing segment analysis, COVID-19 impact and future consumer dynamics, and market condition analysis for the forecast period. |
Customization purview | If our report has not included the data that you are looking for, you can reach out to our analysts and get segments customized. |
Table of contents:
1 Executive Summary
- 1.1 Market overview
- Exhibit 01: Executive Summary – Chart on Market Overview
- Exhibit 02: Executive Summary – Data Table on Market Overview
- Exhibit 03: Executive Summary – Chart on Global Market Characteristics
- Exhibit 04: Executive Summary – Chart on Market by Geography
- Exhibit 05: Executive Summary – Chart on Market Segmentation by Application
- Exhibit 06: Executive Summary – Chart on Incremental Growth
- Exhibit 07: Executive Summary – Data Table on Incremental Growth
- Exhibit 08: Executive Summary – Chart on Vendor Market Positioning
2 Market Landscape
- 2.1 Market ecosystem
- Exhibit 09: Parent market
- Exhibit 10: Market Characteristics
3 Market Sizing
- 3.1 Market definition
- Exhibit 11: Offerings of vendors included in the market definition
- 3.2 Market segment analysis
- Exhibit 12: Market segments
- 3.3 Market size 2021
- 3.4 Market outlook: Forecast for 2021-2026
- Exhibit 13: Chart on Global - Market size and forecast 2021-2026 ($ million)
- Exhibit 14: Data Table on Global - Market size and forecast 2021-2026 ($ million)
- Exhibit 15: Chart on Global Market: Year-over-year growth 2021-2026 (%)
- Exhibit 16: Data Table on Global Market: Year-over-year growth 2021-2026 (%)
4 Five Forces Analysis
- 4.1 Five forces summary
- Exhibit 17: Five forces analysis - Comparison between 2021 and 2026
- 4.2 Bargaining power of buyers
- Exhibit 18: Chart on Bargaining power of buyers – Impact of key factors 2021 and 2026
- 4.3 Bargaining power of suppliers
- Exhibit 19: Bargaining power of suppliers – Impact of key factors in 2021 and 2026
- 4.4 Threat of new entrants
- Exhibit 20: Threat of new entrants – Impact of key factors in 2021 and 2026
- 4.5 Threat of substitutes
- Exhibit 21: Threat of substitutes – Impact of key factors in 2021 and 2026
- 4.6 Threat of rivalry
- Exhibit 22: Threat of rivalry – Impact of key factors in 2021 and 2026
- 4.7 Market condition
- Exhibit 23: Chart on Market condition - Five forces 2021 and 2026
5 Market Segmentation by Application
- 5.1 Market segments
- Exhibit 24: Chart on Application - Market share 2021-2026 (%)
- Exhibit 25: Data Table on Application - Market share 2021-2026 (%)
- 5.2 Comparison by Application
- Exhibit 26: Chart on Comparison by Application
- Exhibit 27: Data Table on Comparison by Application
- 5.3 Bathroom faucets - Market size and forecast 2021-2026
- Exhibit 28: Chart on Bathroom faucets - Market size and forecast 2021-2026 ($ million)
- Exhibit 29: Data Table on Bathroom faucets - Market size and forecast 2021-2026 ($ million)
- Exhibit 30: Chart on Bathroom faucets - Year-over-year growth 2021-2026 (%)
- Exhibit 31: Data Table on Bathroom faucets - Year-over-year growth 2021-2026 (%)
- 5.4 Kitchen faucets - Market size and forecast 2021-2026
- Exhibit 32: Chart on Kitchen faucets - Market size and forecast 2021-2026 ($ million)
- Exhibit 33: Data Table on Kitchen faucets - Market size and forecast 2021-2026 ($ million)
- Exhibit 34: Chart on Kitchen faucets - Year-over-year growth 2021-2026 (%)
- Exhibit 35: Data Table on Kitchen faucets - Year-over-year growth 2021-2026 (%)
- 5.5 Market opportunity by Application
- Exhibit 36: Market opportunity by Application ($ million)
6 Customer Landscape
- 6.1 Customer landscape overview
- Exhibit 37: Analysis of price sensitivity, lifecycle, customer purchase basket, adoption rates, and purchase criteria
7 Geographic Landscape
- 7.1 Geographic segmentation
- Exhibit 38: Chart on Market share by geography 2021-2026 (%)
- Exhibit 39: Data Table on Market share by geography 2021-2026 (%)
- 7.2 Geographic comparison
- Exhibit 40: Chart on Geographic comparison
- Exhibit 41: Data Table on Geographic comparison
- 7.3 North America - Market size and forecast 2021-2026
- Exhibit 42: Chart on North America - Market size and forecast 2021-2026 ($ million)
- Exhibit 43: Data Table on North America - Market size and forecast 2021-2026 ($ million)
- Exhibit 44: Chart on North America - Year-over-year growth 2021-2026 (%)
- Exhibit 45: Data Table on North America - Year-over-year growth 2021-2026 (%)
- 7.4 APAC - Market size and forecast 2021-2026
- Exhibit 46: Chart on APAC - Market size and forecast 2021-2026 ($ million)
- Exhibit 47: Data Table on APAC - Market size and forecast 2021-2026 ($ million)
- Exhibit 48: Chart on APAC - Year-over-year growth 2021-2026 (%)
- Exhibit 49: Data Table on APAC - Year-over-year growth 2021-2026 (%)
- 7.5 Europe - Market size and forecast 2021-2026
- Exhibit 50: Chart on Europe - Market size and forecast 2021-2026 ($ million)
- Exhibit 51: Data Table on Europe - Market size and forecast 2021-2026 ($ million)
- Exhibit 52: Chart on Europe - Year-over-year growth 2021-2026 (%)
- Exhibit 53: Data Table on Europe - Year-over-year growth 2021-2026 (%)
- 7.6 Middle East and Africa - Market size and forecast 2021-2026
- Exhibit 54: Chart on Middle East and Africa - Market size and forecast 2021-2026 ($ million)
- Exhibit 55: Data Table on Middle East and Africa - Market size and forecast 2021-2026 ($ million)
- Exhibit 56: Chart on Middle East and Africa - Year-over-year growth 2021-2026 (%)
- Exhibit 57: Data Table on Middle East and Africa - Year-over-year growth 2021-2026 (%)
- 7.7 South America - Market size and forecast 2021-2026
- Exhibit 58: Chart on South America - Market size and forecast 2021-2026 ($ million)
- Exhibit 59: Data Table on South America - Market size and forecast 2021-2026 ($ million)
- Exhibit 60: Chart on South America - Year-over-year growth 2021-2026 (%)
- Exhibit 61: Data Table on South America - Year-over-year growth 2021-2026 (%)
- 7.8 US - Market size and forecast 2021-2026
- Exhibit 62: Chart on US - Market size and forecast 2021-2026 ($ million)
- Exhibit 63: Data Table on US - Market size and forecast 2021-2026 ($ million)
- Exhibit 64: Chart on US - Year-over-year growth 2021-2026 (%)
- Exhibit 65: Data Table on US - Year-over-year growth 2021-2026 (%)
- 7.9 China - Market size and forecast 2021-2026
- Exhibit 66: Chart on China - Market size and forecast 2021-2026 ($ million)
- Exhibit 67: Data Table on China - Market size and forecast 2021-2026 ($ million)
- Exhibit 68: Chart on China - Year-over-year growth 2021-2026 (%)
- Exhibit 69: Data Table on China - Year-over-year growth 2021-2026 (%)
- 7.10 Russia - Market size and forecast 2021-2026
- Exhibit 70: Chart on Russia - Market size and forecast 2021-2026 ($ million)
- Exhibit 71: Data Table on Russia - Market size and forecast 2021-2026 ($ million)
- Exhibit 72: Chart on Russia - Year-over-year growth 2021-2026 (%)
- Exhibit 73: Data Table on Russia - Year-over-year growth 2021-2026 (%)
- 7.11 UK - Market size and forecast 2021-2026
- Exhibit 74: Chart on UK - Market size and forecast 2021-2026 ($ million)
- Exhibit 75: Data Table on UK - Market size and forecast 2021-2026 ($ million)
- Exhibit 76: Chart on UK - Year-over-year growth 2021-2026 (%)
- Exhibit 77: Data Table on UK - Year-over-year growth 2021-2026 (%)
- 7.12 Japan - Market size and forecast 2021-2026
- Exhibit 78: Chart on Japan - Market size and forecast 2021-2026 ($ million)
- Exhibit 79: Data Table on Japan - Market size and forecast 2021-2026 ($ million)
- Exhibit 80: Chart on Japan - Year-over-year growth 2021-2026 (%)
- Exhibit 81: Data Table on Japan - Year-over-year growth 2021-2026 (%)
- 7.13 Market opportunity by geography
- Exhibit 82: Market opportunity by geography ($ million)
8 Drivers, Challenges, and Trends
- 8.1 Market drivers
- 8.2 Market challenges
- 8.3 Impact of drivers and challenges
- Exhibit 83: Impact of drivers and challenges in 2021 and 2026
- 8.4 Market trends
9 Vendor Landscape
- 9.1 Overview
- 9.2 Vendor landscape
- Exhibit 84: Overview on Criticality of inputs and Factors of differentiation
- 9.3 Landscape disruption
- Exhibit 85: Overview on factors of disruption
- 9.4 Industry risks
- Exhibit 86: Impact of key risks on business
10 Vendor Analysis
- 10.1 Vendors covered
- Exhibit 87: Vendors covered
- 10.2 Market positioning of vendors
- Exhibit 88: Matrix on vendor position and classification
- 10.3 Delta Faucet Co
- Exhibit 89: Delta Faucet Co - Overview
- Exhibit 90: Delta Faucet Co - Product / Service
- Exhibit 91: Delta Faucet Co - Key offerings
- 10.4 Kingston Brass Inc
- Exhibit 92: Kingston Brass Inc - Overview
- Exhibit 93: Kingston Brass Inc - Product / Service
- Exhibit 94: Kingston Brass Inc - Key offerings
- 10.5 Kohler Co.
- Exhibit 95: Kohler Co. - Overview
- Exhibit 96: Kohler Co. - Product / Service
- Exhibit 97: Kohler Co. - Key news
- Exhibit 98: Kohler Co. - Key offerings
- 10.6 LIXIL Corp
- Exhibit 99: LIXIL Corp - Overview
- Exhibit 100: LIXIL Corp - Business segments
- Exhibit 101: LIXIL Corp - Key offerings
- Exhibit 102: LIXIL Corp - Segment focus
- 10.7 Masco Corp.
- Exhibit 103: Masco Corp. - Overview
- Exhibit 104: Masco Corp. - Business segments
- Exhibit 105: Masco Corp. - Key offerings
- Exhibit 106: Masco Corp. - Segment focus
- 10.8 Spectrum Brands Holdings Inc.
- Exhibit 107: Spectrum Brands Holdings Inc. - Overview
- Exhibit 108: Spectrum Brands Holdings Inc. - Business segments
- Exhibit 109: Spectrum Brands Holdings Inc. - Key news
- Exhibit 110: Spectrum Brands Holdings Inc. - Key offerings
- Exhibit 111: Spectrum Brands Holdings Inc. - Segment focus
- 10.9 The Jaquar Group
- Exhibit 112: The Jaquar Group - Overview
- Exhibit 113: The Jaquar Group - Product / Service
- Exhibit 114: The Jaquar Group - Key offerings
- 10.10 Ultra Faucets
- Exhibit 115: Ultra Faucets - Overview
- Exhibit 116: Ultra Faucets - Product / Service
- Exhibit 117: Ultra Faucets - Key offerings
- 10.11 VIGO INDUSTRIES LLC
- Exhibit 118: VIGO INDUSTRIES LLC - Overview
- Exhibit 119: VIGO INDUSTRIES LLC - Product / Service
- Exhibit 120: VIGO INDUSTRIES LLC - Key offerings
- 10.12 Zurn Water Solutions Corp
- Exhibit 121: Zurn Water Solutions Corp - Overview
- Exhibit 122: Zurn Water Solutions Corp - Product / Service
- Exhibit 123: Zurn Water Solutions Corp - Key offerings
11 Appendix
- 11.1 Scope of the report
- 11.2 Inclusions and exclusions checklist
- Exhibit 124: Inclusions checklist
- Exhibit 125: Exclusions checklist
- 11.3 Currency conversion rates for US$
- Exhibit 126: Currency conversion rates for US$
- 11.4 Research methodology
- Exhibit 127: Research methodology
- Exhibit 128: Validation techniques employed for market sizing
- Exhibit 129: Information sources
- 11.5 List of abbreviations
- Exhibit 130: List of abbreviations
About Technavio
Technavio is a leading global technology research and advisory company. Their research and analysis focus on emerging market trends and provide actionable insights to help businesses identify market opportunities and develop effective strategies to optimize their market positions.
With over 500 specialized analysts, Technavio's report library consists of more than 17,000 reports and counting, covering 800 technologies, spanning 50 countries. Their client base consists of enterprises of all sizes, including more than 100 Fortune 500 companies. This growing client base relies on Technavio's comprehensive coverage, extensive research, and actionable market insights to identify opportunities in existing and potential markets and assess their competitive positions within changing market scenarios.
Contacts
Technavio Research
Jesse Maida
Media & Marketing Executive
US: +1 844 364 1100
UK: +44 203 893 3200
Email: media@technavio.com
Website: www.technavio.com/


SOURCE Technavio
© 2024 Benzinga.com. Benzinga does not provide investment advice. All rights reserved.
Trade confidently with insights and alerts from analyst ratings, free reports and breaking news that affects the stocks you care about.

