


NEW YORK, Oct. 2, 2022 /PRNewswire/ -- The global hearing aids 3D printing devices market is fragmented due to the presence of several international and regional players. The vendors are adopting various strategies such as mergers and acquisitions, expansions, and partnerships to gain an edge in the market. They are also focusing on the development of new products to strengthen their presence among consumers. In addition, growing advances in technology and product innovation have increased the competition level in the market. The increasing demand for digital hearing aids is creating new opportunities for vendors to enter this market. With a large number of new entrants in the market, it is expected that the global hearing aids 3D printing devices market will be competitive during the forecast period.

Our full report provides a detailed analysis of the vendor landscape, the competitive scenario, the successful growth strategies adopted by various vendors, and much more. Download Free Sample Report before purchasing.
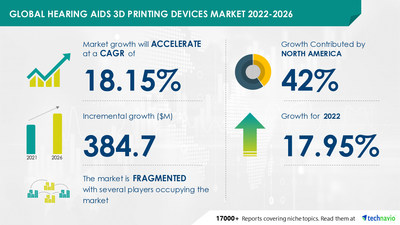
Technavio expects the market size to grow by USD 384.7 million, accelerating at a CAGR of 18.15% during the forecast period. According to the report, the market growth will be driven by factors such as the rising number of hearing aid patients, increasing public-private investment in 3D printing projects, and increasing adoption of 3D printing technology. This study identifies the integration of IoT as one of the prime trends in the market.
Technavio presents a detailed picture of the market by the way of study, synthesis, and summation of data from multiple sources. Our hearing aids 3D printing devices market report covers the following areas:
- Hearing Aids 3D Printing Devices Market Size
- Hearing Aids 3D Printing Devices Market Trends
- Hearing Aids 3D Printing Devices Market Industry Analysis
The report identifies the following as the dominant players in the market:
- 3D Systems Corp: The company offers 3D printing devices such as Figure 4 standalone, Figure 4 pro BLK 10, and Figure 4 rubber 65 k BLK.
- 3Shape AS: The company offers 3D printing devices such as 3Shape A2 audio scanner.
- Asiga: The company offers 3D printing devices such as Max UV and Pro 4K80 UV.
- Autodesk Inc: The company offers 3D printing devices such as within medical software that enables designers to create medical implants.
- Desktop Metal Inc.: The company offers 3D printing devices such as D4K, P4K, and Envision one.
- EOS GmbH Electro Optical Systems
- Formlabs Inc
- Groupe Gorge SA
- Materialise NV
- Rapid Shape GmbH
- Renishaw Plc
- Shining 3D Tech Co. Ltd
- Sonova AG
- Stratasys Ltd.
The global hearing aids 3D printing devices market is segmented as below:
- Product
- 3D Printing Services
- 3D Printing Materials
- 3D Printing Hardware
- 3D Printing Software
The market growth in the 3D printing services segment will be significant over the forecast period. The segment is driven by the increasing demand for hearing aids 3D printing hardware and software.
- Geography
- North America
- Europe
- APAC
- South America
- The Middle East and Africa
North America will dominate the growth of the market, occupying 42% of the global market share. The availability of improved healthcare infrastructure, the high adoption of 3D printing medical devices in healthcare facilities, and the presence of established vendors are driving the growth of the regional market. Also, the growing aging population is expected to contribute to the growth of the hearing aids 3D printed devices market in North America during the forecast period.
Identify key segments to invest in over the forecast period. Download Free Sample Report
We provide a detailed analysis of around 25 vendors operating in the hearing aids 3D printing devices market, including some of the key vendors. Backed with competitive intelligence and benchmarking, our research report on the hearing aids 3D printing devices market is designed to provide entry support, customer profile, and M&As as well as go-to-market strategy support.
- CAGR of the market during the forecast period 2022-2026
- Detailed information on factors that will assist hearing aids 3D printing devices market growth during the next five years
- Estimation of the hearing aids 3D printing devices market size and its contribution to the parent market
- Predictions on upcoming trends and changes in consumer behavior
- The growth of the hearing aids 3D printing devices market
- Analysis of the market's competitive landscape and detailed information on vendors
- Comprehensive details of factors that will challenge the growth of hearing aids 3D printing devices market vendors
- Bone-Anchored Hearing Aids Market by End-user and Geography - Forecast and Analysis 2021-2025
- Hearing Aid Market by Product and Geography - Forecast and Analysis 2021-2025
Hearing Aids 3D Printing Devices Market Scope | |
Report Coverage | Details |
Page number | 120 |
Base year | 2021 |
Forecast period | 2022-2026 |
Growth momentum & CAGR | Accelerate at a CAGR of 18.15% |
Market growth 2022-2026 | USD 384.7 million |
Market structure | Fragmented |
YoY growth (%) | 17.95 |
Regional analysis | North America, Europe, APAC, South America, and Middle East and Africa |
Performing market contribution | North America at 42% |
Key consumer countries | US, Japan, China, Germany, and France |
Competitive landscape | Leading companies, competitive strategies, consumer engagement scope |
Companies profiled | 3D Systems Corp, 3Shape AS, Asiga, Autodesk Inc, Desktop Metal Inc., EOS GmbH Electro Optical Systems, Formlabs Inc, Groupe Gorge SA, Materialise NV, Rapid Shape GmbH, Renishaw Plc, Shining 3D Tech Co. Ltd, Sonova AG, and Stratasys Ltd. |
Market Dynamics | Parent market analysis, Market growth inducers and obstacles, Fast-growing and slow-growing segment analysis, COVID-19 impact and future consumer dynamics, and market condition analysis for the forecast period. |
Customization purview | If our report has not included the data that you are looking for, you can reach out to our analysts and get segments customized. |
1 Executive Summary
- 1.1 Market overview
- Exhibit 01: Executive Summary – Chart on Market Overview
- Exhibit 02: Executive Summary – Data Table on Market Overview
- Exhibit 03: Executive Summary – Chart on Global Market Characteristics
- Exhibit 04: Executive Summary – Chart on Market by Geography
- Exhibit 05: Executive Summary – Chart on Market Segmentation by Product
- Exhibit 06: Executive Summary – Chart on Incremental Growth
- Exhibit 07: Executive Summary – Data Table on Incremental Growth
- Exhibit 08: Executive Summary – Chart on Vendor Market Positioning
2 Market Landscape
- 2.1 Market ecosystem
- Exhibit 09: Parent market
- Exhibit 10: Market Characteristics
3 Market Sizing
- 3.1 Market definition
- Exhibit 11: Offerings of vendors included in the market definition
- 3.2 Market segment analysis
- Exhibit 12: Market segments
- 3.3 Market size 2021
- 3.4 Market outlook: Forecast for 2021-2026
- Exhibit 13: Chart on Global - Market size and forecast 2021-2026 ($ million)
- Exhibit 14: Data Table on Global - Market size and forecast 2021-2026 ($ million)
- Exhibit 15: Chart on Global Market: Year-over-year growth 2021-2026 (%)
- Exhibit 16: Data Table on Global Market: Year-over-year growth 2021-2026 (%)
4 Five Forces Analysis
- 4.1 Five forces summary
- Exhibit 17: Five forces analysis - Comparison between 2021 and 2026
- 4.2 Bargaining power of buyers
- Exhibit 18: Chart on Bargaining power of buyers – Impact of key factors 2021 and 2026
- 4.3 Bargaining power of suppliers
- Exhibit 19: Bargaining power of suppliers – Impact of key factors in 2021 and 2026
- 4.4 Threat of new entrants
- Exhibit 20: Threat of new entrants – Impact of key factors in 2021 and 2026
- 4.5 Threat of substitutes
- Exhibit 21: Threat of substitutes – Impact of key factors in 2021 and 2026
- 4.6 Threat of rivalry
- Exhibit 22: Threat of rivalry – Impact of key factors in 2021 and 2026
- 4.7 Market condition
- Exhibit 23: Chart on Market condition - Five forces 2021 and 2026
5 Market Segmentation by Product
- 5.1 Market segments
- Exhibit 24: Chart on Product - Market share 2021-2026 (%)
- Exhibit 25: Data Table on Product - Market share 2021-2026 (%)
- 5.2 Comparison by Product
- Exhibit 26: Chart on Comparison by Product
- Exhibit 27: Data Table on Comparison by Product
- 5.3 3D printing services - Market size and forecast 2021-2026
- Exhibit 28: Chart on 3D printing services - Market size and forecast 2021-2026 ($ million)
- Exhibit 29: Data Table on 3D printing services - Market size and forecast 2021-2026 ($ million)
- Exhibit 30: Chart on 3D printing services - Year-over-year growth 2021-2026 (%)
- Exhibit 31: Data Table on 3D printing services - Year-over-year growth 2021-2026 (%)
- 5.4 3D printing materials - Market size and forecast 2021-2026
- Exhibit 32: Chart on 3D printing materials - Market size and forecast 2021-2026 ($ million)
- Exhibit 33: Data Table on 3D printing materials - Market size and forecast 2021-2026 ($ million)
- Exhibit 34: Chart on 3D printing materials - Year-over-year growth 2021-2026 (%)
- Exhibit 35: Data Table on 3D printing materials - Year-over-year growth 2021-2026 (%)
- 5.5 3D printing hardware - Market size and forecast 2021-2026
- Exhibit 36: Chart on 3D printing hardware - Market size and forecast 2021-2026 ($ million)
- Exhibit 37: Data Table on 3D printing hardware - Market size and forecast 2021-2026 ($ million)
- Exhibit 38: Chart on 3D printing hardware - Year-over-year growth 2021-2026 (%)
- Exhibit 39: Data Table on 3D printing hardware - Year-over-year growth 2021-2026 (%)
- 5.6 3D printing software - Market size and forecast 2021-2026
- Exhibit 40: Chart on 3D printing software - Market size and forecast 2021-2026 ($ million)
- Exhibit 41: Data Table on 3D printing software - Market size and forecast 2021-2026 ($ million)
- Exhibit 42: Chart on 3D printing software - Year-over-year growth 2021-2026 (%)
- Exhibit 43: Data Table on 3D printing software - Year-over-year growth 2021-2026 (%)
- 5.7 Market opportunity by Product
- Exhibit 44: Market opportunity by Product ($ million)
6 Customer Landscape
- 6.1 Customer landscape overview
- Exhibit 45: Analysis of price sensitivity, lifecycle, customer purchase basket, adoption rates, and purchase criteria
7 Geographic Landscape
- 7.1 Geographic segmentation
- Exhibit 46: Chart on Market share by geography 2021-2026 (%)
- Exhibit 47: Data Table on Market share by geography 2021-2026 (%)
- 7.2 Geographic comparison
- Exhibit 48: Chart on Geographic comparison
- Exhibit 49: Data Table on Geographic comparison
- 7.3 North America - Market size and forecast 2021-2026
- Exhibit 50: Chart on North America - Market size and forecast 2021-2026 ($ million)
- Exhibit 51: Data Table on North America - Market size and forecast 2021-2026 ($ million)
- Exhibit 52: Chart on North America - Year-over-year growth 2021-2026 (%)
- Exhibit 53: Data Table on North America - Year-over-year growth 2021-2026 (%)
- 7.4 Europe - Market size and forecast 2021-2026
- Exhibit 54: Chart on Europe - Market size and forecast 2021-2026 ($ million)
- Exhibit 55: Data Table on Europe - Market size and forecast 2021-2026 ($ million)
- Exhibit 56: Chart on Europe - Year-over-year growth 2021-2026 (%)
- Exhibit 57: Data Table on Europe - Year-over-year growth 2021-2026 (%)
- 7.5 APAC - Market size and forecast 2021-2026
- Exhibit 58: Chart on APAC - Market size and forecast 2021-2026 ($ million)
- Exhibit 59: Data Table on APAC - Market size and forecast 2021-2026 ($ million)
- Exhibit 60: Chart on APAC - Year-over-year growth 2021-2026 (%)
- Exhibit 61: Data Table on APAC - Year-over-year growth 2021-2026 (%)
- 7.6 South America - Market size and forecast 2021-2026
- Exhibit 62: Chart on South America - Market size and forecast 2021-2026 ($ million)
- Exhibit 63: Data Table on South America - Market size and forecast 2021-2026 ($ million)
- Exhibit 64: Chart on South America - Year-over-year growth 2021-2026 (%)
- Exhibit 65: Data Table on South America - Year-over-year growth 2021-2026 (%)
- 7.7 Middle East and Africa - Market size and forecast 2021-2026
- Exhibit 66: Chart on Middle East and Africa - Market size and forecast 2021-2026 ($ million)
- Exhibit 67: Data Table on Middle East and Africa - Market size and forecast 2021-2026 ($ million)
- Exhibit 68: Chart on Middle East and Africa - Year-over-year growth 2021-2026 (%)
- Exhibit 69: Data Table on Middle East and Africa - Year-over-year growth 2021-2026 (%)
- 7.8 US - Market size and forecast 2021-2026
- Exhibit 70: Chart on US - Market size and forecast 2021-2026 ($ million)
- Exhibit 71: Data Table on US - Market size and forecast 2021-2026 ($ million)
- Exhibit 72: Chart on US - Year-over-year growth 2021-2026 (%)
- Exhibit 73: Data Table on US - Year-over-year growth 2021-2026 (%)
- 7.9 Germany - Market size and forecast 2021-2026
- Exhibit 74: Chart on Germany - Market size and forecast 2021-2026 ($ million)
- Exhibit 75: Data Table on Germany - Market size and forecast 2021-2026 ($ million)
- Exhibit 76: Chart on Germany - Year-over-year growth 2021-2026 (%)
- Exhibit 77: Data Table on Germany - Year-over-year growth 2021-2026 (%)
- 7.10 France - Market size and forecast 2021-2026
- Exhibit 78: Chart on France - Market size and forecast 2021-2026 ($ million)
- Exhibit 79: Data Table on France - Market size and forecast 2021-2026 ($ million)
- Exhibit 80: Chart on France - Year-over-year growth 2021-2026 (%)
- Exhibit 81: Data Table on France - Year-over-year growth 2021-2026 (%)
- 7.11 Japan - Market size and forecast 2021-2026
- Exhibit 82: Chart on Japan - Market size and forecast 2021-2026 ($ million)
- Exhibit 83: Data Table on Japan - Market size and forecast 2021-2026 ($ million)
- Exhibit 84: Chart on Japan - Year-over-year growth 2021-2026 (%)
- Exhibit 85: Data Table on Japan - Year-over-year growth 2021-2026 (%)
- 7.12 China - Market size and forecast 2021-2026
- Exhibit 86: Chart on China - Market size and forecast 2021-2026 ($ million)
- Exhibit 87: Data Table on China - Market size and forecast 2021-2026 ($ million)
- Exhibit 88: Chart on China - Year-over-year growth 2021-2026 (%)
- Exhibit 89: Data Table on China - Year-over-year growth 2021-2026 (%)
- 7.13 Market opportunity by geography
- Exhibit 90: Market opportunity by geography ($ million)
8 Drivers, Challenges, and Trends
- 8.1 Market drivers
- 8.2 Market challenges
- 8.3 Impact of drivers and challenges
- Exhibit 91: Impact of drivers and challenges in 2021 and 2026
- 8.4 Market trends
9 Vendor Landscape
- 9.1 Overview
- 9.2 Vendor landscape
- Exhibit 92: Overview on Criticality of inputs and Factors of differentiation
- 9.3 Landscape disruption
- Exhibit 93: Overview on factors of disruption
- 9.4 Industry risks
- Exhibit 94: Impact of key risks on business
10 Vendor Analysis
- 10.1 Vendors covered
- Exhibit 95: Vendors covered
- 10.2 Market positioning of vendors
- Exhibit 96: Matrix on vendor position and classification
- 10.3 3D Systems Corp
- Exhibit 97: 3D Systems Corp - Overview
- Exhibit 98: 3D Systems Corp - Business segments
- Exhibit 99: 3D Systems Corp - Key news
- Exhibit 100: 3D Systems Corp - Key offerings
- Exhibit 101: 3D Systems Corp - Segment focus
- 10.4 3Shape AS
- Exhibit 102: 3Shape AS - Overview
- Exhibit 103: 3Shape AS - Product / Service
- Exhibit 104: 3Shape AS - Key offerings
- 10.5 Asiga
- Exhibit 105: Asiga - Overview
- Exhibit 106: Asiga - Product / Service
- Exhibit 107: Asiga - Key offerings
- 10.6 Autodesk Inc
- Exhibit 108: Autodesk Inc - Overview
- Exhibit 109: Autodesk Inc - Product / Service
- Exhibit 110: Autodesk Inc - Key news
- Exhibit 111: Autodesk Inc - Key offerings
- 10.7 Desktop Metal Inc.
- Exhibit 112: Desktop Metal Inc. - Overview
- Exhibit 113: Desktop Metal Inc. - Business segments
- Exhibit 114: Desktop Metal Inc. - Key news
- Exhibit 115: Desktop Metal Inc. - Key offerings
- Exhibit 116: Desktop Metal Inc. - Segment focus
- 10.8 Formlabs Inc
- Exhibit 117: Formlabs Inc - Overview
- Exhibit 118: Formlabs Inc - Product / Service
- Exhibit 119: Formlabs Inc - Key news
- Exhibit 120: Formlabs Inc - Key offerings
- 10.9 Groupe Gorge SA
- Exhibit 121: Groupe Gorge SA - Overview
- Exhibit 122: Groupe Gorge SA - Business segments
- Exhibit 123: Groupe Gorge SA - Key news
- Exhibit 124: Groupe Gorge SA - Key offerings
- Exhibit 125: Groupe Gorge SA - Segment focus
- 10.10 Materialise NV
- Exhibit 126: Materialise NV - Overview
- Exhibit 127: Materialise NV - Business segments
- Exhibit 128: Materialise NV - Key news
- Exhibit 129: Materialise NV - Key offerings
- Exhibit 130: Materialise NV - Segment focus
- 10.11 Rapid Shape GmbH
- Exhibit 131: Rapid Shape GmbH - Overview
- Exhibit 132: Rapid Shape GmbH - Key offerings
- 10.12 Shining 3D Tech Co. Ltd
- Exhibit 133: Shining 3D Tech Co. Ltd - Overview
- Exhibit 134: Shining 3D Tech Co. Ltd - Product / Service
- Exhibit 135: Shining 3D Tech Co. Ltd - Key offerings
11 Appendix
- 11.1 Scope of the report
- 11.2 Inclusions and exclusions checklist
- Exhibit 136: Inclusions checklist
- Exhibit 137: Exclusions checklist
- 11.3 Currency conversion rates for US$
- Exhibit 138: Currency conversion rates for US$
- 11.4 Research methodology
- Exhibit 139: Research methodology
- Exhibit 140: Validation techniques employed for market sizing
- Exhibit 141: Information sources
- 11.5 List of abbreviations
- Exhibit 142: List of abbreviations
Technavio is a leading global technology research and advisory company. Their research and analysis focus on emerging market trends and provides actionable insights to help businesses identify market opportunities and develop effective strategies to optimize their market positions. With over 500 specialized analysts, Technavio's report library consists of more than 17,000 reports and counting, covering 800 technologies, spanning across 50 countries. Their client base consists of enterprises of all sizes, including more than 100 Fortune 500 companies. This growing client base relies on Technavio's comprehensive coverage, extensive research, and actionable market insights to identify opportunities in existing and potential markets and assess their competitive positions within changing market scenarios.
Contact
Technavio Research
Jesse Maida
Media & Marketing Executive
US: +1 844 364 1100
UK: +44 203 893 3200
Email: media@technavio.com
Website: www.technavio.com/


SOURCE Technavio
© 2024 Benzinga.com. Benzinga does not provide investment advice. All rights reserved.
Trade confidently with insights and alerts from analyst ratings, free reports and breaking news that affects the stocks you care about.

