


NEW YORK, Sept. 25, 2022 /PRNewswire/ -- The "Chemoinformatics Market by Application and Geography - Forecast and Analysis 2022-2026" report has been added to Technavio's offering. With ISO 9001:2015 certification, Technavio is proudly partnering with more than 100 Fortune 500 companies for over 16 years.

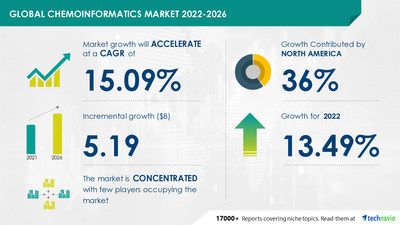
The potential growth difference for the chemoinformatics market between 2021 and 2026 is USD 5.19 billion. To estimate the size of the market, Technavio has considered various aspects including the number of users per hospital or clinic, on-premises vs cloud-based infrastructure preference in the healthcare industry, revenue generated by healthcare technology companies, disposable income, per capita income, healthcare budget and spending by government, among others. Understand the scope of our full report on the global chemoinformatics market. Download PDF Sample Report
- Market Driver
- Market Challenges
The increasing approvals of new molecules and biosimilars and the rise in digitalization in the pharmaceutical industry are some of the key market drivers. However, factors such as concerns related to data safety will challenge market growth.
The chemoinformatics market report is segmented by application (chemical analysis, drug discovery and validation, virtual screening, and others) and geography (North America, Europe, APAC, Middle East and Africa, and South America).
By application, the market will observe maximum growth in the chemical analysis segment during the forecast period. The rising R&D expenditure across the healthcare sector and the relatively low success rates of the promising leads as drug molecules are driving the growth of the segment.
In terms of region, the market will observe strong growth in North America. The region will account for 36% of the global market share over the forecast period. Factors such as the presence of improved healthcare infrastructure increased funding for research and development initiatives, and technological advancements in the healthcare sector in the US and Canada are driving the growth of the regional market.
Identify potential segments to invest in over the forecast period. Request Sample Report Here
The global chemoinformatics market is concentrated in nature. The competition in the market is intense, which is creating pricing pressure on various global and local vendors. Leading vendors are focusing on inorganic growth strategies by acquiring small and local players to broaden their product portfolio and capture new markets. They are also investing in R&D to enhance and upgrade their existing product portfolio and introduce innovative software with advanced technological features to have a competitive edge. Besides, the market is witnessing the entry of many new small and large players. This is expected to further intensify the competition in the market during the forecast period.
Technavio identifies the following as the dominant vendors in the market.
- Advanced Chemistry Development Inc.
- Altoris
- BioSolveIT GmbH
- Certara Inc.
- ChemAxon Ltd.
- Chemical Computing Group ULC
- Collaborative Drug Discovery Inc.
- Danaher Corp.
- Dassault Systemes SE
- Daylight Chemical Information Systems Inc.
- EPAM Systems Inc.
- Genedata AG
- Modgraph Consultants Ltd.
- Molinspiration Cheminformatics
- Molsoft LLC
- OpenEye Scientific Software Inc.
- PerkinElmer Inc.
- Scilligence Corp.
- Tecan Group Ltd.
- Laboratory Informatics Market by Component and Geography - Forecast and Analysis 2022-2026
- Bioinformatics Market by Product and Geography - Forecast and Analysis 2022-2026
Chemoinformatics Market Scope | |
Report Coverage | Details |
Page number | 120 |
Base year | 2021 |
Forecast period | 2022-2026 |
Growth momentum & CAGR | Accelerate at a CAGR of 15.09% |
Market growth 2022-2026 | USD 5.19 billion |
Market structure | Concentrated |
YoY growth (%) | 13.49 |
Regional analysis | North America, Europe, APAC, Middle East and Africa, and South America |
Performing market contribution | North America at 36% |
Key consumer countries | US, China, Germany, UK, and France |
Competitive landscape | Leading companies, competitive strategies, consumer engagement scope |
Companies profiled | Advanced Chemistry Development Inc., Altoris, BioSolveIT GmbH, Certara Inc., ChemAxon Ltd., Chemical Computing Group ULC, Collaborative Drug Discovery Inc., Danaher Corp., Dassault Systemes SE, Daylight Chemical Information Systems Inc., EPAM Systems Inc., Genedata AG, Modgraph Consultants Ltd., Molinspiration Cheminformatics, Molsoft LLC, OpenEye Scientific Software Inc., PerkinElmer Inc., Scilligence Corp., and Tecan Group Ltd. |
Market Dynamics | Parent market analysis, Market growth inducers and obstacles, Fast-growing and slow-growing segment analysis, COVID-19 impact and future consumer dynamics, and market condition analysis for the forecast period. |
Customization purview | If our report has not included the data that you are looking for, you can reach out to our analysts and get segments customized. |
1 Executive Summary
- 1.1 Market overview
- Exhibit 01: Executive Summary – Chart on Market Overview
- Exhibit 02: Executive Summary – Data Table on Market Overview
- Exhibit 03: Executive Summary – Chart on Global Market Characteristics
- Exhibit 04: Executive Summary – Chart on Market by Geography
- Exhibit 05: Executive Summary – Chart on Market Segmentation by Application
- Exhibit 06: Executive Summary – Chart on Incremental Growth
- Exhibit 07: Executive Summary – Data Table on Incremental Growth
- Exhibit 08: Executive Summary – Chart on Vendor Market Positioning
2 Market Landscape
- 2.1 Market ecosystem
- Exhibit 09: Parent market
- Exhibit 10: Market Characteristics
3 Market Sizing
- 3.1 Market definition
- Exhibit 11: Offerings of vendors included in the market definition
- 3.2 Market segment analysis
- Exhibit 12: Market segments
- 3.3 Market size 2021
- 3.4 Market outlook: Forecast for 2021-2026
- Exhibit 13: Chart on Global - Market size and forecast 2021-2026 ($ million)
- Exhibit 14: Data Table on Global - Market size and forecast 2021-2026 ($ million)
- Exhibit 15: Chart on Global Market: Year-over-year growth 2021-2026 (%)
- Exhibit 16: Data Table on Global Market: Year-over-year growth 2021-2026 (%)
4 Five Forces Analysis
- 4.1 Five forces summary
- Exhibit 17: Five forces analysis - Comparison between 2021 and 2026
- 4.2 Bargaining power of buyers
- Exhibit 18: Chart on Bargaining power of buyers – Impact of key factors 2021 and 2026
- 4.3 Bargaining power of suppliers
- Exhibit 19: Bargaining power of suppliers – Impact of key factors in 2021 and 2026
- 4.4 Threat of new entrants
- Exhibit 20: Threat of new entrants – Impact of key factors in 2021 and 2026
- 4.5 Threat of substitutes
- Exhibit 21: Threat of substitutes – Impact of key factors in 2021 and 2026
- 4.6 Threat of rivalry
- Exhibit 22: Threat of rivalry – Impact of key factors in 2021 and 2026
- 4.7 Market condition
- Exhibit 23: Chart on Market condition - Five forces 2021 and 2026
5 Market Segmentation by Application
- 5.1 Market segments
- Exhibit 24: Chart on Application - Market share 2021-2026 (%)
- Exhibit 25: Data Table on Application - Market share 2021-2026 (%)
- 5.2 Comparison by Application
- Exhibit 26: Chart on Comparison by Application
- Exhibit 27: Data Table on Comparison by Application
- 5.3 Chemical analysis - Market size and forecast 2021-2026
- Exhibit 28: Chart on Chemical analysis - Market size and forecast 2021-2026 ($ million)
- Exhibit 29: Data Table on Chemical analysis - Market size and forecast 2021-2026 ($ million)
- Exhibit 30: Chart on Chemical analysis - Year-over-year growth 2021-2026 (%)
- Exhibit 31: Data Table on Chemical analysis - Year-over-year growth 2021-2026 (%)
- 5.4 Drug discovery and validation - Market size and forecast 2021-2026
- Exhibit 32: Chart on Drug discovery and validation - Market size and forecast 2021-2026 ($ million)
- Exhibit 33: Data Table on Drug discovery and validation - Market size and forecast 2021-2026 ($ million)
- Exhibit 34: Chart on Drug discovery and validation - Year-over-year growth 2021-2026 (%)
- Exhibit 35: Data Table on Drug discovery and validation - Year-over-year growth 2021-2026 (%)
- 5.5 Virtual screening - Market size and forecast 2021-2026
- Exhibit 36: Chart on Virtual screening - Market size and forecast 2021-2026 ($ million)
- Exhibit 37: Data Table on Virtual screening - Market size and forecast 2021-2026 ($ million)
- Exhibit 38: Chart on Virtual screening - Year-over-year growth 2021-2026 (%)
- Exhibit 39: Data Table on Virtual screening - Year-over-year growth 2021-2026 (%)
- 5.6 Other - Market size and forecast 2021-2026
- Exhibit 40: Chart on Other - Market size and forecast 2021-2026 ($ million)
- Exhibit 41: Data Table on Other - Market size and forecast 2021-2026 ($ million)
- Exhibit 42: Chart on Other - Year-over-year growth 2021-2026 (%)
- Exhibit 43: Data Table on Other - Year-over-year growth 2021-2026 (%)
- 5.7 Market opportunity by Application
- Exhibit 44: Market opportunity by Application ($ million)
6 Customer Landscape
- 6.1 Customer landscape overview
- Exhibit 45: Analysis of price sensitivity, lifecycle, customer purchase basket, adoption rates, and purchase criteria
7 Geographic Landscape
- 7.1 Geographic segmentation
- Exhibit 46: Chart on Market share by geography 2021-2026 (%)
- Exhibit 47: Data Table on Market share by geography 2021-2026 (%)
- 7.2 Geographic comparison
- Exhibit 48: Chart on Geographic comparison
- Exhibit 49: Data Table on Geographic comparison
- 7.3 North America - Market size and forecast 2021-2026
- Exhibit 50: Chart on North America - Market size and forecast 2021-2026 ($ million)
- Exhibit 51: Data Table on North America - Market size and forecast 2021-2026 ($ million)
- Exhibit 52: Chart on North America - Year-over-year growth 2021-2026 (%)
- Exhibit 53: Data Table on North America - Year-over-year growth 2021-2026 (%)
- 7.4 Europe - Market size and forecast 2021-2026
- Exhibit 54: Chart on Europe - Market size and forecast 2021-2026 ($ million)
- Exhibit 55: Data Table on Europe - Market size and forecast 2021-2026 ($ million)
- Exhibit 56: Chart on Europe - Year-over-year growth 2021-2026 (%)
- Exhibit 57: Data Table on Europe - Year-over-year growth 2021-2026 (%)
- 7.5 APAC - Market size and forecast 2021-2026
- Exhibit 58: Chart on APAC - Market size and forecast 2021-2026 ($ million)
- Exhibit 59: Data Table on APAC - Market size and forecast 2021-2026 ($ million)
- Exhibit 60: Chart on APAC - Year-over-year growth 2021-2026 (%)
- Exhibit 61: Data Table on APAC - Year-over-year growth 2021-2026 (%)
- 7.6 Middle East and Africa - Market size and forecast 2021-2026
- Exhibit 62: Chart on Middle East and Africa - Market size and forecast 2021-2026 ($ million)
- Exhibit 63: Data Table on Middle East and Africa - Market size and forecast 2021-2026 ($ million)
- Exhibit 64: Chart on Middle East and Africa - Year-over-year growth 2021-2026 (%)
- Exhibit 65: Data Table on Middle East and Africa - Year-over-year growth 2021-2026 (%)
- 7.7 South America - Market size and forecast 2021-2026
- Exhibit 66: Chart on South America - Market size and forecast 2021-2026 ($ million)
- Exhibit 67: Data Table on South America - Market size and forecast 2021-2026 ($ million)
- Exhibit 68: Chart on South America - Year-over-year growth 2021-2026 (%)
- Exhibit 69: Data Table on South America - Year-over-year growth 2021-2026 (%)
- 7.8 US - Market size and forecast 2021-2026
- Exhibit 70: Chart on US - Market size and forecast 2021-2026 ($ million)
- Exhibit 71: Data Table on US - Market size and forecast 2021-2026 ($ million)
- Exhibit 72: Chart on US - Year-over-year growth 2021-2026 (%)
- Exhibit 73: Data Table on US - Year-over-year growth 2021-2026 (%)
- 7.9 China - Market size and forecast 2021-2026
- Exhibit 74: Chart on China - Market size and forecast 2021-2026 ($ million)
- Exhibit 75: Data Table on China - Market size and forecast 2021-2026 ($ million)
- Exhibit 76: Chart on China - Year-over-year growth 2021-2026 (%)
- Exhibit 77: Data Table on China - Year-over-year growth 2021-2026 (%)
- 7.10 Germany - Market size and forecast 2021-2026
- Exhibit 78: Chart on Germany - Market size and forecast 2021-2026 ($ million)
- Exhibit 79: Data Table on Germany - Market size and forecast 2021-2026 ($ million)
- Exhibit 80: Chart on Germany - Year-over-year growth 2021-2026 (%)
- Exhibit 81: Data Table on Germany - Year-over-year growth 2021-2026 (%)
- 7.11 UK - Market size and forecast 2021-2026
- Exhibit 82: Chart on UK - Market size and forecast 2021-2026 ($ million)
- Exhibit 83: Data Table on UK - Market size and forecast 2021-2026 ($ million)
- Exhibit 84: Chart on UK - Year-over-year growth 2021-2026 (%)
- Exhibit 85: Data Table on UK - Year-over-year growth 2021-2026 (%)
- 7.12 France - Market size and forecast 2021-2026
- Exhibit 86: Chart on France - Market size and forecast 2021-2026 ($ million)
- Exhibit 87: Data Table on France - Market size and forecast 2021-2026 ($ million)
- Exhibit 88: Chart on France - Year-over-year growth 2021-2026 (%)
- Exhibit 89: Data Table on France - Year-over-year growth 2021-2026 (%)
- 7.13 Market opportunity by geography
- Exhibit 90: Market opportunity by geography ($ million)
8 Drivers, Challenges, and Trends
- 8.1 Market drivers
- 8.2 Market challenges
- 8.3 Impact of drivers and challenges
- Exhibit 91: Impact of drivers and challenges in 2021 and 2026
- 8.4 Market trends
9 Vendor Landscape
- 9.1 Overview
- 9.2 Vendor landscape
- Exhibit 92: Overview on Criticality of inputs and Factors of differentiation
- 9.3 Landscape disruption
- Exhibit 93: Overview on factors of disruption
- 9.4 Industry risks
- Exhibit 94: Impact of key risks on business
10 Vendor Analysis
- 10.1 Vendors covered
- Exhibit 95: Vendors covered
- 10.2 Market positioning of vendors
- Exhibit 96: Matrix on vendor position and classification
- 10.3 Advanced Chemistry Development Inc.
- Exhibit 97: Advanced Chemistry Development Inc. - Overview
- Exhibit 98: Advanced Chemistry Development Inc. - Product / Service
- Exhibit 99: Advanced Chemistry Development Inc. - Key offerings
- 10.4 BioSolveIT GmbH
- Exhibit 100: BioSolveIT GmbH - Overview
- Exhibit 101: BioSolveIT GmbH - Product / Service
- Exhibit 102: BioSolveIT GmbH - Key offerings
- 10.5 ChemAxon Ltd.
- Exhibit 103: ChemAxon Ltd. - Overview
- Exhibit 104: ChemAxon Ltd. - Product / Service
- Exhibit 105: ChemAxon Ltd. - Key offerings
- 10.6 Chemical Computing Group ULC
- Exhibit 106: Chemical Computing Group ULC - Overview
- Exhibit 107: Chemical Computing Group ULC - Product / Service
- Exhibit 108: Chemical Computing Group ULC - Key offerings
- 10.7 Danaher Corp.
- Exhibit 109: Danaher Corp. - Overview
- Exhibit 110: Danaher Corp. - Business segments
- Exhibit 111: Danaher Corp. - Key news
- Exhibit 112: Danaher Corp. - Key offerings
- Exhibit 113: Danaher Corp. - Segment focus
- 10.8 Dassault Systemes SE
- Exhibit 114: Dassault Systemes SE - Overview
- Exhibit 115: Dassault Systemes SE - Product / Service
- Exhibit 116: Dassault Systemes SE - Key news
- Exhibit 117: Dassault Systemes SE - Key offerings
- 10.9 EPAM Systems Inc.
- Exhibit 118: EPAM Systems Inc. - Overview
- Exhibit 119: EPAM Systems Inc. - Business segments
- Exhibit 120: EPAM Systems Inc. - Key offerings
- Exhibit 121: EPAM Systems Inc. - Segment focus
- 10.10 Modgraph Consultants Ltd.
- Exhibit 122: Modgraph Consultants Ltd. - Overview
- Exhibit 123: Modgraph Consultants Ltd. - Product / Service
- Exhibit 124: Modgraph Consultants Ltd. - Key offerings
- 10.11 OpenEye Scientific Software Inc.
- Exhibit 125: OpenEye Scientific Software Inc. - Overview
- Exhibit 126: OpenEye Scientific Software Inc. - Product / Service
- Exhibit 127: OpenEye Scientific Software Inc. - Key offerings
- 10.12 Scilligence Corp.
- Exhibit 128: Scilligence Corp. - Overview
- Exhibit 129: Scilligence Corp. - Product / Service
- Exhibit 130: Scilligence Corp. - Key offerings
11 Appendix
- 11.1 Scope of the report
- 11.2 Inclusions and exclusions checklist
- Exhibit 131: Inclusions checklist
- Exhibit 132: Exclusions checklist
- 11.3 Currency conversion rates for US$
- Exhibit 133: Currency conversion rates for US$
- 11.4 Research methodology
- Exhibit 134: Research methodology
- Exhibit 135: Validation techniques employed for market sizing
- Exhibit 136: Information sources
- 11.5 List of abbreviations
- Exhibit 137: List of abbreviations
Technavio is a leading global technology research and advisory company. Their research and analysis focuses on emerging market trends and provides actionable insights to help businesses identify market opportunities and develop effective strategies to optimize their market positions.
With over 500 specialized analysts, Technavio's report library consists of more than 17,000 reports and counting, covering 800 technologies, spanning across 50 countries. Their client base consists of enterprises of all sizes, including more than 100 Fortune 500 companies. This growing client base relies on Technavio's comprehensive coverage, extensive research, and actionable market insights to identify opportunities in existing and potential markets and assess their competitive positions within changing market scenarios.
Contact
Technavio Research
Jesse Maida
Media & Marketing Executive
US: +1 844 364 1100
UK: +44 203 893 3200
Email:media@technavio.com
Website: www.technavio.com/


SOURCE Technavio
© 2024 Benzinga.com. Benzinga does not provide investment advice. All rights reserved.
Trade confidently with insights and alerts from analyst ratings, free reports and breaking news that affects the stocks you care about.

