


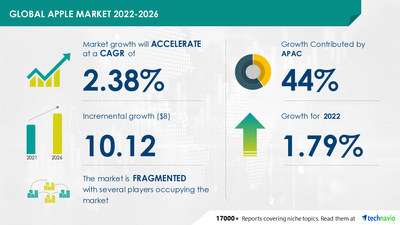
NEW YORK, Sept. 21, 2022 /PRNewswire/ -- The apple market size is expected to grow by USD 10.12 billion during 2021-2026, at a CAGR of 2.38% during the forecast period, according to Technavio. The increasing demand for superfoods, health benefits of apple, and product launches will offer immense growth opportunities. However, frequent product recalls will challenge the growth of the market participants.

To make the most of the opportunities, market vendors should focus more on the growth prospects in the fast-growing segments, while maintaining their positions in the slow-growing segments. Request Free Sample Report.
Apple Market Key Driver
One of the major factors influencing apple market growth is the rising demand for superfoods. Superfoods are extremely nutritious. Apples are considered one of the major superfoods because they contain a high concentration of antioxidants such as polyphenols and flavonoids, as well as fiber, potassium, and vitamin C.
These nutrients have a variety of health benefits, including improved skin and a reduction in cholesterol and diabetes. Apples, for example, are being incorporated into processed foods such as cookies, pastries, and cakes. As a result, rising global demand for processed foods is expected to drive apple demand during the forecast period. Download Free Sample Report.
Apple Market Segmentation
- Distribution Channel
- Offline
- Apple's market share in the offline segment will grow significantly. Consumers can choose from a wide variety of fresh fruits, including apples, through offline distribution channels, which makes the purchasing process easier. One of the major factors boosting apple sales through offline distribution channels will be an increase in the number of retailers offering apples under their brands.
- Online
- Geography
- APAC
- APAC will account for 44% of market growth. Turkey, China, and India are the most important apple markets in APAC. The market in this region will grow faster than the market in other regions. Consumers' growing awareness of the various health benefits of apples will aid apple market growth in APAC over the forecast period.
- Europe
- The Middle East and Africa
- North America
- South America
To know additional highlights and key points on various market segments and their impact in coming years, Buy Sample Report.
Apple Market Scope
Technavio presents a detailed picture of the market by the way of study, synthesis, and summation of data from multiple sources. Our apple market report covers the following areas:
- Apple Market size
- Apple Market trends
- Apple Market industry analysis
This study identifies the growing popularity of urban farming as one of the prime reasons driving the apple market growth during the next few years.
Related Reports:
Camel Meat Market by Product and Geography - Forecast and Analysis 2022-2026: The camel meat market share is expected to increase by USD 74.5 million from 2021 to 2026, and the market's growth momentum will accelerate at a CAGR of 5.26%.
Fresh Food Market by Product and Geography - Forecast and Analysis 2022-2026: The fresh food market share is expected to increase by 420.04 million tons from 2021 to 2026, and the market's growth momentum will accelerate at a CAGR of 3.04%.
Apple Market Scope | |
Report Coverage | Details |
Page number | 120 |
Base year | 2021 |
Forecast period | 2022-2026 |
Growth momentum & CAGR | Accelerate at a CAGR of 2.38% |
Market growth 2022-2026 | $ 10.12 billion |
Market structure | Fragmented |
YoY growth (%) | 1.79 |
Regional analysis | APAC, Europe, Middle East and Africa, North America, and South America |
Performing market contribution | APAC at 44% |
Key consumer countries | US, Turkey, China, India, and Germany |
Competitive landscape | Leading companies, competitive strategies, consumer engagement scope |
Companies profiled | Anderson Orchard, Auvil Fruit Co. Inc., Batlow Fruit Co. Pty Ltd, Borton and Sons, CMI Orchards LLC, Evans Fruit Co, Fowler Farms, Fruit Hill Orchard, Gebbers Farms, Gilbert Orchards, Hope Orchards, Kroger Co., Mercier Orchards, Roche Fruit, Shenandoah Valley Orchards, Singh Apple Orchards, Stemilt Growers LLC, Symms Fruit Ranch Inc, W. F. Montague Pty Ltd, and Washington Fruit Growers |
Market Dynamics | Parent market analysis, Market growth inducers and obstacles, Fast-growing and slow-growing segment analysis, COVID-19 impact and future consumer dynamics, and market condition analysis for the forecast period. |
Customization purview | If our report has not included the data that you are looking for, you can reach out to our analysts and get segments customized. |
Browse for Technavio "Consumer Staples" Research Reports
Table Of Contents:
1 Executive Summary
- 1.1 Market overview
- Exhibit 01: Executive Summary – Chart on Market Overview
- Exhibit 02: Executive Summary – Data Table on Market Overview
- Exhibit 03: Executive Summary – Chart on Global Market Characteristics
- Exhibit 04: Executive Summary – Chart on Market by Geography
- Exhibit 05: Executive Summary – Chart on Market Segmentation by Distribution Channel
- Exhibit 06: Executive Summary – Chart on Incremental Growth
- Exhibit 07: Executive Summary – Data Table on Incremental Growth
- Exhibit 08: Executive Summary – Chart on Vendor Market Positioning
2 Market Landscape
- 2.1 Market ecosystem
- Exhibit 09: Parent market
- Exhibit 10: Market Characteristics
3 Market Sizing
- 3.1 Market definition
- Exhibit 11: Offerings of vendors included in the market definition
- 3.2 Market segment analysis
- Exhibit 12: Market segments
- 3.3 Market size 2021
- 3.4 Market outlook: Forecast for 2021-2026
- Exhibit 13: Chart on Global - Market size and forecast 2021-2026 ($ billion)
- Exhibit 14: Data Table on Global - Market size and forecast 2021-2026 ($ billion)
- Exhibit 15: Chart on Global Market: Year-over-year growth 2021-2026 (%)
- Exhibit 16: Data Table on Global Market: Year-over-year growth 2021-2026 (%)
4 Five Forces Analysis
- 4.1 Five forces summary
- Exhibit 17: Five forces analysis - Comparison between 2021 and 2026
- 4.2 Bargaining power of buyers
- Exhibit 18: Chart on Bargaining power of buyers – Impact of key factors 2021 and 2026
- 4.3 Bargaining power of suppliers
- Exhibit 19: Bargaining power of suppliers – Impact of key factors in 2021 and 2026
- 4.4 Threat of new entrants
- Exhibit 20: Threat of new entrants – Impact of key factors in 2021 and 2026
- 4.5 Threat of substitutes
- Exhibit 21: Threat of substitutes – Impact of key factors in 2021 and 2026
- 4.6 Threat of rivalry
- Exhibit 22: Threat of rivalry – Impact of key factors in 2021 and 2026
- 4.7 Market condition
- Exhibit 23: Chart on Market condition - Five forces 2021 and 2026
5 Market Segmentation by Distribution Channel
- 5.1 Market segments
- Exhibit 24: Chart on Distribution Channel - Market share 2021-2026 (%)
- Exhibit 25: Data Table on Distribution Channel - Market share 2021-2026 (%)
- 5.2 Comparison by Distribution Channel
- Exhibit 26: Chart on Comparison by Distribution Channel
- Exhibit 27: Data Table on Comparison by Distribution Channel
- 5.3 Offline - Market size and forecast 2021-2026
- Exhibit 28: Chart on Offline - Market size and forecast 2021-2026 ($ billion)
- Exhibit 29: Data Table on Offline - Market size and forecast 2021-2026 ($ billion)
- Exhibit 30: Chart on Offline - Year-over-year growth 2021-2026 (%)
- Exhibit 31: Data Table on Offline - Year-over-year growth 2021-2026 (%)
- 5.4 Online - Market size and forecast 2021-2026
- Exhibit 32: Chart on Online - Market size and forecast 2021-2026 ($ billion)
- Exhibit 33: Data Table on Online - Market size and forecast 2021-2026 ($ billion)
- Exhibit 34: Chart on Online - Year-over-year growth 2021-2026 (%)
- Exhibit 35: Data Table on Online - Year-over-year growth 2021-2026 (%)
- 5.5 Market opportunity by Distribution Channel
- Exhibit 36: Market opportunity by Distribution Channel ($ billion)
6 Customer Landscape
- 6.1 Customer landscape overview
- Exhibit 37: Analysis of price sensitivity, lifecycle, customer purchase basket, adoption rates, and purchase criteria
7 Geographic Landscape
- 7.1 Geographic segmentation
- Exhibit 38: Chart on Market share by geography 2021-2026 (%)
- Exhibit 39: Data Table on Market share by geography 2021-2026 (%)
- 7.2 Geographic comparison
- Exhibit 40: Chart on Geographic comparison
- Exhibit 41: Data Table on Geographic comparison
- 7.3 APAC - Market size and forecast 2021-2026
- Exhibit 42: Chart on APAC - Market size and forecast 2021-2026 ($ billion)
- Exhibit 43: Data Table on APAC - Market size and forecast 2021-2026 ($ billion)
- Exhibit 44: Chart on APAC - Year-over-year growth 2021-2026 (%)
- Exhibit 45: Data Table on APAC - Year-over-year growth 2021-2026 (%)
- 7.4 Europe - Market size and forecast 2021-2026
- Exhibit 46: Chart on Europe - Market size and forecast 2021-2026 ($ billion)
- Exhibit 47: Data Table on Europe - Market size and forecast 2021-2026 ($ billion)
- Exhibit 48: Chart on Europe - Year-over-year growth 2021-2026 (%)
- Exhibit 49: Data Table on Europe - Year-over-year growth 2021-2026 (%)
- 7.5 Middle East and Africa - Market size and forecast 2021-2026
- Exhibit 50: Chart on Middle East and Africa - Market size and forecast 2021-2026 ($ billion)
- Exhibit 51: Data Table on Middle East and Africa - Market size and forecast 2021-2026 ($ billion)
- Exhibit 52: Chart on Middle East and Africa - Year-over-year growth 2021-2026 (%)
- Exhibit 53: Data Table on Middle East and Africa - Year-over-year growth 2021-2026 (%)
- 7.6 North America - Market size and forecast 2021-2026
- Exhibit 54: Chart on North America - Market size and forecast 2021-2026 ($ billion)
- Exhibit 55: Data Table on North America - Market size and forecast 2021-2026 ($ billion)
- Exhibit 56: Chart on North America - Year-over-year growth 2021-2026 (%)
- Exhibit 57: Data Table on North America - Year-over-year growth 2021-2026 (%)
- 7.7 South America - Market size and forecast 2021-2026
- Exhibit 58: Chart on South America - Market size and forecast 2021-2026 ($ billion)
- Exhibit 59: Data Table on South America - Market size and forecast 2021-2026 ($ billion)
- Exhibit 60: Chart on South America - Year-over-year growth 2021-2026 (%)
- Exhibit 61: Data Table on South America - Year-over-year growth 2021-2026 (%)
- 7.8 China - Market size and forecast 2021-2026
- Exhibit 62: Chart on China - Market size and forecast 2021-2026 ($ billion)
- Exhibit 63: Data Table on China - Market size and forecast 2021-2026 ($ billion)
- Exhibit 64: Chart on China - Year-over-year growth 2021-2026 (%)
- Exhibit 65: Data Table on China - Year-over-year growth 2021-2026 (%)
- 7.9 Germany - Market size and forecast 2021-2026
- Exhibit 66: Chart on Germany - Market size and forecast 2021-2026 ($ billion)
- Exhibit 67: Data Table on Germany - Market size and forecast 2021-2026 ($ billion)
- Exhibit 68: Chart on Germany - Year-over-year growth 2021-2026 (%)
- Exhibit 69: Data Table on Germany - Year-over-year growth 2021-2026 (%)
- 7.10 Turkey - Market size and forecast 2021-2026
- Exhibit 70: Chart on Turkey - Market size and forecast 2021-2026 ($ billion)
- Exhibit 71: Data Table on Turkey - Market size and forecast 2021-2026 ($ billion)
- Exhibit 72: Chart on Turkey - Year-over-year growth 2021-2026 (%)
- Exhibit 73: Data Table on Turkey - Year-over-year growth 2021-2026 (%)
- 7.11 US - Market size and forecast 2021-2026
- Exhibit 74: Chart on US - Market size and forecast 2021-2026 ($ billion)
- Exhibit 75: Data Table on US - Market size and forecast 2021-2026 ($ billion)
- Exhibit 76: Chart on US - Year-over-year growth 2021-2026 (%)
- Exhibit 77: Data Table on US - Year-over-year growth 2021-2026 (%)
- 7.12 India - Market size and forecast 2021-2026
- Exhibit 78: Chart on India - Market size and forecast 2021-2026 ($ billion)
- Exhibit 79: Data Table on India - Market size and forecast 2021-2026 ($ billion)
- Exhibit 80: Chart on India - Year-over-year growth 2021-2026 (%)
- Exhibit 81: Data Table on India - Year-over-year growth 2021-2026 (%)
- 7.13 Market opportunity by geography
- Exhibit 82: Market opportunity by geography ($ billion)
8 Drivers, Challenges, and Trends
- 8.1 Market drivers
- 8.2 Market challenges
- 8.3 Impact of drivers and challenges
- Exhibit 83: Impact of drivers and challenges in 2021 and 2026
- 8.4 Market trends
9 Vendor Landscape
- 9.1 Overview
- 9.2 Vendor landscape
- Exhibit 84: Overview on Criticality of inputs and Factors of differentiation
- 9.3 Landscape disruption
- Exhibit 85: Overview on factors of disruption
- 9.4 Industry risks
- Exhibit 86: Impact of key risks on business
10 Vendor Analysis
- 10.1 Vendors covered
- Exhibit 87: Vendors covered
- 10.2 Market positioning of vendors
- Exhibit 88: Matrix on vendor position and classification
- 10.3 Auvil Fruit Co. Inc.
- Exhibit 89: Auvil Fruit Co. Inc. - Overview
- Exhibit 90: Auvil Fruit Co. Inc. - Product / Service
- Exhibit 91: Auvil Fruit Co. Inc. - Key offerings
- 10.4 Borton and Sons
- Exhibit 92: Borton and Sons - Overview
- Exhibit 93: Borton and Sons - Product / Service
- Exhibit 94: Borton and Sons - Key offerings
- 10.5 Evans Fruit Co
- Exhibit 95: Evans Fruit Co - Overview
- Exhibit 96: Evans Fruit Co - Product / Service
- Exhibit 97: Evans Fruit Co - Key offerings
- 10.6 Fruit Hill Orchard
- Exhibit 98: Fruit Hill Orchard - Overview
- Exhibit 99: Fruit Hill Orchard - Product / Service
- Exhibit 100: Fruit Hill Orchard - Key offerings
- 10.7 Gebbers Farms
- Exhibit 101: Gebbers Farms - Overview
- Exhibit 102: Gebbers Farms - Product / Service
- Exhibit 103: Gebbers Farms - Key offerings
- 10.8 Gilbert Orchards
- Exhibit 104: Gilbert Orchards - Overview
- Exhibit 105: Gilbert Orchards - Product / Service
- Exhibit 106: Gilbert Orchards - Key offerings
- 10.9 Roche Fruit
- Exhibit 107: Roche Fruit - Overview
- Exhibit 108: Roche Fruit - Product / Service
- Exhibit 109: Roche Fruit - Key offerings
- 10.10 Stemilt Growers LLC
- Exhibit 110: Stemilt Growers LLC - Overview
- Exhibit 111: Stemilt Growers LLC - Product / Service
- Exhibit 112: Stemilt Growers LLC - Key offerings
- 10.11 Symms Fruit Ranch Inc
- Exhibit 113: Symms Fruit Ranch Inc - Overview
- Exhibit 114: Symms Fruit Ranch Inc - Product / Service
- Exhibit 115: Symms Fruit Ranch Inc - Key offerings
- 10.12 Washington Fruit Growers
- Exhibit 116: Washington Fruit Growers - Overview
- Exhibit 117: Washington Fruit Growers - Product / Service
- Exhibit 118: Washington Fruit Growers - Key offerings
11 Appendix
- 11.1 Scope of the report
- 11.2 Inclusions and exclusions checklist
- Exhibit 119: Inclusions checklist
- Exhibit 120: Exclusions checklist
- 11.3 Currency conversion rates for US$
- Exhibit 121: Currency conversion rates for US$
- 11.4 Research methodology
- Exhibit 122: Research methodology
- Exhibit 123: Validation techniques employed for market sizing
- Exhibit 124: Information sources
- 11.5 List of abbreviations
- Exhibit 125: List of abbreviations
Technavio is a leading global technology research and advisory company. Their research and analysis focus on emerging market trends and provides actionable insights to help businesses identify market opportunities and develop effective strategies to optimize their market positions. With over 500 specialized analysts, Technavio's report library consists of more than 17,000 reports and counting, covering 800 technologies, spanning across 50 countries. Their client base consists of enterprises of all sizes, including more than 100 Fortune 500 companies. This growing client base relies on Technavio's comprehensive coverage, extensive research, and actionable market insights to identify opportunities in existing and potential markets and assess their competitive positions within changing market scenarios.
Contact
Technavio Research
Jesse Maida
Media & Marketing Executive
US: +1 844 364 1100
UK: +44 203 893 3200
Email: media@technavio.com
Website: www.technavio.com/


SOURCE Technavio
© 2024 Benzinga.com. Benzinga does not provide investment advice. All rights reserved.
Trade confidently with insights and alerts from analyst ratings, free reports and breaking news that affects the stocks you care about.

