


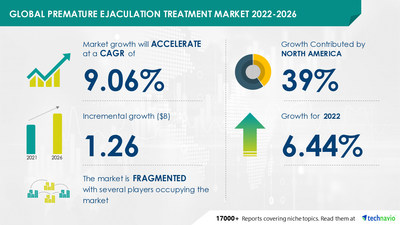
NEW YORK, Sept. 9, 2022 /PRNewswire/ -- The "Premature Ejaculation Treatment Market by Route of Administration (Oral and Topical), Drug Class (SSRIs, PDE5 inhibitors, Amide Anesthetics, and Others), and Geography (North America, Europe, Asia, and Rest of World (ROW)) - Forecast and Analysis 2022-2026" report has been added to Technavio's offering. The potential growth difference for the premature ejaculation treatment market size between 2021 and 2026 is USD 1.26 bn. To get the exact CAGR and the Y-O-Y growth rate, Request a FREE PDF Sample Report

- Market Driver: The high efficacy of off-label drugs is driving the growth of the market. The use of off-label drugs of different drug classes, including SSRIs and PDE5 inhibitors, has increased owing to their effectiveness in the treatment of premature ejaculation. In addition, according to some clinical studies, combining PDE5 inhibitors with SSRIs leads to better results in the treatment of premature ejaculation than using SSRIs alone. Thus, the high efficacy of these drugs is increasing their demand among end-users, which is contributing to the growth of the global premature ejaculation treatment market.
- Market Challenge: The availability of alternative treatment options is challenging the growth of the market. The rising number of premature ejaculation cases across the world has led to a growth in the number of alternative treatment methods for the disease. Some of the alternate treatment methods include homeopathy, psychotherapy, yoga, counseling, and herbal therapy. Some of these treatment options are believed to have little or no side effects when compared to mainstream premature ejaculation treatment drugs. Thus, the rising popularity of alternative premature ejaculation treatment options has hindered the growth of pharmacological therapies, which is posing a threat to market growth.
Technavio offers additional key drivers, trends, and challenges that will impact the growth of the market. Read our FREE PDF Sample Report right now!
By route of administration, the oral segment will be the largest contributor to market growth during the forecast period. These drugs are available in different forms, such as capsules, tablets, and liquids. The growth of this segment is attributed to factors such as the popularity and high preference for oral medication as the first line of treatment for premature ejaculation.
By geography, North America will be the leading region with 39% of the market's growth during the forecast period. The US is the key country for the premature ejaculation treatment market in North America. The growth of this region is attributed to factors such as a significant increase in the number of premature ejaculation cases. However, market growth in this region will be slower than the growth of the market in other regions.
View our FREE PDF sample report for additional insights into the contribution of all the segments and regional opportunities in the report.
- A. Menarini Industrie Farmaceutiche Riunite Srl
- Absorption Pharmaceuticals LLC
- Alembic Pharmaceuticals Inc.
- Amneal Pharmaceuticals Inc.
- ANI Pharmaceuticals Inc.
- Aytu BioPharma Inc.
- Bayer AG
- Cipla Ltd.
- Eli Lilly and Co.
- Endurance RP Ltd.
- GlaxoSmithKline Plc
- Johnson and Johnson
- Lupin Ltd.
- NeuroHealing Pharmaceuticals Inc.
- Novitium Pharma
- Pfizer Inc.
- Plethora Solutions Ltd.
- Sandoz International GmbH
- Solco Healthcare
- Teva Pharmaceutical Industries Ltd.
Want your report customized? Speak to an analyst and personalize your report according to your needs
Testosterone Replacement Therapy Market by, Product, and Geography - Forecast and Analysis 2022-2026
Sexual Enhancement Supplements Market by Product and Geography - Forecast and Analysis 2022-2026
Premature Ejaculation Treatment Market Scope | |
Report Coverage | Details |
Page number | 120 |
Base year | 2021 |
Forecast period | 2022-2026 |
Growth momentum & CAGR | Accelerate at a CAGR of 9.06% |
Market growth 2022-2026 | USD 1.26 billion |
Market structure | Fragmented |
YoY growth (%) | 6.44 |
Regional analysis | North America, Europe, Asia, and Rest of World (ROW) |
Performing market contribution | North America at 39% |
Key consumer countries | US, Italy, UK, China, and India |
Competitive landscape | Leading companies, competitive strategies, consumer engagement scope |
Companies profiled | A. Menarini Industrie Farmaceutiche Riunite Srl, Absorption Pharmaceuticals LLC, Alembic Pharmaceuticals Inc., Amneal Pharmaceuticals Inc., ANI Pharmaceuticals Inc., Aytu BioPharma Inc., Bayer AG, Cipla Ltd., Eli Lilly and Co., Endurance RP Ltd., GlaxoSmithKline Plc, Johnson and Johnson, Lupin Ltd., NeuroHealing Pharmaceuticals Inc., Novitium Pharma, Pfizer Inc., Plethora Solutions Ltd., Sandoz International GmbH, Solco Healthcare, and Teva Pharmaceutical Industries Ltd. |
Market Dynamics | Parent market analysis, market growth inducers and obstacles, fast-growing and slow-growing segment analysis, COVID-19 impact and future consumer dynamics, market condition analysis for forecast period. |
Customization purview | If our report has not included the data that you are looking for, you can reach out to our analysts and get segments customized. |
Browse Health Care Market Reports
1 Executive Summary
- 1.1 Market overview
- Exhibit 01: Executive Summary – Chart on Market Overview
- Exhibit 02: Executive Summary – Data Table on Market Overview
- Exhibit 03: Executive Summary – Chart on Global Market Characteristics
- Exhibit 04: Executive Summary – Chart on Market by Geography
- Exhibit 05: Executive Summary – Chart on Market Segmentation by Route of Administration
- Exhibit 06: Executive Summary – Chart on Market Segmentation by Drug Class
- Exhibit 07: Executive Summary – Chart on Incremental Growth
- Exhibit 08: Executive Summary – Data Table on Incremental Growth
- Exhibit 09: Executive Summary – Chart on Vendor Market Positioning
2 Market Landscape
- 2.1 Market ecosystem
- Exhibit 10: Parent market
- Exhibit 11: Market Characteristics
3 Market Sizing
- 3.1 Market definition
- Exhibit 12: Offerings of vendors included in the market definition
- 3.2 Market segment analysis
- Exhibit 13: Market segments
- 3.3 Market size 2021
- 3.4 Market outlook: Forecast for 2021-2026
- Exhibit 14: Chart on Global - Market size and forecast 2021-2026 ($ million)
- Exhibit 15: Data Table on Global - Market size and forecast 2021-2026 ($ million)
- Exhibit 16: Chart on Global Market: Year-over-year growth 2021-2026 (%)
- Exhibit 17: Data Table on Global Market: Year-over-year growth 2021-2026 (%)
4 Five Forces Analysis
- 4.1 Five forces summary
- Exhibit 18: Five forces analysis - Comparison between 2021 and 2026
- 4.2 Bargaining power of buyers
- Exhibit 19: Chart on Bargaining power of buyers – Impact of key factors 2021 and 2026
- 4.3 Bargaining power of suppliers
- Exhibit 20: Bargaining power of suppliers – Impact of key factors in 2021 and 2026
- 4.4 Threat of new entrants
- Exhibit 21: Threat of new entrants – Impact of key factors in 2021 and 2026
- 4.5 Threat of substitutes
- Exhibit 22: Threat of substitutes – Impact of key factors in 2021 and 2026
- 4.6 Threat of rivalry
- Exhibit 23: Threat of rivalry – Impact of key factors in 2021 and 2026
- 4.7 Market condition
- Exhibit 24: Chart on Market condition - Five forces 2021 and 2026
5 Market Segmentation by Route of Administration
- 5.1 Market segments
- Exhibit 25: Chart on Route of Administration - Market share 2021-2026 (%)
- Exhibit 26: Data Table on Route of Administration - Market share 2021-2026 (%)
- 5.2 Comparison by Route of Administration
- Exhibit 27: Chart on Comparison by Route of Administration
- Exhibit 28: Data Table on Comparison by Route of Administration
- 5.3 Oral - Market size and forecast 2021-2026
- Exhibit 29: Chart on Oral - Market size and forecast 2021-2026 ($ million)
- Exhibit 30: Data Table on Oral - Market size and forecast 2021-2026 ($ million)
- Exhibit 31: Chart on Oral - Year-over-year growth 2021-2026 (%)
- Exhibit 32: Data Table on Oral - Year-over-year growth 2021-2026 (%)
- 5.4 Topical - Market size and forecast 2021-2026
- Exhibit 33: Chart on Topical - Market size and forecast 2021-2026 ($ million)
- Exhibit 34: Data Table on Topical - Market size and forecast 2021-2026 ($ million)
- Exhibit 35: Chart on Topical - Year-over-year growth 2021-2026 (%)
- Exhibit 36: Data Table on Topical - Year-over-year growth 2021-2026 (%)
- 5.5 Market opportunity by Route of Administration
- Exhibit 37: Market opportunity by Route of Administration ($ million)
6 Market Segmentation by Drug Class
- 6.1 Market segments
- Exhibit 38: Chart on Drug Class - Market share 2021-2026 (%)
- Exhibit 39: Data Table on Drug Class - Market share 2021-2026 (%)
- 6.2 Comparison by Drug Class
- Exhibit 40: Chart on Comparison by Drug Class
- Exhibit 41: Data Table on Comparison by Drug Class
- 6.3 SSRIs - Market size and forecast 2021-2026
- Exhibit 42: Chart on SSRIs - Market size and forecast 2021-2026 ($ million)
- Exhibit 43: Data Table on SSRIs - Market size and forecast 2021-2026 ($ million)
- Exhibit 44: Chart on SSRIs - Year-over-year growth 2021-2026 (%)
- Exhibit 45: Data Table on SSRIs - Year-over-year growth 2021-2026 (%)
- 6.4 PDE5 inhibitors - Market size and forecast 2021-2026
- Exhibit 46: Chart on PDE5 inhibitors - Market size and forecast 2021-2026 ($ million)
- Exhibit 47: Data Table on PDE5 inhibitors - Market size and forecast 2021-2026 ($ million)
- Exhibit 48: Chart on PDE5 inhibitors - Year-over-year growth 2021-2026 (%)
- Exhibit 49: Data Table on PDE5 inhibitors - Year-over-year growth 2021-2026 (%)
- 6.5 Amide anesthetics - Market size and forecast 2021-2026
- Exhibit 50: Chart on Amide anesthetics - Market size and forecast 2021-2026 ($ million)
- Exhibit 51: Data Table on Amide anesthetics - Market size and forecast 2021-2026 ($ million)
- Exhibit 52: Chart on Amide anesthetics - Year-over-year growth 2021-2026 (%)
- Exhibit 53: Data Table on Amide anesthetics - Year-over-year growth 2021-2026 (%)
- 6.6 Others - Market size and forecast 2021-2026
- Exhibit 54: Chart on Others - Market size and forecast 2021-2026 ($ million)
- Exhibit 55: Data Table on Others - Market size and forecast 2021-2026 ($ million)
- Exhibit 56: Chart on Others - Year-over-year growth 2021-2026 (%)
- Exhibit 57: Data Table on Others - Year-over-year growth 2021-2026 (%)
- 6.7 Market opportunity by Drug Class
- Exhibit 58: Market opportunity by Drug Class ($ million)
7 Customer Landscape
- 7.1 Customer landscape overview
- Exhibit 59: Analysis of price sensitivity, lifecycle, customer purchase basket, adoption rates, and purchase criteria
8 Geographic Landscape
- 8.1 Geographic segmentation
- Exhibit 60: Chart on Market share by geography 2021-2026 (%)
- Exhibit 61: Data Table on Market share by geography 2021-2026 (%)
- 8.2 Geographic comparison
- Exhibit 62: Chart on Geographic comparison
- Exhibit 63: Data Table on Geographic comparison
- 8.3 North America - Market size and forecast 2021-2026
- Exhibit 64: Chart on North America - Market size and forecast 2021-2026 ($ million)
- Exhibit 65: Data Table on North America - Market size and forecast 2021-2026 ($ million)
- Exhibit 66: Chart on North America - Year-over-year growth 2021-2026 (%)
- Exhibit 67: Data Table on North America - Year-over-year growth 2021-2026 (%)
- 8.4 Europe - Market size and forecast 2021-2026
- Exhibit 68: Chart on Europe - Market size and forecast 2021-2026 ($ million)
- Exhibit 69: Data Table on Europe - Market size and forecast 2021-2026 ($ million)
- Exhibit 70: Chart on Europe - Year-over-year growth 2021-2026 (%)
- Exhibit 71: Data Table on Europe - Year-over-year growth 2021-2026 (%)
- 8.5 Asia - Market size and forecast 2021-2026
- Exhibit 72: Chart on Asia - Market size and forecast 2021-2026 ($ million)
- Exhibit 73: Data Table on Asia - Market size and forecast 2021-2026 ($ million)
- Exhibit 74: Chart on Asia - Year-over-year growth 2021-2026 (%)
- Exhibit 75: Data Table on Asia - Year-over-year growth 2021-2026 (%)
- 8.6 Rest of World (ROW) - Market size and forecast 2021-2026
- Exhibit 76: Chart on Rest of World (ROW) - Market size and forecast 2021-2026 ($ million)
- Exhibit 77: Data Table on Rest of World (ROW) - Market size and forecast 2021-2026 ($ million)
- Exhibit 78: Chart on Rest of World (ROW) - Year-over-year growth 2021-2026 (%)
- Exhibit 79: Data Table on Rest of World (ROW) - Year-over-year growth 2021-2026 (%)
- 8.7 US - Market size and forecast 2021-2026
- Exhibit 80: Chart on US - Market size and forecast 2021-2026 ($ million)
- Exhibit 81: Data Table on US - Market size and forecast 2021-2026 ($ million)
- Exhibit 82: Chart on US - Year-over-year growth 2021-2026 (%)
- Exhibit 83: Data Table on US - Year-over-year growth 2021-2026 (%)
- 8.8 Italy - Market size and forecast 2021-2026
- Exhibit 84: Chart on Italy - Market size and forecast 2021-2026 ($ million)
- Exhibit 85: Data Table on Italy - Market size and forecast 2021-2026 ($ million)
- Exhibit 86: Chart on Italy - Year-over-year growth 2021-2026 (%)
- Exhibit 87: Data Table on Italy - Year-over-year growth 2021-2026 (%)
- 8.9 China - Market size and forecast 2021-2026
- Exhibit 88: Chart on China - Market size and forecast 2021-2026 ($ million)
- Exhibit 89: Data Table on China - Market size and forecast 2021-2026 ($ million)
- Exhibit 90: Chart on China - Year-over-year growth 2021-2026 (%)
- Exhibit 91: Data Table on China - Year-over-year growth 2021-2026 (%)
- 8.10 UK - Market size and forecast 2021-2026
- Exhibit 92: Chart on UK - Market size and forecast 2021-2026 ($ million)
- Exhibit 93: Data Table on UK - Market size and forecast 2021-2026 ($ million)
- Exhibit 94: Chart on UK - Year-over-year growth 2021-2026 (%)
- Exhibit 95: Data Table on UK - Year-over-year growth 2021-2026 (%)
- 8.11 India - Market size and forecast 2021-2026
- Exhibit 96: Chart on India - Market size and forecast 2021-2026 ($ million)
- Exhibit 97: Data Table on India - Market size and forecast 2021-2026 ($ million)
- Exhibit 98: Chart on India - Year-over-year growth 2021-2026 (%)
- Exhibit 99: Data Table on India - Year-over-year growth 2021-2026 (%)
- 8.12 Market opportunity by geography
- Exhibit 100: Market opportunity by geography ($ million)
9 Drivers, Challenges, and Trends
- 9.1 Market drivers
- 9.2 Market challenges
- 9.3 Impact of drivers and challenges
- Exhibit 101: Impact of drivers and challenges in 2021 and 2026
- 9.4 Market trends
10 Vendor Landscape
- 10.1 Overview
- 10.2 Vendor landscape
- Exhibit 102: Overview on Criticality of inputs and Factors of differentiation
- 10.3 Landscape disruption
- Exhibit 103: Overview on factors of disruption
- 10.4 Industry risks
- Exhibit 104: Impact of key risks on business
11 Vendor Analysis
- 11.1 Vendors covered
- Exhibit 105: Vendors covered
- 11.2 Market positioning of vendors
- Exhibit 106: Matrix on vendor position and classification
- 11.3 Absorption Pharmaceuticals LLC
- Exhibit 107: Absorption Pharmaceuticals LLC - Overview
- Exhibit 108: Absorption Pharmaceuticals LLC - Product / Service
- Exhibit 109: Absorption Pharmaceuticals LLC - Key offerings
- 11.4 Alembic Pharmaceuticals Inc.
- Exhibit 110: Alembic Pharmaceuticals Inc. - Overview
- Exhibit 111: Alembic Pharmaceuticals Inc. - Product / Service
- Exhibit 112: Alembic Pharmaceuticals Inc. - Key offerings
- 11.5 Amneal Pharmaceuticals Inc.
- Exhibit 113: Amneal Pharmaceuticals Inc. - Overview
- Exhibit 114: Amneal Pharmaceuticals Inc. - Business segments
- Exhibit 115: Amneal Pharmaceuticals Inc. - Key news
- Exhibit 116: Amneal Pharmaceuticals Inc. - Key offerings
- Exhibit 117: Amneal Pharmaceuticals Inc. - Segment focus
- 11.6 Bayer AG
- Exhibit 118: Bayer AG - Overview
- Exhibit 119: Bayer AG - Business segments
- Exhibit 120: Bayer AG - Key offerings
- Exhibit 121: Bayer AG - Segment focus
- 11.7 Cipla Ltd.
- Exhibit 122: Cipla Ltd. - Overview
- Exhibit 123: Cipla Ltd. - Business segments
- Exhibit 124: Cipla Ltd. - Key news
- Exhibit 125: Cipla Ltd. - Key offerings
- Exhibit 126: Cipla Ltd. - Segment focus
- 11.8 Eli Lilly and Co.
- Exhibit 127: Eli Lilly and Co. - Overview
- Exhibit 128: Eli Lilly and Co. - Product / Service
- Exhibit 129: Eli Lilly and Co. - Key offerings
- 11.9 Pfizer Inc.
- Exhibit 130: Pfizer Inc. - Overview
- Exhibit 131: Pfizer Inc. - Product / Service
- Exhibit 132: Pfizer Inc. - Key news
- Exhibit 133: Pfizer Inc. - Key offerings
- 11.10 Sandoz International GmbH
- Exhibit 134: Sandoz International GmbH - Overview
- Exhibit 135: Sandoz International GmbH - Product / Service
- Exhibit 136: Sandoz International GmbH - Key news
- Exhibit 137: Sandoz International GmbH - Key offerings
- 11.11 Solco Healthcare
- Exhibit 138: Solco Healthcare - Overview
- Exhibit 139: Solco Healthcare - Product / Service
- Exhibit 140: Solco Healthcare - Key offerings
- 11.12 Teva Pharmaceutical Industries Ltd.
- Exhibit 141: Teva Pharmaceutical Industries Ltd. - Overview
- Exhibit 142: Teva Pharmaceutical Industries Ltd. - Business segments
- Exhibit 143: Teva Pharmaceutical Industries Ltd. - Key news
- Exhibit 144: Teva Pharmaceutical Industries Ltd. - Key offerings
- Exhibit 145: Teva Pharmaceutical Industries Ltd. - Segment focus
12 Appendix
- 12.1 Scope of the report
- 12.2 Inclusions and exclusions checklist
- Exhibit 146: Inclusions checklist
- Exhibit 147: Exclusions checklist
- 12.3 Currency conversion rates for US$
- Exhibit 148: Currency conversion rates for US$
- 12.4 Research methodology
- Exhibit 149: Research methodology
- Exhibit 150: Validation techniques employed for market sizing
- Exhibit 151: Information sources
- 12.5 List of abbreviations
- Exhibit 152: List of abbreviations
Technavio is a leading global technology research and advisory company. Their research and analysis focus on emerging market trends and provide actionable insights to help businesses identify market opportunities and develop effective strategies to optimize their market positions.
With over 500 specialized analysts, Technavio's report library consists of more than 17,000 reports and counting, covering 800 technologies, spanning across 50 countries. Their client base consists of enterprises of all sizes, including more than 100 Fortune 500 companies. This growing client base relies on Technavio's comprehensive coverage, extensive research, and actionable market insights to identify opportunities in existing and potential markets and assess their competitive positions within changing market scenarios.
Contact
Technavio Research
Jesse Maida
Media & Marketing Executive
US: +1 844 364 1100
UK: +44 203 893 3200
Email:media@technavio.com
Website: www.technavio.com/


SOURCE Technavio
© 2024 Benzinga.com. Benzinga does not provide investment advice. All rights reserved.
Trade confidently with insights and alerts from analyst ratings, free reports and breaking news that affects the stocks you care about.

