


NEW YORK, Sept. 5, 2022 /PRNewswire/ -- The commercial HVAC market will be driven by factors such as the rising number of data centers. Data centers comprise sensitive electronic components. Hence, the humidity, temperature, airflow, and hygiene should be maintained to prevent critical equipment failure. The equipment and machines used in data centers dissipate a significant amount of heat. HVAC systems ensure that server rooms are maintained at appropriate temperature and humidity levels. These factors will drive the commercial HVAC market growth during the forecast period.

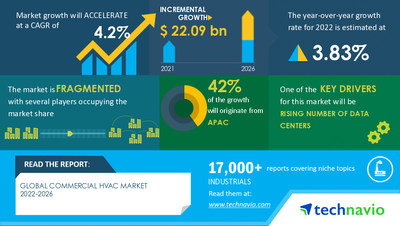
The global commercial HVAC market size is expected to grow by USD 22.09 bn from 2021 to 2026, according to Technavio. Moreover, the growth momentum of the market will accelerate at a CAGR of 4.2% during the forecast period.
Get a comprehensive report summary describing the market size and forecast along with research methodology. The FREE sample report is available in PDF format
The commercial HVAC market is fragmented, and the vendors are deploying organic and inorganic growth strategies to compete in the market. Carrier Global Corp., Daikin Industries Ltd., Emerson Electric Co., Haier Smart Home Co. Ltd., Hitachi Ltd., Honeywell International Inc., Ingersoll Rand Inc., Johnson Controls International Plc, Lennox International Inc., LG Electronics Inc., Mitsubishi Electric Corp., Paloma Co. Ltd., Panasonic Corp., Robert Bosch GmbH, Samsung Electronics Co. Ltd., Siemens AG, The Climate Control Group Inc., WaterFurnace International Inc., Edison Heating and Cooling, Farina Corp., among others, are the main players in the market. The key offerings of some of these vendors are listed below:
- Carrier Global Corp. - The company offers HVAC solutions for schools, dental offices, hospitals, and other commercial facilities.
- Daikin Industries Ltd. - The company offers various types of commercial air conditioners such as roof top, cassette, floor standing, and others.
- Lennox International Inc. - The company offers products Trane, Club Car, and Thermo King, which provide innovative solutions to optimize indoor environments through a broad portfolio of energy-efficient heating, ventilating, and air conditioning systems, parts support, and advanced controls for homes and commercial buildings.
- LG Electronics Inc. - The company offers YORK chillers, which help reduce energy consumption and emissions and create a more comfortable and sustainable building environment.
- Mitsubishi Electric Corp. - The company offers various commercial HVAC products such as packaged rooftop units, split systems, and heating products.
Get lifetime access to our Technavio Insights! Subscribe to our "Basic Plan" billed annually at USD 5000
- Equipment - size and forecast 2021-2026
- Services - size and forecast 2021-2026
- APAC - size and forecast 2021-2026
- North America - size and forecast 2021-2026
- Europe - size and forecast 2021-2026
- South America - size and forecast 2021-2026
- Middle East and Africa - size and forecast 2021-2026
Learn about the contribution of each segment summarized in concise infographics and thorough descriptions. View a FREE PDF Sample Report
The equipment segment will be the largest contributor to market growth during the forecast period. HVAC equipment includes heating equipment, ventilation equipment, and air conditioning equipment. Builders of new commercial spaces are focusing on design, architecture, and sustainable practices. Hence, they are adopting energy-saving systems such as LEDs, HVAC units, and renewable power generation sources in commercial spaces. Thus, the increasing adoption of HVAC equipment will drive the commercial HVAC market growth during the forecast period.
HVAC Valves Market by Type and Geography - Forecast and Analysis 2021-2025
Industrial HVAC Market by End-user and Geography - Forecast and Analysis 2021-2025
Commercial HVAC Market Scope | |
Report Coverage | Details |
Page number | 120 |
Base year | 2021 |
Forecast period | 2022-2026 |
Growth momentum & CAGR | Accelerate at a CAGR of 4.2% |
Market growth 2022-2026 | USD 22.09 billion |
Market structure | Fragmented |
YoY growth (%) | 3.83 |
Regional analysis | APAC, North America, Europe, South America, and Middle East and Africa |
Performing market contribution | APAC at 42% |
Key consumer countries | US, China, Japan, India, and UK |
Competitive landscape | Leading companies, Competitive strategies, Consumer engagement scope |
Key companies profiled | Carrier Global Corp., Daikin Industries Ltd., Emerson Electric Co., Haier Smart Home Co. Ltd., Hitachi Ltd., Honeywell International Inc., Ingersoll Rand Inc., Johnson Controls International Plc, Lennox International Inc., LG Electronics Inc., Mitsubishi Electric Corp., Paloma Co. Ltd., Panasonic Corp., Robert Bosch GmbH, Samsung Electronics Co. Ltd., Siemens AG, The Climate Control Group Inc., WaterFurnace International Inc., Edison Heating and Cooling, and Farina Corp. |
Market dynamics | Parent market analysis, market growth inducers and obstacles, fast-growing and slow-growing segment analysis, COVID-19 impact and recovery analysis and future consumer dynamics, and market condition analysis for the forecast period. |
Customization purview | If our report has not included the data that you are looking for, you can reach out to our analysts and get segments customized. |
Browse Industrials Market Reports
1 Executive Summary
- 1.1 Market overview
- Exhibit 01: Executive Summary – Chart on Market Overview
- Exhibit 02: Executive Summary – Data Table on Market Overview
- Exhibit 03: Executive Summary – Chart on Global Market Characteristics
- Exhibit 04: Executive Summary – Chart on Market by Geography
- Exhibit 05: Executive Summary – Chart on Market Segmentation by Application
- Exhibit 06: Executive Summary – Chart on Incremental Growth
- Exhibit 07: Executive Summary – Data Table on Incremental Growth
- Exhibit 08: Executive Summary – Chart on Vendor Market Positioning
2 Market Landscape
- 2.1 Market ecosystem
- Exhibit 09: Parent market
- Exhibit 10: Market Characteristics
3 Market Sizing
- 3.1 Market definition
- Exhibit 11: Offerings of vendors included in the market definition
- 3.2 Market segment analysis
- Exhibit 12: Market segments
- 3.3 Market size 2021
- 3.4 Market outlook: Forecast for 2021-2026
- Exhibit 13: Chart on Global - Market size and forecast 2021-2026 ($ billion)
- Exhibit 14: Data Table on Global - Market size and forecast 2021-2026 ($ billion)
- Exhibit 15: Chart on Global Market: Year-over-year growth 2021-2026 (%)
- Exhibit 16: Data Table on Global Market: Year-over-year growth 2021-2026 (%)
4 Five Forces Analysis
- 4.1 Five forces summary
- Exhibit 17: Five forces analysis - Comparison between2021 and 2026
- 4.2 Bargaining power of buyers
- Exhibit 18: Chart on Bargaining power of buyers – Impact of key factors 2021 and 2026
- 4.3 Bargaining power of suppliers
- Exhibit 19: Bargaining power of suppliers – Impact of key factors in 2021 and 2026
- 4.4 Threat of new entrants
- Exhibit 20: Threat of new entrants – Impact of key factors in 2021 and 2026
- 4.5 Threat of substitutes
- Exhibit 21: Threat of substitutes – Impact of key factors in 2021 and 2026
- 4.6 Threat of rivalry
- Exhibit 22: Threat of rivalry – Impact of key factors in 2021 and 2026
- 4.7 Market condition
- Exhibit 23: Chart on Market condition - Five forces 2021 and 2026
5 Market Segmentation by Application
- 5.1 Market segments
- Exhibit 24: Chart on Application - Market share 2021-2026 (%)
- Exhibit 25: Data Table on Application - Market share 2021-2026 (%)
- 5.2 Comparison by Application
- Exhibit 26: Chart on Comparison by Application
- Exhibit 27: Data Table on Comparison by Application
- 5.3 Equipment - Market size and forecast 2021-2026
- Exhibit 28: Chart on Equipment - Market size and forecast 2021-2026 ($ billion)
- Exhibit 29: Data Table on Equipment - Market size and forecast 2021-2026 ($ billion)
- Exhibit 30: Chart on Equipment - Year-over-year growth 2021-2026 (%)
- Exhibit 31: Data Table on Equipment - Year-over-year growth 2021-2026 (%)
- 5.4 Services - Market size and forecast 2021-2026
- Exhibit 32: Chart on Services - Market size and forecast 2021-2026 ($ billion)
- Exhibit 33: Data Table on Services - Market size and forecast 2021-2026 ($ billion)
- Exhibit 34: Chart on Services - Year-over-year growth 2021-2026 (%)
- Exhibit 35: Data Table on Services - Year-over-year growth 2021-2026 (%)
- 5.5 Market opportunity by Application
- Exhibit 36: Market opportunity by Application ($ billion)
6 Customer Landscape
- 6.1 Customer landscape overview
- Exhibit 37: Analysis of price sensitivity, lifecycle, customer purchase basket, adoption rates, and purchase criteria
7 Geographic Landscape
- 7.1 Geographic segmentation
- Exhibit 38: Chart on Market share by geography 2021-2026 (%)
- Exhibit 39: Data Table on Market share by geography 2021-2026 (%)
- 7.2 Geographic comparison
- Exhibit 40: Chart on Geographic comparison
- Exhibit 41: Data Table on Geographic comparison
- 7.3 APAC - Market size and forecast 2021-2026
- Exhibit 42: Chart on APAC - Market size and forecast 2021-2026 ($ billion)
- Exhibit 43: Data Table on APAC - Market size and forecast 2021-2026 ($ billion)
- Exhibit 44: Chart on APAC - Year-over-year growth 2021-2026 (%)
- Exhibit 45: Data Table on APAC - Year-over-year growth 2021-2026 (%)
- 7.4 North America - Market size and forecast 2021-2026
- Exhibit 46: Chart on North America - Market size and forecast 2021-2026 ($ billion)
- Exhibit 47: Data Table on North America - Market size and forecast 2021-2026 ($ billion)
- Exhibit 48: Chart on North America - Year-over-year growth 2021-2026 (%)
- Exhibit 49: Data Table on North America - Year-over-year growth 2021-2026 (%)
- 7.5 Europe - Market size and forecast 2021-2026
- Exhibit 50: Chart on Europe - Market size and forecast 2021-2026 ($ billion)
- Exhibit 51: Data Table on Europe - Market size and forecast 2021-2026 ($ billion)
- Exhibit 52: Chart on Europe - Year-over-year growth 2021-2026 (%)
- Exhibit 53: Data Table on Europe - Year-over-year growth 2021-2026 (%)
- 7.6 South America - Market size and forecast 2021-2026
- Exhibit 54: Chart on South America - Market size and forecast 2021-2026 ($ billion)
- Exhibit 55: Data Table on South America - Market size and forecast 2021-2026 ($ billion)
- Exhibit 56: Chart on South America - Year-over-year growth 2021-2026 (%)
- Exhibit 57: Data Table on South America - Year-over-year growth 2021-2026 (%)
- 7.7 Middle East and Africa - Market size and forecast 2021-2026
- Exhibit 58: Chart on Middle East and Africa - Market size and forecast 2021-2026 ($ billion)
- Exhibit 59: Data Table on Middle East and Africa - Market size and forecast 2021-2026 ($ billion)
- Exhibit 60: Chart on Middle East and Africa - Year-over-year growth 2021-2026 (%)
- Exhibit 61: Data Table on Middle East and Africa - Year-over-year growth 2021-2026 (%)
- 7.8 China - Market size and forecast 2021-2026
- Exhibit 62: Chart on China - Market size and forecast 2021-2026 ($ billion)
- Exhibit 63: Data Table on China - Market size and forecast 2021-2026 ($ billion)
- Exhibit 64: Chart on China - Year-over-year growth 2021-2026 (%)
- Exhibit 65: Data Table on China - Year-over-year growth 2021-2026 (%)
- 7.9 US - Market size and forecast 2021-2026
- Exhibit 66: Chart on US - Market size and forecast 2021-2026 ($ billion)
- Exhibit 67: Data Table on US - Market size and forecast 2021-2026 ($ billion)
- Exhibit 68: Chart on US - Year-over-year growth 2021-2026 (%)
- Exhibit 69: Data Table on US - Year-over-year growth 2021-2026 (%)
- 7.10 Japan - Market size and forecast 2021-2026
- Exhibit 70: Chart on Japan - Market size and forecast 2021-2026 ($ billion)
- Exhibit 71: Data Table on Japan - Market size and forecast 2021-2026 ($ billion)
- Exhibit 72: Chart on Japan - Year-over-year growth 2021-2026 (%)
- Exhibit 73: Data Table on Japan - Year-over-year growth 2021-2026 (%)
- 7.11 India - Market size and forecast 2021-2026
- Exhibit 74: Chart on India - Market size and forecast 2021-2026 ($ billion)
- Exhibit 75: Data Table on India - Market size and forecast 2021-2026 ($ billion)
- Exhibit 76: Chart on India - Year-over-year growth 2021-2026 (%)
- Exhibit 77: Data Table on India - Year-over-year growth 2021-2026 (%)
- 7.12 UK - Market size and forecast 2021-2026
- Exhibit 78: Chart on UK - Market size and forecast 2021-2026 ($ billion)
- Exhibit 79: Data Table on UK - Market size and forecast 2021-2026 ($ billion)
- Exhibit 80: Chart on UK - Year-over-year growth 2021-2026 (%)
- Exhibit 81: Data Table on UK - Year-over-year growth 2021-2026 (%)
- 7.13 Market opportunity by geography
- Exhibit 82: Market opportunity by geography ($ billion)
8 Drivers, Challenges, and Trends
- 8.1 Market drivers
- 8.2 Market challenges
- 8.3 Impact of drivers and challenges
- Exhibit 83: Impact of drivers and challenges in 2021 and 2026
- 8.4 Market trends
9 Vendor Landscape
- 9.1 Overview
- 9.2 Vendor landscape
- Exhibit 84: Overview on Criticality of inputs and Factors of differentiation
- 9.3 Landscape disruption
- Exhibit 85: Overview on factors of disruption
- 9.4 Industry risks
- Exhibit 86: Impact of key risks on business
10 Vendor Analysis
- 10.1 Vendors covered
- Exhibit 87: Vendors covered
- 10.2 Market positioning of vendors
- Exhibit 88: Matrix on vendor position and classification
- 10.3 Carrier Global Corp.
- Exhibit 89: Carrier Global Corp. - Overview
- Exhibit 90: Carrier Global Corp. - Business segments
- Exhibit 91: Carrier Global Corp. - Key news
- Exhibit 92: Carrier Global Corp. - Key offerings
- Exhibit 93: Carrier Global Corp. - Segment focus
- 10.4 Daikin Industries Ltd.
- Exhibit 94: Daikin Industries Ltd. - Overview
- Exhibit 95: Daikin Industries Ltd. - Business segments
- Exhibit 96: Daikin Industries Ltd. - Key offerings
- Exhibit 97: Daikin Industries Ltd. - Segment focus
- 10.5 Hitachi Ltd.
- Exhibit 98: Hitachi Ltd. - Overview
- Exhibit 99: Hitachi Ltd. - Business segments
- Exhibit 100: Hitachi Ltd. - Key news
- Exhibit 101: Hitachi Ltd. - Key offerings
- Exhibit 102: Hitachi Ltd. - Segment focus
- 10.6 Ingersoll Rand Inc.
- Exhibit 103: Ingersoll Rand Inc. - Overview
- Exhibit 104: Ingersoll Rand Inc. - Business segments
- Exhibit 105: Ingersoll Rand Inc. - Key offerings
- Exhibit 106: Ingersoll Rand Inc. - Segment focus
- 10.7 Johnson Controls International Plc
- Exhibit 107: Johnson Controls International Plc - Overview
- Exhibit 108: Johnson Controls International Plc - Business segments
- Exhibit 109: Johnson Controls International Plc - Key news
- Exhibit 110: Johnson Controls International Plc - Key offerings
- Exhibit 111: Johnson Controls International Plc - Segment focus
- 10.8 Lennox International Inc.
- Exhibit 112: Lennox International Inc. - Overview
- Exhibit 113: Lennox International Inc. - Business segments
- Exhibit 114: Lennox International Inc. - Key offerings
- Exhibit 115: Lennox International Inc. - Segment focus
- 10.9 LG Electronics Inc.
- Exhibit 116: LG Electronics Inc. - Overview
- Exhibit 117: LG Electronics Inc. - Business segments
- Exhibit 118: LG Electronics Inc. - Key news
- Exhibit 119: LG Electronics Inc. - Key offerings
- Exhibit 120: LG Electronics Inc. - Segment focus
- 10.10 Mitsubishi Electric Corp.
- Exhibit 121: Mitsubishi Electric Corp. - Overview
- Exhibit 122: Mitsubishi Electric Corp. - Business segments
- Exhibit 123: Mitsubishi Electric Corp. - Key news
- Exhibit 124: Mitsubishi Electric Corp. - Key offerings
- Exhibit 125: Mitsubishi Electric Corp. - Segment focus
- 10.11 Panasonic Corp.
- Exhibit 126: Panasonic Corp. - Overview
- Exhibit 127: Panasonic Corp. - Business segments
- Exhibit 128: Panasonic Corp. - Key offerings
- Exhibit 129: Panasonic Corp. - Segment focus
- 10.12 The Climate Control Group Inc.
- Exhibit 130: The Climate Control Group Inc. - Overview
- Exhibit 131: The Climate Control Group Inc. - Key offerings
11 Appendix
- 11.1 Scope of the report
- 11.2 Inclusions and exclusions checklist
- Exhibit 132: Inclusions checklist
- Exhibit 133: Exclusions checklist
- 11.3 Currency conversion rates for US$
- Exhibit 134: Currency conversion rates for US$
- 11.4 Research methodology
- Exhibit 135: Research methodology
- Exhibit 136: Validation techniques employed for market sizing
- Exhibit 137: Information sources
- 11.5 List of abbreviations
- Exhibit 138: List of abbreviations
Technavio is a leading global technology research and advisory company. Their research and analysis focus on emerging market trends and provide actionable insights to help businesses identify market opportunities and develop effective strategies to optimize their market positions.
With over 500 specialized analysts, Technavio's report library consists of more than 17,000 reports and counting, covering 800 technologies, spanning across 50 countries. Their client base consists of enterprises of all sizes, including more than 100 Fortune 500 companies. This growing client base relies on Technavio's comprehensive coverage, extensive research, and actionable market insights to identify opportunities in existing and potential markets and assess their competitive positions within changing market scenarios.
Technavio Research
Jesse Maida
Media & Marketing Executive
US: +1 844 364 1100
UK: +44 203 893 3200
Email: media@technavio.com
Website: www.technavio.com/


SOURCE Technavio
© 2024 Benzinga.com. Benzinga does not provide investment advice. All rights reserved.
Trade confidently with insights and alerts from analyst ratings, free reports and breaking news that affects the stocks you care about.

