


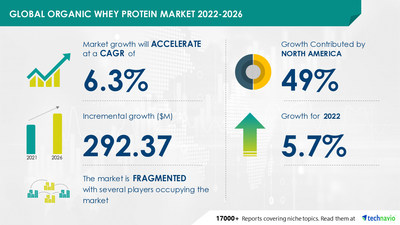
NEW YORK, June 28, 2022 /PRNewswire/ -- The organic whey protein market size is set to grow by USD 292.37 million from 2021 to 2026 as per the latest market report by Technavio. The report projects the market to progress at a CAGR of 6.3%. 49% of the market's growth will originate from North America during the forecast period. The US is the key market for organic whey protein in North America. Market growth in this region will be faster than the growth of the market in Europe and the MEA. The rise in consumer awareness of the benefits of organic whey proteins, the availability of a wide range of organic whey protein products such as nutraceuticals and protein bars, and the presence of major retailers will facilitate the organic whey protein market growth in North America over the forecast period.

For more highlights on the regional segment - Grab a Sample Report
Organic Whey Protein Market: Drivers
- The key factor driving the global organic whey protein industry growth is the increasing product launches.
- For instance, in October 2021, Arla Foods Ingredients launched a new protein category called Lacprodan BLG-100 is a pure BLG ingredient with a unique nutritional profile. Produced using a patented new separation technology, it contains 45% more leucine - the main muscle-building amino acid - than commercially available whey protein isolates. Similarly, in October 2021, Keventers partnered with Myprotein to create a unique Whey Protein in Keventers Coffee Flavor.
- The drinks are designed for the everyday milkshake-lovers who love to be fit without the rigors of the gym, the collaboration brings the tastiest, safest, and healthiest whey protein flavor to add to your daily milkshake/smoothie drink, an official statement highlighted. Such factors are expected to drive market growth in the forecast period.
- To know about other drivers along with the market challenges - Click Now!
Organic Whey Protein Market: Segmentation Analysis
The market research report segments the organic whey protein market by Application (Nutraceutical and Food and beverages) and Geography (North America, Europe, APAC, South America, and the Middle East and Africa).
Revenue Generating Segment:
- The organic whey protein market share growth in the nutraceuticals segment will be significant for revenue generation.
- The growing popularity of organic foods and awareness of health and wellness will increase the application of organic whey protein in nutraceuticals, which help support the market growth through this segment.
To know about the market contribution of each segment - Request a sample report
Get ready to achieve excellent business outcomes from this exclusive Organic Whey Protein Market report by Technavio. The report will include highlights of the overall market which includes frequently asked questions such as -
- What are historical revenue figures and estimated revenue figures as well as CAGR during the forecast timeframe?
- What is the current trend taking place in the market space?
- Which business tactics will influence competitive scenarios along with defining the market's growth potential?
- What are market drivers, restraints, and challenges impacting demand & growth of the market?
- Which regions & segments will garner massive revenue and emerge as market leaders in upcoming years?
The competitive scenario provided in the Organic Whey Protein Market report analyzes, evaluates, and positions companies based on various performance indicators. Some of the factors considered for this analysis include the financial performance of companies over the past few years, growth strategies, product innovations, new product launches, investments, growth in market share, etc. Don't wait, Make a strategic approach & boost your business goals with our Organic Whey Protein Market Forecast Report - Buy Now!
Related Reports:
- The predicted growth for the vegan supplements market share in North America from 2021 to 2026 is USD 768.62 million at a progressing CAGR of 7.75%.
- The kiwi fruits market share is expected to reach an estimated value of USD 2.74 billion from 2021 to 2026 at a CAGR of 4.3%.
Organic Whey Protein Market Scope | |
Report Coverage | Details |
Page number | 120 |
Base year | 2021 |
Forecast period | 2022-2026 |
Growth momentum & CAGR | Accelerate at a CAGR of 6.3% |
Market growth 2022-2026 | $ 292.37 million |
Market structure | Fragmented |
YoY growth (%) | 5.7 |
Regional analysis | North America, Europe, APAC, South America, and Middle East and Africa |
Performing market contribution | North America at 49% |
Key consumer countries | US, China, Germany, France, and The Netherlands |
Competitive landscape | Leading companies, competitive strategies, consumer engagement scope |
Companies profiled | Arla Foods amba, Bio Synergy Ltd., ConnOils LLC, DMK Deutsches Milchkontor GmbH, Glanbia plc, Hilmar Cheese Co. Inc., Leprino Foods Co., Milk Specialties Global, Mopro Nutrition LLC, Natural Force Benefit Co., Nestle SA, NOW Health Group Inc., Organic Valley, Pro Amino International Inc., Puori ApS, The Carrington Tea Company LLC, The Organic Protein Co., Vital Proteins LLC, and Wheyd Ltd. |
Market Dynamics | Parent market analysis, Market growth inducers and obstacles, Fast-growing and slow-growing segment analysis, COVID 19 impact and future consumer dynamics, market condition analysis for forecast period, |
Customization purview | If our report has not included the data that you are looking for, you can reach out to our analysts and get segments customized. |
Table of Content
1 Executive Summary
- 1.1 Market overview
- Exhibit 01: Executive Summary – Chart on Market Overview
- Exhibit 02: Executive Summary – Data Table on Market Overview
- Exhibit 03: Executive Summary – Chart on Global Market Characteristics
- Exhibit 04: Executive Summary – Chart on Market by Geography
- Exhibit 05: Executive Summary – Chart on Market Segmentation by Application
- Exhibit 06: Executive Summary – Chart on Incremental Growth
- Exhibit 07: Executive Summary – Data Table on Incremental Growth
- Exhibit 08: Executive Summary – Chart on Vendor Market Positioning
2 Market Landscape
- 2.1 Market ecosystem
- Exhibit 09: Parent market
- Exhibit 10: Market Characteristics
3 Market Sizing
- 3.1 Market definition
- Exhibit 11: Offerings of vendors included in the market definition
- 3.2 Market segment analysis
- Exhibit 12: Market segments
- 3.3 Market size 2021
- 3.4 Market outlook: Forecast for 2021-2026
- Exhibit 13: Chart on Global - Market size and forecast 2021-2026 ($ million)
- Exhibit 14: Data Table on Global - Market size and forecast 2021-2026 ($ million)
- Exhibit 15: Chart on Global Market: Year-over-year growth 2021-2026 (%)
- Exhibit 16: Data Table on Global Market: Year-over-year growth 2021-2026 (%)
4 Five Forces Analysis
- 4.1 Five forces summary
- Exhibit 17: Five forces analysis - Comparison between2021 and 2026
- 4.2 Bargaining power of buyers
- Exhibit 18: Chart on Bargaining power of buyers – Impact of key factors 2021 and 2026
- 4.3 Bargaining power of suppliers
- Exhibit 19: Bargaining power of suppliers – Impact of key factors in 2021 and 2026
- 4.4 Threat of new entrants
- Exhibit 20: Threat of new entrants – Impact of key factors in 2021 and 2026
- 4.5 Threat of substitutes
- Exhibit 21: Threat of substitutes – Impact of key factors in 2021 and 2026
- 4.6 Threat of rivalry
- Exhibit 22: Threat of rivalry – Impact of key factors in 2021 and 2026
- 4.7 Market condition
- Exhibit 23: Chart on Market condition - Five forces 2021 and 2026
5 Market Segmentation by Application
- 5.1 Market segments
- Exhibit 24: Chart on Application - Market share 2021-2026 (%)
- Exhibit 25: Data Table on Application - Market share 2021-2026 (%)
- 5.2 Comparison by Application
- Exhibit 26: Chart on Comparison by Application
- Exhibit 27: Data Table on Comparison by Application
- 5.3 Nutraceutical - Market size and forecast 2021-2026
- Exhibit 28: Chart on Nutraceutical - Market size and forecast 2021-2026 ($ million)
- Exhibit 29: Data Table on Nutraceutical - Market size and forecast 2021-2026 ($ million)
- Exhibit 30: Chart on Nutraceutical - Year-over-year growth 2021-2026 (%)
- Exhibit 31: Data Table on Nutraceutical - Year-over-year growth 2021-2026 (%)
- 5.4 Food and beverages - Market size and forecast 2021-2026
- Exhibit 32: Chart on Food and beverages - Market size and forecast 2021-2026 ($ million)
- Exhibit 33: Data Table on Food and beverages - Market size and forecast 2021-2026 ($ million)
- Exhibit 34: Chart on Food and beverages - Year-over-year growth 2021-2026 (%)
- Exhibit 35: Data Table on Food and beverages - Year-over-year growth 2021-2026 (%)
- 5.5 Market opportunity by Application
- Exhibit 36: Market opportunity by Application ($ million)
6 Customer Landscape
- 6.1 Customer landscape overview
- Exhibit 37: Analysis of price sensitivity, lifecycle, customer purchase basket, adoption rates, and purchase criteria
7 Geographic Landscape
- 7.1 Geographic segmentation
- Exhibit 38: Chart on Market share by geography 2021-2026 (%)
- Exhibit 39: Data Table on Market share by geography 2021-2026 (%)
- 7.2 Geographic comparison
- Exhibit 40: Chart on Geographic comparison
- Exhibit 41: Data Table on Geographic comparison
- 7.3 North America - Market size and forecast 2021-2026
- Exhibit 42: Chart on North America - Market size and forecast 2021-2026 ($ million)
- Exhibit 43: Data Table on North America - Market size and forecast 2021-2026 ($ million)
- Exhibit 44: Chart on North America - Year-over-year growth 2021-2026 (%)
- Exhibit 45: Data Table on North America - Year-over-year growth 2021-2026 (%)
- 7.4 Europe - Market size and forecast 2021-2026
- Exhibit 46: Chart on Europe - Market size and forecast 2021-2026 ($ million)
- Exhibit 47: Data Table on Europe - Market size and forecast 2021-2026 ($ million)
- Exhibit 48: Chart on Europe - Year-over-year growth 2021-2026 (%)
- Exhibit 49: Data Table on Europe - Year-over-year growth 2021-2026 (%)
- 7.5 APAC - Market size and forecast 2021-2026
- Exhibit 50: Chart on APAC - Market size and forecast 2021-2026 ($ million)
- Exhibit 51: Data Table on APAC - Market size and forecast 2021-2026 ($ million)
- Exhibit 52: Chart on APAC - Year-over-year growth 2021-2026 (%)
- Exhibit 53: Data Table on APAC - Year-over-year growth 2021-2026 (%)
- 7.6 South America - Market size and forecast 2021-2026
- Exhibit 54: Chart on South America - Market size and forecast 2021-2026 ($ million)
- Exhibit 55: Data Table on South America - Market size and forecast 2021-2026 ($ million)
- Exhibit 56: Chart on South America - Year-over-year growth 2021-2026 (%)
- Exhibit 57: Data Table on South America - Year-over-year growth 2021-2026 (%)
- 7.7 Middle East and Africa - Market size and forecast 2021-2026
- Exhibit 58: Chart on Middle East and Africa - Market size and forecast 2021-2026 ($ million)
- Exhibit 59: Data Table on Middle East and Africa - Market size and forecast 2021-2026 ($ million)
- Exhibit 60: Chart on Middle East and Africa - Year-over-year growth 2021-2026 (%)
- Exhibit 61: Data Table on Middle East and Africa - Year-over-year growth 2021-2026 (%)
- 7.8 US - Market size and forecast 2021-2026
- Exhibit 62: Chart on US - Market size and forecast 2021-2026 ($ million)
- Exhibit 63: Data Table on US - Market size and forecast 2021-2026 ($ million)
- Exhibit 64: Chart on US - Year-over-year growth 2021-2026 (%)
- Exhibit 65: Data Table on US - Year-over-year growth 2021-2026 (%)
- 7.9 Germany - Market size and forecast 2021-2026
- Exhibit 66: Chart on Germany - Market size and forecast 2021-2026 ($ million)
- Exhibit 67: Data Table on Germany - Market size and forecast 2021-2026 ($ million)
- Exhibit 68: Chart on Germany - Year-over-year growth 2021-2026 (%)
- Exhibit 69: Data Table on Germany - Year-over-year growth 2021-2026 (%)
- 7.10 France - Market size and forecast 2021-2026
- Exhibit 70: Chart on France - Market size and forecast 2021-2026 ($ million)
- Exhibit 71: Data Table on France - Market size and forecast 2021-2026 ($ million)
- Exhibit 72: Chart on France - Year-over-year growth 2021-2026 (%)
- Exhibit 73: Data Table on France - Year-over-year growth 2021-2026 (%)
- 7.11 The Netherlands - Market size and forecast 2021-2026
- Exhibit 74: Chart on The Netherlands - Market size and forecast 2021-2026 ($ million)
- Exhibit 75: Data Table on The Netherlands - Market size and forecast 2021-2026 ($ million)
- Exhibit 76: Chart on The Netherlands - Year-over-year growth 2021-2026 (%)
- Exhibit 77: Data Table on The Netherlands - Year-over-year growth 2021-2026 (%)
- 7.12 China - Market size and forecast 2021-2026
- Exhibit 78: Chart on China - Market size and forecast 2021-2026 ($ million)
- Exhibit 79: Data Table on China - Market size and forecast 2021-2026 ($ million)
- Exhibit 80: Chart on China - Year-over-year growth 2021-2026 (%)
- Exhibit 81: Data Table on China - Year-over-year growth 2021-2026 (%)
- 7.13 Market opportunity by geography
- Exhibit 82: Market opportunity by geography ($ million)
8 Drivers, Challenges, and Trends
- 8.1 Market drivers
- 8.2 Market challenges
- 8.3 Impact of drivers and challenges
- Exhibit 83: Impact of drivers and challenges in 2021 and 2026
- 8.4 Market trends
9 Vendor Landscape
- 9.1 Overview
- 9.2 Vendor landscape
- Exhibit 84: Overview on Criticality of inputs and Factors of differentiation
- 9.3 Landscape disruption
- Exhibit 85: Overview on factors of disruption
- 9.4 Industry risks
- Exhibit 86: Impact of key risks on business
10 Vendor Analysis
- 10.1 Vendors covered
- Exhibit 87: Vendors covered
- 10.2 Market positioning of vendors
- Exhibit 88: Matrix on vendor position and classification
- 10.3 Bio Synergy Ltd.
- Exhibit 89: Bio Synergy Ltd. - Overview
- Exhibit 90: Bio Synergy Ltd. - Product / Service
- Exhibit 91: Bio Synergy Ltd. - Key offerings
- 10.4 Milk Specialties Global
- Exhibit 92: Milk Specialties Global - Overview
- Exhibit 93: Milk Specialties Global - Product / Service
- Exhibit 94: Milk Specialties Global - Key news
- Exhibit 95: Milk Specialties Global - Key offerings
- 10.5 Mopro Nutrition LLC
- Exhibit 96: Mopro Nutrition LLC - Overview
- Exhibit 97: Mopro Nutrition LLC - Product / Service
- Exhibit 98: Mopro Nutrition LLC - Key offerings
- 10.6 Natural Force Benefit Co.
- Exhibit 99: Natural Force Benefit Co. - Overview
- Exhibit 100: Natural Force Benefit Co. - Product / Service
- Exhibit 101: Natural Force Benefit Co. - Key offerings
- 10.7 Nestle SA
- Exhibit 102: Nestle SA - Overview
- Exhibit 103: Nestle SA - Business segments
- Exhibit 104: Nestle SA - Key news
- Exhibit 105: Nestle SA - Key offerings
- Exhibit 106: Nestle SA - Segment focus
- 10.8 NOW Health Group Inc.
- Exhibit 107: NOW Health Group Inc. - Overview
- Exhibit 108: NOW Health Group Inc. - Product / Service
- Exhibit 109: NOW Health Group Inc. - Key offerings
- 10.9 Organic Valley
- Exhibit 110: Organic Valley - Overview
- Exhibit 111: Organic Valley - Product / Service
- Exhibit 112: Organic Valley - Key offerings
- 10.10 Pro Amino International Inc.
- Exhibit 113: Pro Amino International Inc. - Overview
- Exhibit 114: Pro Amino International Inc. - Product / Service
- Exhibit 115: Pro Amino International Inc. - Key offerings
- 10.11 The Carrington Tea Company LLC
- Exhibit 116: The Carrington Tea Company LLC - Overview
- Exhibit 117: The Carrington Tea Company LLC - Product / Service
- Exhibit 118: The Carrington Tea Company LLC - Key offerings
- 10.12 The Organic Protein Co.
- Exhibit 119: The Organic Protein Co. - Overview
- Exhibit 120: The Organic Protein Co. - Product / Service
- Exhibit 121: The Organic Protein Co. - Key offerings
11 Appendix
- 11.1 Scope of the report
- 11.2 Inclusions and exclusions checklist
- Exhibit 122: Inclusions checklist
- Exhibit 123: Exclusions checklist
- 11.3 Currency conversion rates for US$
- Exhibit 124: Currency conversion rates for US$
- 11.4 Research methodology
- Exhibit 125: Research methodology
- Exhibit 126: Validation techniques employed for market sizing
- Exhibit 127: Information sources
- 11.5 List of abbreviations
- Exhibit 128: List of abbreviations
Technavio is a leading global technology research and advisory company. Their research and analysis focuses on emerging market trends and provides actionable insights to help businesses identify market opportunities and develop effective strategies to optimize their market positions.
With over 500 specialized analysts, Technavio's report library consists of more than 17,000 reports and counting, covering 800 technologies, spanning across 50 countries. Their client base consists of enterprises of all sizes, including more than 100 Fortune 500 companies. This growing client base relies on Technavio's comprehensive coverage, extensive research, and actionable market insights to identify opportunities in existing and potential markets and assess their competitive positions within changing market scenarios.
Contacts
Technavio Research
Jesse Maida
Media & Marketing Executive
US: +1 844 364 1100
UK: +44 203 893 3200
Email: media@technavio.com
Website: www.technavio.com/


SOURCE Technavio
© 2024 Benzinga.com. Benzinga does not provide investment advice. All rights reserved.
Trade confidently with insights and alerts from analyst ratings, free reports and breaking news that affects the stocks you care about.

