


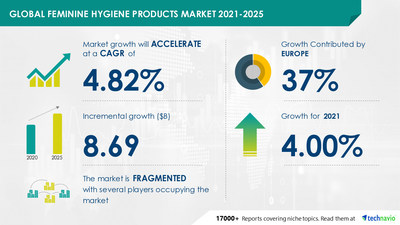
NEW YORK, June 21, 2022 /PRNewswire/ -- The feminine hygiene products market share is expected to increase by USD 8.69 billion from 2020 to 2025, and the market's growth momentum will accelerate at a CAGR of 4.82%.

Learn more about factors influencing the market as you download sample copy
The feminine hygiene products market is categorized by Technavio as a part of the global personal products market. The feminine hygiene products market research report provides valuable insights on the post-pandemic impact on the market, which will help companies evaluate their business approaches.
The feminine hygiene products market forecast report offers in-depth insights into key vendor profiles. The profiles include information on the production, sustainability, and prospects of the leading companies. For instance, Corman Spa, a leading vendor, offers environmentally friendly, organic cotton pads and panty liners.
View market report outlook to know more about vendors in the market
The report identifies the following as the dominant vendors in the market:
- Corman Spa
- Edgewell Personal Care Co.
- Essity Aktiebolag (publ)
- Hengan International Group Co. Ltd.
- Kao Corp.
- Kimberly-Clark Corp.
- Maxim Hygiene Products Inc.
- Ontex Group
- The Procter and Gamble Co.
- Unicharm Corp.
The aggressive marketing by vendors and dedicated section for feminine hygiene products for better visibility are driving the feminine hygiene products market. For instance, feminine hygiene wash products have been positioned next to tampons and sanitary napkins, which are purchased regularly by women. The introduction of new and innovative products, coupled with advertisements to attract female consumers, particularly the younger generation, to purchase feminine hygiene products is expected to drive market growth during the forecast period. Also, the vendors are working for increasing the visibility of their products and establishing brand identity. For instance, in March 2016, Procter & Gamble launched a pilot program in 25 schools in the US. Through this program, the company is expected to provide free tampons and pads to middle and high school students. Through such initiatives, the company focuses on increasing awareness about such products. Such awareness campaigns strengthen brand visibility, resulting in high sales.
The prevalence of side effects is expected to be a major hindrance to the feminine hygiene products market during the forecast period. Concerns have been raised about the use of feminine hygiene products such as sanitary napkins, as they cause several side effects that include infections that affect the general health of users. For instance, scented sanitary napkins have artificial fragrances and harmful chemicals that may cause irritation and also cause infections in the long run. These sanitary napkins also include dioxin (a chlorine-based bleaching agent) that causes reproductive health issues in women. Further, they also include furans that are present in pesticides and added as a key component of sprays used on inorganically grown cotton (used to manufacture sanitary napkins). The use of sanitary napkin products may also lead to TSS. The major symptoms of this condition are low blood pressure, vomiting, dizziness, diarrhea, rashes, red eyes, and high fever. Such side effects create a negative perception of feminine hygiene products and are expected to hamper the growth prospects of the market during the forecast period.
Feminine Hygiene Products Market Scope | |
Report Coverage | Details |
Page number | 120 |
Base year | 2020 |
Forecast period | 2021-2025 |
Growth momentum & CAGR | Accelerate at a CAGR of 4.82% |
Market growth 2021-2025 | $ 8.69 billion |
Market structure | Fragmented |
YoY growth (%) | 4.00 |
Regional analysis | Europe, North America, APAC, South America, and MEA |
Performing market contribution | Europe at 37% |
Key consumer countries | US, China, UK, Germany, and Japan |
Competitive landscape | Leading companies, Competitive strategies, Consumer engagement scope |
Key companies profiled | Corman Spa, Edgewell Personal Care Co., Essity Aktiebolag (publ), Hengan International Group Co. Ltd., Kao Corp., Kimberly-Clark Corp., Maxim Hygiene Products Inc., Ontex Group, The Procter and Gamble Co., and Unicharm Corp. |
Market dynamics | Parent market analysis, Market growth inducers and obstacles, Fast-growing and slow-growing segment analysis, COVID 19 impact and recovery analysis and future consumer dynamics, Market condition analysis for forecast period |
Customization purview | If our report has not included the data that you are looking for, you can reach out to our analysts and get segments customized. |
Get report sample copy to unlock scope and parent market analysis insights
The increase in the number of women in the workforce, especially in countries such as the UK, Germany, and France, making them financially sound to invest in hygiene products such as tampons and menstrual cups to meet their hygiene needs is expected to propel the feminine hygiene products market growth in Europe over the forecast period. The region is expected to contribute 37% of market growth as countries such as the UK and Germany are the key markets for feminine hygiene products. Market growth in Europe is expected to be higher than the growth of the market in other regions.
Request for sample copy and know more about the market contribution in Europe
The feminine hygiene products market is divided by products into the sanitary napkins segment, tampons segment, pantyliners segment, menstrual cups segment, and feminine hygiene wash segment. The sanitary napkins segment is expected to be the major contributor to the market during the forecast period. Various seminars and campaigns about the hygiene and disposal of sanitary napkins have been organized in schools and colleges globally creating a demand for sanitary napkins globally, especially in developing countries such as India and China. Such factors are expected to lead to the growth of the feminine hygiene products market through this segment.
- CAGR of the market during the forecast period 2021-2025
- A thorough analysis of the market's competitive landscape and detailed information on vendors
- Comprehensive details of factors that will challenge the growth of feminine hygiene products market vendors
- Accurate predictions on upcoming trends and changes in consumer behavior
- Detailed information on factors that will drive feminine hygiene products market growth during the next five years
- Precise estimation of the feminine hygiene products market size and its contribution to the parent market
- Accurate predictions on upcoming trends and changes in consumer behavior
- The growth of the feminine hygiene products industry across Europe, North America, APAC, South America, and MEA
Hand Hygiene Market by End-user and Geography - Forecast and Analysis 2022-2026 Download sample
Hair Care Market in Japan by Distribution Channel and Product - Forecast and Analysis 2022-2026 Download sample
1 Executive Summary
- 1.1 Market overview
- Exhibit 01: Executive Summary – Chart on Market Overview
- Exhibit 02: Executive Summary – Data Table on Market Overview
- Exhibit 03: Executive Summary – Chart on Country Market Characteristics
- Exhibit 04: Executive Summary – Chart on Market Segmentation by Distribution Channel
- Exhibit 05: Executive Summary – Chart on Market Segmentation by Product
- Exhibit 06: Executive Summary – Chart on Vendor Market Positioning
2 Market Landscape
- 2.1 Market ecosystem
- Exhibit 07: Parent market
- Exhibit 08: Market Characteristics
3 Market Sizing
- 3.1 Market definition
- Exhibit 09: Offerings of vendors included in the market definition
- 3.2 Market segment analysis
- Exhibit 10: Market segments
- 3.3 Market size 2021
- 3.4 Market outlook: Forecast for 2021-2026
- Exhibit 11: Chart on Japan - Market size and forecast 2021-2026 ($ million)
- Exhibit 12: Data Table on Japan - Market size and forecast 2021-2026 ($ million)
- Exhibit 13: Chart on Japan: Year-over-year growth 2021-2026 (%)
- Exhibit 14: Data Table on Japan: Year-over-year growth 2021-2026 (%)
4 Five Forces Analysis
- 4.1 Five forces summary
- Exhibit 15: Five forces analysis - Comparison between2021 and 2026
- 4.2 Bargaining power of buyers
- Exhibit 16: Chart on Bargaining power of buyers – Impact of key factors 2021 and 2026
- 4.3 Bargaining power of suppliers
- Exhibit 17: Bargaining power of suppliers – Impact of key factors in 2021 and 2026
- 4.4 Threat of new entrants
- Exhibit 18: Threat of new entrants – Impact of key factors in 2021 and 2026
- 4.5 Threat of substitutes
- Exhibit 19: Threat of substitutes – Impact of key factors in 2021 and 2026
- 4.6 Threat of rivalry
- Exhibit 20: Threat of rivalry – Impact of key factors in 2021 and 2026
- 4.7 Market condition
- Exhibit 21: Chart on Market condition - Five forces 2021 and 2026
5 Market Segmentation by Distribution Channel
- 5.1 Market segments
- Exhibit 22: Chart on Distribution Channel - Market share 2021-2026 (%)
- Exhibit 23: Data Table on Distribution Channel - Market share 2021-2026 (%)
- 5.2 Comparison by Distribution Channel
- Exhibit 24: Chart on Comparison by Distribution Channel
- Exhibit 25: Data Table on Comparison by Distribution Channel
- 5.3 Offline - Market size and forecast 2021-2026
- Exhibit 26: Chart on Offline - Market size and forecast 2021-2026 ($ million)
- Exhibit 27: Data Table on Offline - Market size and forecast 2021-2026 ($ million)
- Exhibit 28: Chart on Offline - Year-over-year growth 2021-2026 (%)
- Exhibit 29: Data Table on Offline - Year-over-year growth 2021-2026 (%)
- 5.4 Online - Market size and forecast 2021-2026
- Exhibit 30: Chart on Online - Market size and forecast 2021-2026 ($ million)
- Exhibit 31: Data Table on Online - Market size and forecast 2021-2026 ($ million)
- Exhibit 32: Chart on Online - Year-over-year growth 2021-2026 (%)
- Exhibit 33: Data Table on Online - Year-over-year growth 2021-2026 (%)
- 5.5 Market opportunity by Distribution Channel
- Exhibit 34: Market opportunity by Distribution Channel ($ million)
6 Market Segmentation by Product
- 6.1 Market segments
- Exhibit 35: Chart on Product - Market share 2021-2026 (%)
- Exhibit 36: Data Table on Product - Market share 2021-2026 (%)
- 6.2 Comparison by Product
- Exhibit 37: Chart on Comparison by Product
- Exhibit 38: Data Table on Comparison by Product
- 6.3 Shampoo - Market size and forecast 2021-2026
- Exhibit 39: Chart on Shampoo - Market size and forecast 2021-2026 ($ million)
- Exhibit 40: Data Table on Shampoo - Market size and forecast 2021-2026 ($ million)
- Exhibit 41: Chart on Shampoo - Year-over-year growth 2021-2026 (%)
- Exhibit 42: Data Table on Shampoo - Year-over-year growth 2021-2026 (%)
- 6.4 Conditioners - Market size and forecast 2021-2026
- Exhibit 43: Chart on Conditioners - Market size and forecast 2021-2026 ($ million)
- Exhibit 44: Data Table on Conditioners - Market size and forecast 2021-2026 ($ million)
- Exhibit 45: Chart on Conditioners - Year-over-year growth 2021-2026 (%)
- Exhibit 46: Data Table on Conditioners - Year-over-year growth 2021-2026 (%)
- 6.5 Hair color - Market size and forecast 2021-2026
- Exhibit 47: Chart on Hair color - Market size and forecast 2021-2026 ($ million)
- Exhibit 48: Data Table on Hair color - Market size and forecast 2021-2026 ($ million)
- Exhibit 49: Chart on Hair color - Year-over-year growth 2021-2026 (%)
- Exhibit 50: Data Table on Hair color - Year-over-year growth 2021-2026 (%)
- 6.6 Hair styling - Market size and forecast 2021-2026
- Exhibit 51: Chart on Hair styling - Market size and forecast 2021-2026 ($ million)
- Exhibit 52: Data Table on Hair styling - Market size and forecast 2021-2026 ($ million)
- Exhibit 53: Chart on Hair styling - Year-over-year growth 2021-2026 (%)
- Exhibit 54: Data Table on Hair styling - Year-over-year growth 2021-2026 (%)
- 6.7 Others - Market size and forecast 2021-2026
- Exhibit 55: Chart on Others - Market size and forecast 2021-2026 ($ million)
- Exhibit 56: Data Table on Others - Market size and forecast 2021-2026 ($ million)
- Exhibit 57: Chart on Others - Year-over-year growth 2021-2026 (%)
- Exhibit 58: Data Table on Others - Year-over-year growth 2021-2026 (%)
- 6.8 Market opportunity by Product
- Exhibit 59: Market opportunity by Product ($ million)
7 Customer Landscape
- 7.1 Customer landscape overview
- Exhibit 60: Analysis of price sensitivity, lifecycle, customer purchase basket, adoption rates, and purchase criteria
8 Drivers, Challenges, and Trends
- 8.1 Market drivers
- 8.2 Market challenges
- 8.3 Impact of drivers and challenges
- Exhibit 61: Impact of drivers and challenges in 2021 and 2026
- 8.4 Market trends
9 Vendor Landscape
- 9.1 Overview
- 9.2 Vendor landscape
- Exhibit 62: Overview on Criticality of inputs and Factors of differentiation
- 9.3 Landscape disruption
- Exhibit 63: Overview on factors of disruption
- 9.4 Industry risks
- Exhibit 64: Impact of key risks on business
10 Vendor Analysis
- 10.1 Vendors covered
- Exhibit 65: Vendors covered
- 10.2 Market positioning of vendors
- Exhibit 66: Matrix on vendor position and classification
- 10.3 Arimino Co. Ltd.
- Exhibit 67: Arimino Co. Ltd. - Overview
- Exhibit 68: Arimino Co. Ltd. - Product / Service
- Exhibit 69: Arimino Co. Ltd. - Key offerings
- 10.4 Hoyu Co. Ltd.
- Exhibit 70: Hoyu Co. Ltd. - Overview
- Exhibit 71: Hoyu Co. Ltd. - Product / Service
- Exhibit 72: Hoyu Co. Ltd. - Key offerings
- 10.5 Kao Corp.
- Exhibit 73: Kao Corp. - Overview
- Exhibit 74: Kao Corp. - Business segments
- Exhibit 75: Kao Corp. - Key offerings
- Exhibit 76: Kao Corp. - Segment focus
- 10.6 LOreal SA
- Exhibit 77: LOreal SA - Overview
- Exhibit 78: LOreal SA - Business segments
- Exhibit 79: LOreal SA - Key news
- Exhibit 80: LOreal SA - Key offerings
- Exhibit 81: LOreal SA - Segment focus
- 10.7 Mandom Corp.
- Exhibit 82: Mandom Corp. - Overview
- Exhibit 83: Mandom Corp. - Business segments
- Exhibit 84: Mandom Corp. - Key offerings
- Exhibit 85: Mandom Corp. - Segment focus
- 10.8 Shiseido Co. Ltd.
- Exhibit 86: Shiseido Co. Ltd. - Overview
- Exhibit 87: Shiseido Co. Ltd. - Business segments
- Exhibit 88: Shiseido Co. Ltd. - Key offerings
- Exhibit 89: Shiseido Co. Ltd. - Segment focus
- 10.9 TAKARA BELMONT Corp.
- Exhibit 90: TAKARA BELMONT Corp. - Overview
- Exhibit 91: TAKARA BELMONT Corp. - Product / Service
- Exhibit 92: TAKARA BELMONT Corp. - Key offerings
- 10.10 The Estee Lauder Co. Inc.
- Exhibit 93: The Estee Lauder Co. Inc. - Overview
- Exhibit 94: The Estee Lauder Co. Inc. - Business segments
- Exhibit 95: The Estee Lauder Co. Inc. - Key news
- Exhibit 96: The Estee Lauder Co. Inc. - Key offerings
- Exhibit 97: The Estee Lauder Co. Inc. - Segment focus
- 10.11 The Procter and Gamble Co.
- Exhibit 98: The Procter and Gamble Co. - Overview
- Exhibit 99: The Procter and Gamble Co. - Business segments
- Exhibit 100: The Procter and Gamble Co. - Key news
- Exhibit 101: The Procter and Gamble Co. - Key offerings
- Exhibit 102: The Procter and Gamble Co. - Segment focus
- 10.12 Unilever PLC
- Exhibit 103: Unilever PLC - Overview
- Exhibit 104: Unilever PLC - Business segments
- Exhibit 105: Unilever PLC - Key news
- Exhibit 106: Unilever PLC - Key offerings
- Exhibit 107: Unilever PLC - Segment focus
11 Appendix
- 11.1 Scope of the report
- 11.2 Inclusions and exclusions checklist
- Exhibit 108: Inclusions checklist
- Exhibit 109: Exclusions checklist
- 11.3 Currency conversion rates for US$
- Exhibit 110: Currency conversion rates for US$
- 11.4 Research methodology
- Exhibit 111: Research methodology
- Exhibit 112: Validation techniques employed for market sizing
- Exhibit 113: Information sources
- 11.5 List of abbreviations
- Exhibit 114: List of abbreviations
Technavio is a leading global technology research and advisory company. Their research and analysis focus on emerging market trends and provide actionable insights to help businesses identify market opportunities and develop effective strategies to optimize their market positions. With over 500 specialized analysts, Technavio's report library and its client base consist of enterprises of all sizes, including more than 100 Fortune 500 companies. This growing client base relies on Technavio's comprehensive coverage, extensive research, and actionable market insights to identify opportunities in existing and potential markets and assess their competitive positions within changing market scenarios.
Contact
Technavio Research
Jesse Maida
Media & Marketing Executive
US: +1 844 364 1100
UK: +44 203 893 3200
Email:media@technavio.com
Website: www.technavio.com/


SOURCE Technavio
© 2024 Benzinga.com. Benzinga does not provide investment advice. All rights reserved.
Trade confidently with insights and alerts from analyst ratings, free reports and breaking news that affects the stocks you care about.

