


RESTON, Va., Oct. 27, 2021 /PRNewswire/ -- General Dynamics GD today reported third-quarter 2021 net earnings of $860 million on revenue of $9.6 billion. Diluted earnings per share (EPS) were $3.07.
EPS grew 5.9% from the year-ago quarter and 17.6% sequentially as company-wide operating margin expanded to 11.3%, up 90 basis points from the previous quarter. Margins were up sequentially in all four segments.
"The company delivered solid third-quarter results, generating very strong cash flow and attractive margins," said Phebe N. Novakovic, chairman and chief executive officer. "We continue to focus on delivering solid program performance and ensuring the well-being of our people, who are rising above the challenges of the pandemic to support our customers."
Cash
Net cash provided by operating activities in the quarter totaled $1.5 billion. Free cash flow from operations was $1.3 billion.
Backlog
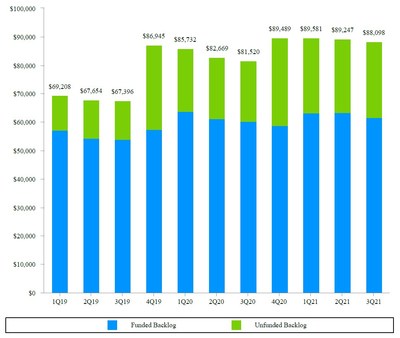
Backlog at the end of the quarter was $88.1 billion, up 8.1% from the year-ago quarter. Estimated potential contract value, representing management's estimate of value in unfunded indefinite delivery, indefinite quantity (IDIQ) contracts and unexercised options, was $41.5 billion. Total estimated contract value, the sum of all backlog components, was $129.6 billion at the end of the quarter.
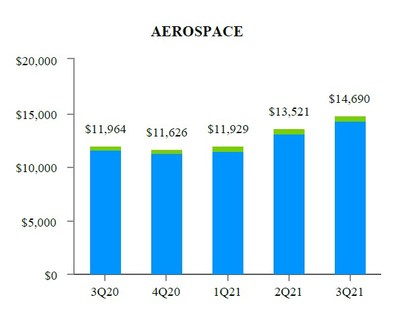
Orders in the Aerospace segment were strong, with backlog up 22.8% over the year-ago quarter to $14.7 billion.
Significant awards in the quarter for the Defense segments included $475 million from the U.S. Navy to provide ongoing lead yard services for the Columbia-class submarine program; $195 million from the Navy to provide engineering, technical, design and planning yard support services for operational strategic and attack submarines; a contract to provide cloud support services to the U.S. Patent and Trademark Office with a maximum potential value of $190 million; $165 million to produce various munitions, ordnance and missile subcomponents for the U.S. Army; $160 million from the Navy to provide maintenance and repair services for the Arleigh Burke-class destroyer, Nimitz-class aircraft carrier, San Antonio-class amphibious transport dock and Whidbey Island-class dock landing ship programs; $150 million from the Navy for Advanced Nuclear Plant Studies in support of the Columbia-class submarine program and options totaling $570 million of additional potential value; and $540 million for several key contracts for classified customers and additional classified IDIQ awards with a maximum potential value of $4.2 billion among multiple awardees.
About General Dynamics
Headquartered in Reston, Virginia, General Dynamics is a global aerospace and defense company that offers a broad portfolio of products and services in business aviation; ship construction and repair; land combat vehicles, weapons systems and munitions; and technology products and services. General Dynamics employs more than 100,000 people worldwide and generated $37.9 billion in revenue in 2020. More information is available at www.gd.com.
Certain statements made in this press release, including any statements as to future results of operations and financial projections, may constitute "forward-looking statements" within the meaning of the Private Securities Litigation Reform Act of 1995, as amended. Forward-looking statements are based on management's expectations, estimates, projections and assumptions. These statements are not guarantees of future performance and involve risks and uncertainties that are difficult to predict. Therefore, actual future results and trends may differ materially from what is forecast in forward-looking statements due to a variety of factors. Additional information regarding these factors is contained in the company's filings with the Securities and Exchange Commission, including, without limitation, its Annual Report on Form 10-K, its Quarterly Reports on Form 10-Q and its Current Reports on Form 8-K. All forward-looking statements speak only as of the date they were made. The company does not undertake any obligation to update or publicly release any revisions to forward-looking statements to reflect events, circumstances or changes in expectations after the date of this press release.
WEBCAST INFORMATION: General Dynamics will webcast its third-quarter 2021 financial results conference call at 9 a.m. EDT on Wednesday, October 27, 2021. The webcast will be a listen-only audio event available at www.gd.com. An on-demand replay of the webcast will be available one hour after the end of the call and end on November 3, 2021. To hear a recording of the conference call by telephone, please call 866-813-9403 (international: +44 204-525-0658); passcode 439422. Charts furnished to investors and securities analysts in connection with General Dynamics' announcement of its financial results are available at www.gd.com.
EXHIBIT A
| |||||||||||||||||||||||
Three Months Ended | Variance | ||||||||||||||||||||||
October 3, 2021 | September 27, 2020 | $ | % | ||||||||||||||||||||
Revenue | $ | 9,568 | $ | 9,431 | $ | 137 | 1.5 | % | |||||||||||||||
Operating costs and expenses | (8,488) | (8,359) | (129) | ||||||||||||||||||||
Operating earnings | 1,080 | 1,072 | 8 | 0.7 | % | ||||||||||||||||||
Other, net | 34 | 24 | 10 | ||||||||||||||||||||
Interest, net | (99) | (118) | 19 | ||||||||||||||||||||
Earnings before income tax | 1,015 | 978 | 37 | 3.8 | % | ||||||||||||||||||
Provision for income tax, net | (155) | (144) | (11) | ||||||||||||||||||||
Net earnings | $ | 860 | $ | 834 | $ | 26 | 3.1 | % | |||||||||||||||
Earnings per share—basic | $ | 3.09 | $ | 2.91 | $ | 0.18 | 6.2 | % | |||||||||||||||
Basic weighted average shares outstanding | 278.6 | 286.5 | |||||||||||||||||||||
Earnings per share—diluted | $ | 3.07 | $ | 2.90 | $ | 0.17 | 5.9 | % | |||||||||||||||
Diluted weighted average shares outstanding | 280.4 | 287.2 | |||||||||||||||||||||
EXHIBIT B
CONSOLIDATED STATEMENT OF EARNINGS - (UNAUDITED) | |||||||||||||||||||||||
Nine Months Ended | Variance | ||||||||||||||||||||||
October 3, 2021 | September 27, 2020 | $ | % | ||||||||||||||||||||
Revenue | $ | 28,177 | $ | 27,444 | $ | 733 | 2.7 | % | |||||||||||||||
Operating costs and expenses | (25,200) | (24,604) | (596) | ||||||||||||||||||||
Operating earnings | 2,977 | 2,840 | 137 | 4.8 | % | ||||||||||||||||||
Other, net | 95 | 70 | 25 | ||||||||||||||||||||
Interest, net | (331) | (357) | 26 | ||||||||||||||||||||
Earnings before income tax | 2,741 | 2,553 | 188 | 7.4 | % | ||||||||||||||||||
Provision for income tax, net | (436) | (388) | (48) | ||||||||||||||||||||
Net earnings | $ | 2,305 | $ | 2,165 | $ | 140 | 6.5 | % | |||||||||||||||
Earnings per share—basic | $ | 8.20 | $ | 7.54 | $ | 0.66 | 8.8 | % | |||||||||||||||
Basic weighted average shares outstanding | 281.1 | 287.1 | |||||||||||||||||||||
Earnings per share—diluted | $ | 8.16 | $ | 7.52 | $ | 0.64 | 8.5 | % | |||||||||||||||
Diluted weighted average shares outstanding | 282.4 | 288.1 | |||||||||||||||||||||
EXHIBIT C
| ||||||||||||||
Three Months Ended | Variance | |||||||||||||
October 3, 2021 | September 27, 2020 | $ | % | |||||||||||
Revenue: | ||||||||||||||
Aerospace | $ | 2,066 | $ | 1,975 | $ | 91 | 4.6 | % | ||||||
Marine Systems | 2,637 | 2,405 | 232 | 9.6 | % | |||||||||
Combat Systems | 1,745 | 1,801 | (56) | (3.1) | % | |||||||||
Technologies | 3,120 | 3,250 | (130) | (4.0) | % | |||||||||
Total | $ | 9,568 | $ | 9,431 | $ | 137 | 1.5 | % | ||||||
Operating earnings: | ||||||||||||||
Aerospace | $ | 262 | $ | 283 | $ | (21) | (7.4) | % | ||||||
Marine Systems | 229 | 223 | 6 | 2.7 | % | |||||||||
Combat Systems | 276 | 270 | 6 | 2.2 | % | |||||||||
Technologies | 327 | 314 | 13 | 4.1 | % | |||||||||
Corporate | (14) | (18) | 4 | 22.2 | % | |||||||||
Total | $ | 1,080 | $ | 1,072 | $ | 8 | 0.7 | % | ||||||
Operating margin: | ||||||||||||||
Aerospace | 12.7 | % | 14.3 | % | ||||||||||
Marine Systems | 8.7 | % | 9.3 | % | ||||||||||
Combat Systems | 15.8 | % | 15.0 | % | ||||||||||
Technologies | 10.5 | % | 9.7 | % | ||||||||||
Total | 11.3 | % | 11.4 | % | ||||||||||
EXHIBIT D
| ||||||||||||||
Nine Months Ended | Variance | |||||||||||||
October 3, 2021 | September 27, 2020 | $ | % | |||||||||||
Revenue: | ||||||||||||||
Aerospace | $ | 5,575 | $ | 5,640 | $ | (65) | (1.2) | % | ||||||
Marine Systems | 7,656 | 7,122 | 534 | 7.5 | % | |||||||||
Combat Systems | 5,464 | 5,263 | 201 | 3.8 | % | |||||||||
Technologies | 9,482 | 9,419 | 63 | 0.7 | % | |||||||||
Total | $ | 28,177 | $ | 27,444 | $ | 733 | 2.7 | % | ||||||
Operating earnings: | ||||||||||||||
Aerospace | $ | 677 | $ | 682 | $ | (5) | (0.7) | % | ||||||
Marine Systems | 639 | 607 | 32 | 5.3 | % | |||||||||
Combat Systems | 786 | 732 | 54 | 7.4 | % | |||||||||
Technologies | 941 | 859 | 82 | 9.5 | % | |||||||||
Corporate | (66) | (40) | (26) | (65.0) | % | |||||||||
Total | $ | 2,977 | $ | 2,840 | $ | 137 | 4.8 | % | ||||||
Operating margin: | ||||||||||||||
Aerospace | 12.1 | % | 12.1 | % | ||||||||||
Marine Systems | 8.3 | % | 8.5 | % | ||||||||||
Combat Systems | 14.4 | % | 13.9 | % | ||||||||||
Technologies | 9.9 | % | 9.1 | % | ||||||||||
Total | 10.6 | % | 10.3 | % | ||||||||||
EXHIBIT E
| |||||||||||
(Unaudited) | |||||||||||
October 3, 2021 | December 31, 2020 | ||||||||||
ASSETS | |||||||||||
Current assets: | |||||||||||
Cash and equivalents | $ | 3,139 | $ | 2,824 | |||||||
Accounts receivable | 3,046 | 3,161 | |||||||||
Unbilled receivables | 8,334 | 8,024 | |||||||||
Inventories | 5,651 | 5,745 | |||||||||
Other current assets | 1,516 | 1,789 | |||||||||
Total current assets | 21,686 | 21,543 | |||||||||
Noncurrent assets: | |||||||||||
Property, plant and equipment, net | 5,195 | 5,100 | |||||||||
Intangible assets, net | 2,022 | 2,117 | |||||||||
Goodwill | 20,092 | 20,053 | |||||||||
Other assets | 2,375 | 2,495 | |||||||||
Total noncurrent assets | 29,684 | 29,765 | |||||||||
Total assets | $ | 51,370 | $ | 51,308 | |||||||
LIABILITIES AND SHAREHOLDERS' EQUITY | |||||||||||
Current liabilities: | |||||||||||
Short-term debt and current portion of long-term debt | $ | 2,183 | $ | 3,003 | |||||||
Accounts payable | 2,682 | 2,952 | |||||||||
Customer advances and deposits | 6,167 | 6,276 | |||||||||
Other current liabilities | 3,572 | 3,733 | |||||||||
Total current liabilities | 14,604 | 15,964 | |||||||||
Noncurrent liabilities: | |||||||||||
Long-term debt | 11,485 | 9,995 | |||||||||
Other liabilities | 9,560 | 9,688 | |||||||||
Total noncurrent liabilities | 21,045 | 19,683 | |||||||||
Shareholders' equity: | |||||||||||
Common stock | 482 | 482 | |||||||||
Surplus | 3,236 | 3,124 | |||||||||
Retained earnings | 34,800 | 33,498 | |||||||||
Treasury stock | (19,276) | (17,893) | |||||||||
Accumulated other comprehensive loss | (3,521) | (3,550) | |||||||||
Total shareholders' equity | 15,721 | 15,661 | |||||||||
Total liabilities and shareholders' equity | $ | 51,370 | $ | 51,308 | |||||||
EXHIBIT F
| |||||||||||
Nine Months Ended | |||||||||||
October 3, 2021 | September 27, 2020 | ||||||||||
Cash flows from operating activities—continuing operations: | |||||||||||
Net earnings | $ | 2,305 | $ | 2,165 | |||||||
Adjustments to reconcile net earnings to net cash from operating activities: | |||||||||||
Depreciation of property, plant and equipment | 408 | 376 | |||||||||
Amortization of intangible and finance lease right-of-use assets | 242 | 267 | |||||||||
Equity-based compensation expense | 96 | 91 | |||||||||
Deferred income tax benefit | (38) | (112) | |||||||||
(Increase) decrease in assets, net of effects of business acquisitions: | |||||||||||
Accounts receivable | 133 | (336) | |||||||||
Unbilled receivables | (252) | (239) | |||||||||
Inventories | 94 | (134) | |||||||||
Increase (decrease) in liabilities, net of effects of business acquisitions: | |||||||||||
Accounts payable | (291) | (558) | |||||||||
Customer advances and deposits | 228 | (906) | |||||||||
Other current liabilities | (202) | 360 | |||||||||
Other liabilities | (455) | 3 | |||||||||
Other, net | 321 | 319 | |||||||||
Net cash provided by operating activities | 2,589 | 1,296 | |||||||||
Cash flows from investing activities: | |||||||||||
Capital expenditures | (502) | (622) | |||||||||
Other, net | 1 | 33 | |||||||||
Net cash used by investing activities | (501) | (589) | |||||||||
Cash flows from financing activities: | |||||||||||
Repayment of fixed-rate notes | (2,500) | (2,000) | |||||||||
Proceeds from commercial paper, gross (maturities greater than 3 months) | 1,997 | 420 | |||||||||
Proceeds from fixed-rate notes | 1,497 | 3,960 | |||||||||
Purchases of common stock | (1,491) | (501) | |||||||||
Dividends paid | (983) | (925) | |||||||||
Repayment of floating-rate notes | (500) | (500) | |||||||||
Repayment of commercial paper (maturities greater than 3 months) | — | (420) | |||||||||
Other, net | 223 | (134) | |||||||||
Net cash used by financing activities | (1,757) | (100) | |||||||||
Net cash used by discontinued operations | (16) | (40) | |||||||||
Net increase in cash and equivalents | 315 | 567 | |||||||||
Cash and equivalents at beginning of period | 2,824 | 902 | |||||||||
Cash and equivalents at end of period | $ | 3,139 | $ | 1,469 | |||||||
EXHIBIT G
| |||||||||||||||||||||||
Other Financial Information: | |||||||||||||||||||||||
October 3, 2021 | December 31, 2020 | ||||||||||||||||||||||
Debt-to-equity (a) | 86.9 | % | 83.0 | % | |||||||||||||||||||
Debt-to-capital (b) | 46.5 | % | 45.4 | % | |||||||||||||||||||
Book value per share (c) | $ | 56.30 | $ | 54.67 | |||||||||||||||||||
Shares outstanding | 279,222,830 | 286,477,836 | |||||||||||||||||||||
Third Quarter | Nine Months | ||||||||||||||||||||||
2021 | 2020 | 2021 | 2020 | ||||||||||||||||||||
Income tax payments, net | $ | 257 | $ | 289 | $ | 502 | $ | 345 | |||||||||||||||
Company-sponsored research and development (d) | $ | 112 | $ | 97 | $ | 295 | $ | 291 | |||||||||||||||
Return on sales (e) | 9.0 | % | 8.8 | % | 8.2 | % | 7.9 | % | |||||||||||||||
Non-GAAP Financial Measures: | |||||||||||||||||||||||
Third Quarter | Nine Months | ||||||||||||||||||||||
2021 | 2020 | 2021 | 2020 | ||||||||||||||||||||
Free cash flow from operations: | |||||||||||||||||||||||
Net cash provided by operating activities | $ | 1,471 | $ | 1,119 | $ | 2,589 | $ | 1,296 | |||||||||||||||
Capital expenditures | (196) | (216) | (502) | (622) | |||||||||||||||||||
Free cash flow from operations (f) | $ | 1,275 | $ | 903 | $ | 2,087 | $ | 674 | |||||||||||||||
October 3, 2021 | December 31, 2020 | ||||||||||||||||||||||
Net debt: | |||||||||||||||||||||||
Total debt | $ | 13,668 | $ | 12,998 | |||||||||||||||||||
Less cash and equivalents | 3,139 | 2,824 | |||||||||||||||||||||
Net debt (g) | $ | 10,529 | $ | 10,174 | |||||||||||||||||||
(a) Debt-to-equity ratio is calculated as total debt divided by total equity as of the end of the period. | |||||||||||||||||||||||
(b) Debt-to-capital ratio is calculated as total debt divided by the sum of total debt plus total equity as of the end of the period. | |||||||||||||||||||||||
(c) Book value per share is calculated as total equity divided by total outstanding shares as of the end of the period. | |||||||||||||||||||||||
(d) Includes independent research and development and Aerospace product-development costs. | |||||||||||||||||||||||
(e) Return on sales is calculated as net earnings divided by revenue. | |||||||||||||||||||||||
(f) We believe free cash flow from operations is a useful measure for investors because it portrays our ability to generate cash from our businesses for purposes such as repaying maturing debt, | |||||||||||||||||||||||
(g) We believe net debt is a useful measure for investors because it reflects the borrowings that support our operations and capital deployment strategy. We use net debt as an important indicator | |||||||||||||||||||||||
EXHIBIT H
| ||||||||||||||||||||||||||||||||
Funded | Unfunded | Total | Estimated Potential Contract Value* | Total | ||||||||||||||||||||||||||||
Third Quarter 2021: | ||||||||||||||||||||||||||||||||
Aerospace | $ | 14,312 | $ | 378 | $ | 14,690 | $ | 1,974 | $ | 16,664 | ||||||||||||||||||||||
Marine Systems | 24,639 | 21,684 | 46,323 | 5,127 | 51,450 | |||||||||||||||||||||||||||
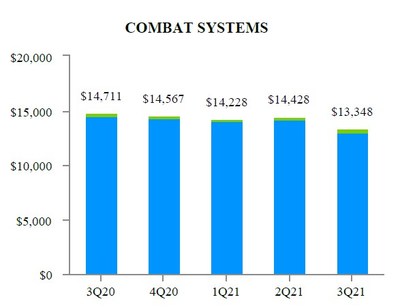
Combat Systems | 13,040 | 308 | 13,348 | 7,594 | 20,942 | |||||||||||||||||||||||||||
Technologies | 9,619 | 4,118 | 13,737 | 26,784 | 40,521 | |||||||||||||||||||||||||||
Total | $ | 61,610 | $ | 26,488 | $ | 88,098 | $ | 41,479 | $ | 129,577 | ||||||||||||||||||||||
Second Quarter 2021: | ||||||||||||||||||||||||||||||||
Aerospace | $ | 13,155 | $ | 366 | $ | 13,521 | $ | 2,099 | $ | 15,620 | ||||||||||||||||||||||
Marine Systems | 26,435 | 21,095 | 47,530 | 4,689 | 52,219 | |||||||||||||||||||||||||||
Combat Systems | 14,157 | 271 | 14,428 | 7,711 | 22,139 | |||||||||||||||||||||||||||
Technologies | 9,769 | 3,999 | 13,768 | 26,594 | 40,362 | |||||||||||||||||||||||||||
Total | $ | 63,516 | $ | 25,731 | $ | 89,247 | $ | 41,093 | $ | 130,340 | ||||||||||||||||||||||
Third Quarter 2020: | ||||||||||||||||||||||||||||||||
Aerospace | $ | 11,640 | $ | 324 | $ | 11,964 | $ | 2,888 | $ | 14,852 | ||||||||||||||||||||||
Marine Systems | 23,958 | 17,124 | 41,082 | 14,666 | 55,748 | |||||||||||||||||||||||||||
Combat Systems | 14,511 | 200 | 14,711 | 6,593 | 21,304 | |||||||||||||||||||||||||||
Technologies | 10,112 | 3,651 | 13,763 | 26,242 | 40,005 | |||||||||||||||||||||||||||
Total | $ | 60,221 | $ | 21,299 | $ | 81,520 | $ | 50,389 | $ | 131,909 | ||||||||||||||||||||||
* The estimated potential contract value includes work awarded on unfunded indefinite delivery, indefinite quantity (IDIQ) contracts and unexercised options associated with existing firm contracts, | ||||||||||||||||||||||||||||||||
EXHIBIT H-1
|

https://mma.prnewswire.com/media/1670503/Exhibit_H_1.jpg
EXHIBIT H-2 |

https://mma.prnewswire.com/media/1670504/Aerospace_Backlog.jpg


https://mma.prnewswire.com/media/1670505/Marine_Backlog.jpg

https://mma.prnewswire.com/media/1670506/Combat_Backlog.jpg

https://mma.prnewswire.com/media/1670507/Technologies_Backlog.jpg


https://mma.prnewswire.com/media/1670508/Backlog_Key.jpg
EXHIBIT I
|
We received the following significant contract awards during the third quarter of 2021:
Marine Systems:
- $475 from the U.S. Navy to provide ongoing lead yard services for the Columbia-class submarine program.
- $195 from the Navy to provide engineering, technical, design and planning yard support services for operational strategic and attack submarines.
- $160 from the Navy to provide maintenance and repair services for the Arleigh Burke-class destroyer, Nimitz-class aircraft carrier, San Antonio-class amphibious transport dock and Whidbey Island-class dock landing ship programs.
- $150 from the Navy for Advanced Nuclear Plant Studies (ANPS) in support of the Columbia-class submarine program and options totaling $570 of additional potential value.
Combat Systems:
- $165 to produce various munitions, ordnance and missile subcomponents for the U.S. Army.
- $125 for Abrams main battle tank upgrades, mission control units and systems technical support.
- $60 from the Army for the concept design phase of the Optionally Manned Fighting Vehicle (OMFV) acquisition program.
- $30 from the Army for the production of Hydra-70 rockets.
Technologies:
- $540 for several key contracts for classified customers and additional classified IDIQ awards with a maximum potential value of $4.2 billion among multiple awardees.
- A contract to provide cloud support services to the U.S. Patent and Trademark Office (USPTO). The contract has a maximum potential value of $190.
- A contract to modernize and consolidate existing information technology (IT) help desks for the Navy. The contract has a maximum potential value of $135.
- $85 from the Army for computing and communications equipment under the Common Hardware Systems-5 (CHS-5) program.
- $75 to provide logistics, sustainment and maintenance support services for the Army.
- $70 to provide command, control and communications capabilities for the U.S. Department of Defense (DoD).
- $65 from the U.S. Department of State (DoS) to provide overseas consular services to support visa application and issuance at U.S. embassies and consulates throughout the world under the Global Support Strategy (GSS) program.
- $50 to provide simulation and training support for the Army.
- $45 from the Centers for Medicare and Medicaid Services (CMS) to provide cloud services and software tools.
- $45 to provide service desk; endpoint support and maintenance; and account, asset and security management services to the DoS.
- $45 from the U.S. Department of Veterans Affairs under the Veterans Intake, Conversion and Communications Services (VICCS) program to modernize benefits and claim processing.
- $40 to provide communications technical support for the U.S. Air Force.
- $35 to provide design, development, testing, installation, maintenance, logistics support and modernization for Navy airborne and shipboard platforms.
EXHIBIT J AEROSPACE SUPPLEMENTAL DATA - (UNAUDITED) | ||||||||||||||||||||||||||
Third Quarter | Nine Months | |||||||||||||||||||||||||
2021 | 2020 | 2021 | 2020 | |||||||||||||||||||||||
Gulfstream Aircraft Deliveries (units): | ||||||||||||||||||||||||||
Large-cabin aircraft | 25 | 25 | 68 | 71 | ||||||||||||||||||||||
Mid-cabin aircraft | 6 | 7 | 12 | 16 | ||||||||||||||||||||||
Total | 31 | 32 | 80 | 87 | ||||||||||||||||||||||
Aerospace Book-to-Bill: | ||||||||||||||||||||||||||
Orders* | $ | 3,247 | $ | 1,816 | $ | 8,996 | $ | 4,744 | ||||||||||||||||||
Revenue | 2,066 | 1,975 | 5,575 | 5,640 | ||||||||||||||||||||||
Book-to-Bill Ratio | 1.57x | 0.92x | 1.61x | 0.84x | ||||||||||||||||||||||
* Does not include customer defaults, liquidated damages, cancellations, foreign exchange fluctuations and other backlog adjustments. | ||||||||||||||||||||||||||


SOURCE General Dynamics
© 2024 Benzinga.com. Benzinga does not provide investment advice. All rights reserved.
Trade confidently with insights and alerts from analyst ratings, free reports and breaking news that affects the stocks you care about.

