


Gross profit increased by 11% year-over-year
Gross Profit after Fulfillment expense was up 149% year-over-year
Adjusted EBITDA loss decreased by 24% year-over-year
LAGOS, NIGERIA / ACCESSWIRE / May 11, 2021 / Jumia Technologies AG JMIA ("Jumia" or the "Company") announced today its financial results for the first quarter ended March 31, 2021.
Results highlights for the first quarter 2021
| For the three months ended March 31 | ||||||||||||||||||||||||
| As reported | YoY | As reported | Constant currency | YoY | ||||||||||||||||||||
In € million, except percentages | 2020 | 2021 | Change | 2020 | 2021 | Change | ||||||||||||||||||
GMV | 189.6 | 165.0 | (13.0) | % | 189.6 | 180.0 | (5.1) | % | ||||||||||||||||
TPV | 35.5 | 42.9 | 20.9 | % | 35.5 | 47.9 | 35.1 | % | ||||||||||||||||
TPV as % of GMV | 18.7 | % | 26.0 | % | 18.7 | % | 26.6 | % | ||||||||||||||||
Gross Profit | 18.4 | 20.4 | 10.9 | % | 18.4 | 22.2 | 20.9 | % | ||||||||||||||||
Fulfillment expense | (15.9 | ) | (14.2 | ) | (10.7) | % | (15.9 | ) | (15.4 | ) | (3.0) | % | ||||||||||||
Gross Profit after Fulfillment expense | 2.5 | 6.2 | 149.5 | % | 2.5 | 6.8 | 174.6 | % | ||||||||||||||||
Sales and advertising expense | (8.9 | ) | (8.1 | ) | (9.1) | % | (8.9 | ) | (8.8 | ) | (1.3) | % | ||||||||||||
Technology and content expense | (7.2 | ) | (6.9 | ) | (4.2) | % | (7.2 | ) | (6.9 | ) | (3.7) | % | ||||||||||||
G&A expense, excluding SBC | (24.4 | ) | (20.3 | ) | (17.0) | % | (24.4 | ) | (22.4 | ) | (8.1) | % | ||||||||||||
Adjusted EBITDA | (35.6 | ) | (27.0 | ) | (24.2) | % | (35.6 | ) | (28.6 | ) | (19.6) | % | ||||||||||||
Operating Loss | (43.7 | ) | (33.7 | ) | (23.0) | % | (43.7 | ) | (35.6 | ) | (18.6) | % | ||||||||||||
"Our first quarter results reflect solid progress towards profitability. The drivers remain consistent: selective and disciplined usage growth, gradual monetization and continued cost discipline. The first quarter of 2021 was the sixth consecutive quarter of positive gross profit after fulfillment expense, which reached €6.2 million, more than doubling year-over-year, while Adjusted EBITDA loss contracted by 24% year-over-year, reaching €27.0 million", commented Jeremy Hodara and Sacha Poignonnec, Co-Chief Executive Officers of Jumia.
"Our strategy to increase our exposure to everyday product categories continues to yield positive results, enhancing the relevance of our marketplace for consumers. We are making further inroads in payment and fintech with 37% of Orders in the first quarter of 2021 completed using JumiaPay. Last but not least, we have raised over $570 million over the past six months, strengthening our balance sheet and increasing our strategic flexibility. We are confident we have all the right ingredients to continue to build a growing business across both our e-commerce and fintech activities."
FIRST QUARTER 2021 - SELECTED BUSINESS HIGHLIGHTS
Jumia Brand Strength
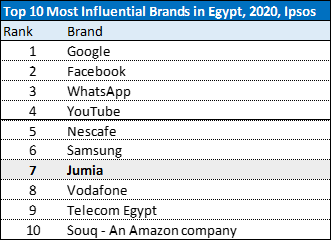
- Jumia was ranked #7 in the 2020 Most Influential Brands survey in Egypt released by Ipsos in March 2021. The ‘Most Influential Brands Survey' is a global Ipsos initiative, covering 14 markets and close to 800 brands worldwide in 2020. The survey was conducted in Egypt for the first time covering 120 national and international brands and assessed their impact on Egyptian consumers based on multiple dimensions including "Trustworthiness", "Leadership", "Presence" and "Leading Edge". Jumia topped the list in the digital and e-commerce sector in Egypt.

Increased Consumer Convenience
- To offer more convenience to consumers and relevance as part of their everyday needs, we are developing our quick commerce ("q-commerce") proposition leveraging our Jumia Food platform:
- We have been successfully operating Jumia Food for the past 9 years and are now present across 10 countries and 48 cities in Africa with a wide range of restaurants and convenience outlets active on our platform. Jumia Food and on-demand services accounted for c. 22% of Orders and 9% of GMV in the first quarter of 2021.
- We operate a delivery-enabled marketplace model with dedicated on-demand logistics and technology infrastructure for the delivery of meals and other convenience items in less than 60 minutes.
- We are currently piloting the possibility to leverage our on-demand logistics infrastructure to reduce the delivery times of a broader range of everyday product categories such as grocery and FMCG.
- We expanded our network of pick-up stations for increased convenience and had over 1,600 pick-up stations across Africa with 23% of packages delivered in pick-up stations in the first quarter of 2021.
- We view pick-up stations as a strategic asset for the future growth of our platform. In addition to providing more convenience options for consumers and cheaper delivery costs, they are physical touch points that bring the Jumia brand closer to consumers. We are increasingly leveraging them as ordering points where consumers can place orders with the help of the pick-up station staff which helps educate consumers and build further trust.
- In some countries such as Ivory Coast, pick-up stations are proving to be a compelling alternative to door delivery and a key tool to expand e-commerce penetration beyond primary cities. We see meaningful opportunity in supporting equitable economic development in secondary cities and rural areas, which led us to establish a scalable pick-up station model in partnership with CDC, the UK's development finance institution. These outlets serve as both pick-up stations and ordering points. They are operated by local entrepreneurs who earn income from the delivery fees they receive on packages delivery and commissions on orders placed from the outlet.
Monetization initiatives
- We remain focused on diversifying monetization streams beyond commissions and fulfillment costs pass-through.
- Jumia Advertising, our in-house digital advertising agency catering to both Jumia sellers and third parties, ran over 283 campaigns on behalf of 137 advertisers. These include high profile partners such as l'Oreal, Leroy Merlin, Adidas, Unilever, Danone and many more.
- On the back of the successful pilot conducted in 2020, we continued rolling out logistics services to third parties in the first quarter of 2021. Over 750,000 packages were delivered during the quarter, more than the total handled in 2020 as part of the pilot, on behalf of more than 250 clients. Logistics-as-a-service clients during the quarter included:
- Weetabix in Kenya: Jumia Logistics was appointed their preferred partner for modern trade deliveries across Kenya.
- ZECI Solar Panel Ivory Coast - Joint Venture between Zola Electric (American off-grid electricity company) and Électricité De France (EDF) - providing solar power to rural communities as a means to eradicating poverty: Jumia Logistics offers the storage and distribution of solar panels from Abidjan to up country households.
- Zaron Cosmetics, leading cosmetics brand in West Africa: Jumia Logistics provides delivery services for their customer orders - placed within and outside the Jumia platform - across Nigeria.
Impact initiatives
- In Egypt, Jumia partnered with Alexbank, a leading Egyptian bank alongside the Sawiris Foundation for Social Development (SFSD), to bring Egypt's creative economy online amidst COVID-19. The partnership includes the set-up of a dedicated brand store on Jumia aimed at promoting authentic Egyptian handicraft and offering craftsmen a digital access to consumers. The initial phase of this initiative covered 3,700 artisans, of which 80% women, and included 15 groups of artisans with disabilities coming from 22 different Egyptian Governorates.
- In an effort to improve our SME sellers' access to credit, we continued to expand our financial services marketplace activities through JumiaPay. We leverage the business and transactional data of our sellers to help financial institutions pre-score their credit on an anonymized basis and offer them short term loans and working capital financing. In the first quarter of 2021, 380 loans were disbursed as part of this initiative, 90% more than in the first quarter of 2020, benefiting 291 unique sellers, 62% more than in the first quarter of 2020.
- To support the emerging intra-Africa trade initiatives championed by some governments, we have been exploring the set-up of trade corridors between our countries of operation. We established an initial logistics corridor Egypt-Morocco with the first deliveries completed in the first quarter of 2021. We are currently in the process of setting up Egypt-Ghana and Egypt-Kenya and are testing Egypt-Nigeria as well.
SELECTED OPERATIONAL KPIs
1. Marketplace KPIs
For the three months ended | |||||||
March 31, | YoY | ||||||
2020 | 2021 | Change | |||||
Annual Active Consumers (mm) | 6.4 | 6.9 | 6.9 | % | |||
Orders (mm) | 6.4 | 6.6 | 3.3 | % | |||
GMV (€ mm) | 189.6 | 165.0 | (13.0) | % | |||
- Annual Active Consumers reached 6.9 million in the first quarter of 2021, up 7% year-over-year, as we continued to acquire new consumers and engage existing ones.
- Orders reached 6.6 million, up 3% year-over-year, a reversal of the declining trend observed over the prior 2 quarters. The fastest growing categories in terms of volumes continue to be the everyday product categories such as beauty, food delivery and fashion while we continued to see volume declines in electronics albeit with a modest recovery observed in the phone category.
- GMV was €165.0 million, down 13% on a year-over-year basis and 5% on a constant currency basis. Key drivers of GMV performance this quarter included:
- FX headwinds as a result of local currency depreciations against the Euro over the past year, with the Nigerian Naira, Egyptian Pound and Kenyan Shilling declining by 15%, 9% and 19% respectively against the Euro in the first quarter of 2021, year-over-year. FX effects were more modest in 2020 due to the application of year-to-date averages for disclosure purposes - reconciliation information available in appendix. On a constant currency basis, GMV was down 5% on a year-over-year basis.
- Continued GMV mix shift towards lower ticket-size, every-day product categories with phones and electronics accounting for 37% of GMV compared to 45% in the first quarter of 2020, driving a decline in average order value of 16% from €29.5 in the first quarter of 2020 to €24.9 in the first quarter 2021. This is consistent with the business mix rebalancing strategy initiated in 2020 as part of which we sought to increase our focus on every-day product categories to drive consumer adoption and usage while reducing our reliance on phones and electronics.
- The effects of the COVID-19 pandemic continued playing out in the first quarter of 2021 with selected countries reinstating some movement restrictions such as Morocco tightening their curfews measures or Kenya imposing localized lockdowns late March. These measures did not lead to meaningful changes in consumer behavior but instead created supply and logistics disruption, especially for our food delivery business where dinner deliveries were affected by curfews in these countries.
The development of the pandemic remains a fluid situation and we expect it to drive continued operating environment uncertainty. We also expect the economic challenges induced by the pandemic to negatively impact consumer sentiment and spending power.
2. JumiaPay KPIs
For the three months ended | |||||||
March 31, | YoY | ||||||
2020 | 2021 | Change | |||||
TPV (€ million) | 35.5 | 42.9 | 20.9 | % | |||
JumiaPay Transactions (million) | 2.3 | 2.4 | 6.7 | % | |||
- TPV increased by 21% from €35.5 million in the first quarter of 2020 to €42.9 million in the first quarter of 2021. On a constant currency basis, TPV increased by 35% year-over-year. On-platform penetration of JumiaPay as a percentage of GMV increased to 26.0% in the first quarter of 2021 from 18.7% in the first quarter of 2020.
- JumiaPay Transactions increased by 7% from 2.3 million in the first quarter of 2020 to 2.4 million in the first quarter of 2021, with JumiaPay Transactions above €10, which include prepaid purchases on the Jumia physical goods marketplace and Jumia Food platforms, growing by 30% over the same period. JumiaPay Transactions below €10 which mostly consist of transactions on the JumiaPay app, declined by 3% over this period. This trend was concentrated in the airtime recharge category as a result of reduced consumer incentives within this category which has historically been promotionally intensive. Overall, 36.7% of Orders placed on the Jumia platform in the first quarter of 2021 were completed using JumiaPay, compared to 35.5% in the first quarter of 2020.
SELECTED FINANCIAL INFORMATION
For the three months ended |
| ||||||
March 31, | YoY | ||||||
(€ million) | 2020 | 2021 | Change | ||||
Revenue | 29.3 | 27.4 | (6.4) | % | |||
Marketplace revenue | 19.1 | 20.2 | 5.9 | % | |||
Commissions | 6.9 | 7.6 | 8.8 | % | |||
Fulfillment | 6.5 | 7.1 | 10.6 | % | |||
Marketing & Advertising | 1.2 | 1.6 | 35.6 | % | |||
Value Added Services | 4.5 | 3.9 | (12.8) | % | |||
First Party revenue | 9.9 | 6.5 | (34.7) | % | |||
Platform revenue | 29.0 | 26.7 | (8.0) | % | |||
Non-Platform revenue | 0.3 | 0.7 | 157.4 | % | |||
Gross Profit | 18.4 | 20.4 | 10.9 | % | |||
Fulfillment expense | (15.9) | (14.2) | (10.7) | % | |||
Sales & Advertising expense | (8.9) | (8.1) | (9.1) | % | |||
Technology and Content expense | (7.2) | (6.9) | (4.2) | % | |||
General and Administrative expense ("G&A") | (30.4) | (25.0) | (17.6) | % | |||
of which Share Based Compensation ("SBC") | (6.0) | (4.8) | (20.1) | % | |||
G&A expense, excluding SBC | (24.4) | (20.3) | (17.0) | % | |||
Adjusted EBITDA | (35.6) | (27.0) | (24.2) | % | |||
Operating loss | (43.7) | (33.7) | (23.0) | % | |||
Revenue
- First Party revenue decreased by 35% in the first quarter of 2021 compared to the first quarter of 2020. This was in line with our strategy to undertake fewer sales on a first party basis as we focus on running an asset light marketplace model where third-party sellers offer consumers an expanding range of products and services. Shifts in the mix between first party and marketplace activities trigger substantial variations in our Revenue as we record the full sales price net of returns as First Party revenue and only commissions and fees in the case of Marketplace revenue. Accordingly, we steer our operations not on the basis of our total Revenue, but rather on the basis of Gross profit, as changes between third-party and first-party sales are largely eliminated at the Gross profit level.
- Marketplace revenue reached €20.2 million in the first quarter of 2021, up 6% compared to the first quarter of 2020. This was mostly driven by increases in Commissions, Fulfillment and Marketing & Advertising revenue streams, which increased by 9%, 11% and 36% year-over-year respectively.
- Commissions grew by 9% largely due to an increase in the share of higher commission rate categories including fashion, beauty or food delivery.
- Fulfillment revenue increased by 11% largely as a result of pricing changes within our cross-border logistics which were initiated in the second half of 2020. As part of these changes, part of the international shipping fees that were previously charged to sellers were instead passed on to consumers. This change resulted in some of our international logistics revenue being recorded as Fulfillment revenue instead of revenue from Value Added Services.
- Value Added Services decreased by 13% as a result of the aforementioned pricing changes in our cross-border logistics pricing.
- Marketing & Advertising revenue increased by 36% as a result of the robust take-up by advertisers, both Jumia sellers and third parties, of Jumia Advertising solutions as we continue to improve the relevance and user experience of our ad solutions.
Gross Profit
Gross profit increased by 11% to €20.4 million in the first quarter of 2021 from €18.4 million in the first quarter of 2020 as a result of the increase in Marketplace revenue. On a constant currency basis, Gross profit in the first quarter of 2021 increased by 21% year-over-year.
Fulfillment Expense
- Fulfillment expense decreased by 11% in the first quarter of 2021 on a year-over-year basis. This was mostly a result of fulfillment staff costs savings as well the change in our delivery pricing model from cost per package to cost per stop which was implemented starting from the second quarter of 2020.
- During the first quarter of 2021, Gross profit after Fulfillment expense reached €6.2 million compared to €2.5 million in the first quarter of 2020, demonstrating continued unit economics improvement as we drive usage on our platform.
- Lastly, we are able to pass-on an increasing proportion of our Fulfillment expense to the combination of consumers and sellers via our Fulfillment and Value Added Services revenue streams respectively. The pass-through of our Fulfillment expense, measured as the ratio of the sum of Fulfillment and Value Added Services revenue over Fulfillment expense, increased from 69% in the first quarter of 2020 to 78% in the first quarter of 2021.
Sales & Advertising Expense
- Sales & Advertising expense decreased by 9% from €8.9 million in the first quarter of 2020 to €8.1 million in the first quarter of 2021. This drove marketing efficiencies with Sales & Advertising expense per Order decreasing by 12%, from €1.4 per Order in the first quarter of 2020 to €1.2 in the first quarter of 2021. This was a result of continued programmatic marketing improvements with better targeted and more engaging campaigns across social media and search engines.
General and Administrative Expense
General & Administrative expense, excluding SBC, reached €20.3 million, down 17% on a year-over-year basis. This decrease was attributable to staff costs savings as a result of the portfolio optimization and headcount rationalization initiatives launched in the first quarter of 2020, alongside a decrease in professional fees, including legal expenses.
Operating loss
Operating loss was €33.7 million in the first quarter of 2021 while Adjusted EBITDA loss was €27.0 million, decreasing by 23% and 24% on a year-over-year basis respectively, demonstrating meaningful progress on our path to profitability. The depreciation of a number of local currencies against the Euro provided some support to costs - on a constant currency basis, operating loss and adjusted EBITDA loss decreased by 19% and 20% on a year-over-year basis respectively.
Cash Position
At the end of March 31, 2021, we had €485.6 million of cash on our balance sheet. This includes approximately €205 million of the total gross proceeds from the offering completed on March 30, 2021 with a remaining €88 million of cash booked in April 2021.
GUIDANCE
We remain focused on executing across the four pillars of our strategy, driving usage in a disciplined manner, developing our payment and fintech business JumiaPay, while driving gradual monetization of our platform and cost efficiencies. Leveraging the strength of our unit economics, we intend to gradually increase Sales & Advertising as well as Technology investments to support the long-term growth of the business, while remaining committed to reducing Adjusted EBITDA loss in absolute terms in 2021 compared to 2020.
The ongoing COVID-19 pandemic as well as the ensuing macroeconomic challenges result in substantial uncertainty concerning our operating environment and financial outlook. This may be further exacerbated by instances of social protests or political disruption, as experienced in Nigeria in late 2020 and early 2021.
CONFERENCE CALL AND WEBCAST INFORMATION
Jumia will host a conference call today, May 11, 2021 at 8:30 a.m. U.S. Eastern Time to discuss Jumia's results. Details of the conference call are as follows:
Participant Dial in (Toll Free): 1-844-750-4870
Participant International Dial in: 1-412-317-5165
Canada Toll Free: 1-855-669-9657
UK Toll Free: 0800-279-9489
A live webcast of the earnings conference call can be accessed on the Jumia Investor Relations website: https://investor.jumia.com/
An archived webcast will be available following the call.
(UNAUDITED)
Consolidated statement of comprehensive income as of March 31, 2020 and 2021
| For the three months ended | ||||||||
| March 31, | March 31, | |||||||
In thousands of EUR | 2020 | 2021 | ||||||
Revenue | 29,252 | 27,369 | ||||||
Cost of revenue | 10,860 | 6,972 | ||||||
Gross profit | 18,392 | 20,397 | ||||||
Fulfillment expense | 15,915 | 14,218 | ||||||
Sale and advertising expense | 8,875 | 8,063 | ||||||
Technology and content expense | 7,177 | 6,873 | ||||||
General and administrative expense | 30,390 | 25,049 | ||||||
Other operating income | 314 | 178 | ||||||
Other operating expense | 95 | 58 | ||||||
Operating loss | (43,746) | (33,686) | ||||||
Finance income | 2,637 | 15,118 | ||||||
Finance costs, net | 1,060 | 1,843 | ||||||
Loss before Income tax | (42,169) | (20,411) | ||||||
Income tax expense | 115 | 229 | ||||||
Loss for the period | (42,284) | (20,640) | ||||||
Attributable to: | ||||||||
Equity holders of the Company | (42,217 | ) | (20,634 | ) | ||||
Non-controlling interests | (67 | ) | (6 | ) | ||||
Loss for the period | (42,284) | (20,640) | ||||||
Other comprehensive income/loss to be classified to profit or loss in subsequent periods | ||||||||
Exchange differences on translation of foreign operations - net of tax | 10,103 | (29,544 | ) | |||||
Other comprehensive income / (loss) on net investment in foreign operations - net of tax | (10,706 | ) | 29,287 | |||||
Other comprehensive income / (loss) | (603 | ) | (257 | ) | ||||
Total comprehensive loss for the period | (42,887) | (20,897) | ||||||
Attributable to: | ||||||||
Equity holders of the Company | (42,818 | ) | (20,891 | ) | ||||
Non-controlling interests | (69 | ) | (6 | ) | ||||
Total comprehensive loss for the period | (42,887) | (20,897) | ||||||
(UNAUDITED)
Consolidated statement of financial position as of December 31, 2020 and March 31, 2021
| As of | ||||||||
| December 31, | March 31, | |||||||
In thousands of EUR | 2020 | 2021 | ||||||
Assets | ||||||||
Non-current assets | ||||||||
Property and equipment | 16,559 | 16,080 | ||||||
Intangible assets | 442 | 411 | ||||||
Deferred tax assets | 102 | 102 | ||||||
Other non-current assets | 1,377 | 1,386 | ||||||
Total Non-current assets | 18,480 | 17,979 | ||||||
Current assets | ||||||||
Inventories | 6,703 | 8,073 | ||||||
Trade and other receivables | 10,722 | 97,666 | ||||||
Income tax receivables | 635 | 786 | ||||||
Other taxes receivables | 3,084 | 3,313 | ||||||
Prepaid expenses | 10,405 | 10,544 | ||||||
Term deposits and other current assets | 991 | 927 | ||||||
Cash and cash equivalents | 304,901 | 485,575 | ||||||
Total Current assets | 337,441 | 606,884 | ||||||
Total Assets | 355,921 | 624,863 | ||||||
Equity and Liabilities | ||||||||
Equity | ||||||||
Share capital | 179,259 | 197,185 | ||||||
Share premium | 1,205,340 | 1,480,737 | ||||||
Other reserves | 108,623 | 110,244 | ||||||
Accumulated losses | (1,268,719 | ) | (1,295,793 | ) | ||||
Equity attributable to the equity holders of the Company | 224,503 | 492,373 | ||||||
Non-controlling interests | (343) | (349) | ||||||
Total Equity | 224,160 | 492,024 | ||||||
Liabilities | ||||||||
Non-current liabilities | ||||||||
Non-current borrowings | 7,950 | 7,981 | ||||||
Deferred tax liabilities | 50 | 7 | ||||||
Provisions for liabilities and other charges - non-current | 361 | 429 | ||||||
Deferred income - non-current | 831 | 739 | ||||||
Total Non-current liabilities | 9,192 | 9,156 | ||||||
Current liabilities | ||||||||
Current borrowings | 2,966 | 3,228 | ||||||
Trade and other payables | 61,772 | 61,601 | ||||||
Income tax payables | 11,436 | 11,583 | ||||||
Other taxes payable | 10,327 | 10,914 | ||||||
Provisions for liabilities and other charges | 31,804 | 32,741 | ||||||
Deferred income | 4,264 | 3,616 | ||||||
Total Current liabilities | 122,569 | 123,683 | ||||||
Total Liabilities | 131,761 | 132,839 | ||||||
Total Equity and Liabilities | 355,921 | 624,863 | ||||||
(UNAUDITED)
Consolidated statement of cash flows as of March 31, 2020 and 2021
| For the three months ended | ||||||||
| March 31, | March 31, | |||||||
In thousands of EUR | 2020 | 2021 | ||||||
Loss before Income tax | (42,169) | (20,411) | ||||||
Depreciation and amortization of tangible and intangible assets | 2,128 | 1,910 | ||||||
Impairment losses on loans, receivables and other assets | 1,118 | 493 | ||||||
Impairment losses on obsolete inventories | 235 | 274 | ||||||
Share-based payment expense | 5,973 | 4,774 | ||||||
Net (gain)/loss from disposal of tangible and intangible assets | 10 | 26 | ||||||
Change in provision for other liabilities and charges | 1,235 | 819 | ||||||
Lease modification (income)/expense | - | (6 | ) | |||||
Interest (income)/expenses | (66 | ) | 299 | |||||
Net foreign exchange (gain)/loss | (1,370 | ) | (12,517 | ) | ||||
(Increase)/Decrease in trade and other receivables, prepayments and VAT receivables | 1,353 | 531 | ||||||
(Increase)/Decrease in inventories | (790 | ) | (1,384 | ) | ||||
Increase/(Decrease) in trade and other payables, deferred income and VAT payables | (6,455 | ) | (4,032 | ) | ||||
Income taxes paid | (467 | ) | (266 | ) | ||||
Net cash flows used in operating activities | (39,265) | (29,490) | ||||||
Cash flows from investing activities | ||||||||
Purchase of property and equipment | (453 | ) | (367 | ) | ||||
Proceeds from disposal of property and equipment | - | 8 | ||||||
Purchase of intangible assets | - | (15 | ) | |||||
Interest received | 90 | 40 | ||||||
Movement in other non-current assets | 58 | 23 | ||||||
Movement in term deposits and other current assets | 62,278 | 84 | ||||||
Net cash flows (used in) / from investing activities | 61,973 | (227) | ||||||
Cash flows from financing activities | ||||||||
Interest settled - financing | (20 | ) | (7 | ) | ||||
Payment of lease interest | (278 | ) | (324 | ) | ||||
Repayment of lease liabilities | (1,284 | ) | (505 | ) | ||||
Equity transaction costs | - | (4,068 | ) | |||||
Capital contributions | - | 205,076 | ||||||
Net cash flows (used in) / from financing activities | (1,582) | 200,172 | ||||||
Net decrease/increase in cash and cash equivalents | 21,126 | 170,455 | ||||||
Effect of exchange rate changes on cash and cash equivalents | (1 | ) | 10,219 | |||||
Cash and cash equivalents at the beginning of the period | 170,021 | 304,901 | ||||||
Cash and cash equivalents at the end of the period | 191,146 | 485,575 | ||||||
Forward Looking Statements
This release includes forward-looking statements. All statements other than statements of historical facts contained in this release, including statements regarding our future results of operations and financial position, industry dynamics, business strategy and plans and our objectives for future operations, are forward-looking statements. These statements represent our opinions, expectations, beliefs, intentions, estimates or strategies regarding the future, which may not be realized. In some cases, you can identify forward-looking statements by terms such as "may," "will," "should," "expects," "plans," "anticipates," "could," "intends," "targets," "projects," "believes," "estimates", "potential" or "continue" or the negative of these terms or other similar expressions that are intended to identify forward-looking statements. Forward-looking statements are based largely on our current expectations and projections about future events and financial trends that we believe may affect our financial condition, results of operations, business strategy, short-term and long-term business operations and objectives, and financial needs. These forward-looking statements involve known and unknown risks, uncertainties, changes in circumstances that are difficult to predict and other important factors that may cause our actual results, performance or achievements to be materially different from any future results, performance or achievements expressed or implied by the forward-looking statement, including, without limitation, the risks described under Item 3. "Key Information-D. Risk Factors," in our Annual Report on Form 20-F as filed with the US Securities and Exchange Commission. Moreover, new risks emerge from time to time. It is not possible for our management to predict all risks, nor can we assess the impact of all factors on our business or the extent to which any factor, or combination of factors, may cause actual results to differ materially from those contained in any forward-looking statements we may make. In light of these risks, uncertainties and assumptions, the forward-looking events and circumstances discussed in this release may not occur and actual results could differ materially and adversely from those anticipated or implied in the forward-looking statements. We caution you therefore against relying on these forward-looking statements, and we qualify all of our forward-looking statements by these cautionary statements.
The forward-looking statements included in this release are made only as of the date hereof. Although we believe that the expectations reflected in the forward-looking statements are reasonable, we cannot guarantee that the future results, levels of activity, performance or events and circumstances reflected in the forward-looking statements will be achieved or occur. Moreover, neither we nor our advisors nor any other person assumes responsibility for the accuracy and completeness of the forward-looking statements. Neither we nor our advisors undertake any obligation to update any forward-looking statements for any reason after the date of this release to conform these statements to actual results or to changes in our expectations, except as may be required by law. You should read this release with the understanding that our actual future results, levels of activity, performance and events and circumstances may be materially different from what we expect.
Non-IFRS and Other Financial and Operating Metrics
Changes, percentages, ratios and aggregate amounts presented have been calculated on the basis of unrounded figures.
This release includes certain financial measures and metrics not based on IFRS, including Adjusted EBITDA, as well as operating metrics, including Annual Active Consumers, Orders and GMV. We define Annual Active Consumers, Orders, GMV, Total Payment Volume, JumiaPay Transactions and Adjusted EBITDA as follows:
Annual Active Consumers means unique consumers who placed an order for a product or a service on our platform, within the 12-month period preceding the relevant date, irrespective of cancellations or returns.
We believe that Annual Active Consumers is a useful indicator for adoption of our offering by consumers in our markets.
Orders corresponds to the total number of orders for products and services on our platform, irrespective of cancellations or returns, for the relevant period.
We believe that the number of orders is a useful indicator to measure the total usage of our platform, irrespective of the monetary value of the individual transactions.
GMV corresponds to the total value of orders for products and services, including shipping fees, value added tax, and before deductions of any discounts or vouchers, irrespective of cancellations or returns for the relevant period.
We believe that GMV is a useful indicator for the usage of our platform that is not influenced by shifts in our sales between first-party and third-party sales or the method of payment.
We use Annual Active Consumers, Orders and GMV as some of many indicators to monitor usage of our platform.
Total Payment Volume ("TPV") corresponds to the total value of orders for products and services for which JumiaPay was used including shipping fees, value-added tax, and before deductions of any discounts or vouchers, irrespective of cancellations or returns, for the relevant period.
We believe that TPV, which corresponds to the share of GMV for which JumiaPay was used, provides a useful indicator of the development, and adoption by consumers, of the payment services offerings we make
available, directly and indirectly, through JumiaPay.
JumiaPay Transactions corresponds to the total number of orders for products and services on our marketplace for which JumiaPay was used, irrespective of cancellations or returns, for the relevant period.
We believe that JumiaPay Transactions provides a useful indicator of the development, and adoption by consumers, of the cashless payment services offerings we make available for orders on our platform irrespective of the monetary value of the individual transactions.
We use TPV and the number of JumiaPay Transactions to measure the development of our payment services and the progressive conversion of cash on delivery orders into prepaid orders.
Adjusted EBITDA corresponds to loss for the period, adjusted for income tax expense (benefit), finance income, finance costs, depreciation and amortization and further adjusted for share-based payment expense.
Adjusted EBITDA is a supplemental non-IFRS measure of our operating performance that is not required by, or presented in accordance with, IFRS. Adjusted EBITDA is not a measurement of our financial performance under IFRS and should not be considered as an alternative to loss for the period, loss before income tax or any other performance measure derived in accordance with IFRS. We caution investors that amounts presented in accordance with our definition of Adjusted EBITDA may not be comparable to similar measures disclosed by other companies, because not all companies and analysts calculate Adjusted EBITDA in the same manner. We present Adjusted EBITDA because we consider it to be an important supplemental measure of our operating performance. Management believes that investors' understanding of our performance is enhanced by including non-IFRS financial measures as a reasonable basis for comparing our ongoing results of operations. By providing this non-IFRS financial measure, together with a reconciliation to the nearest IFRS financial measure, we believe we are enhancing investors' understanding of our business and our results of operations, as well as assisting investors in evaluating how well we are executing our strategic initiatives.
Management uses Adjusted EBITDA:
- as a measurement of operating performance because it assists us in comparing our operating performance on a consistent basis, as it removes the impact of items not directly resulting from our core operations;
- for planning purposes, including the preparation of our internal annual operating budget and financial projections;
- to evaluate the performance and effectiveness of our strategic initiatives; and
- to evaluate our capacity to expand our business.
Items excluded from this non-IFRS measure are significant components in understanding and assessing financial performance. Adjusted EBITDA has limitations as an analytical tool and should not be considered in isolation, or as an alternative to, or a substitute for analysis of our results reported in accordance with IFRS, including loss for the period. Some of the limitations are:
- Adjusted EBITDA does not reflect our share-based payments, income tax expense (benefit) or the amounts necessary to pay our taxes;
- although depreciation and amortization are eliminated in the calculation of Adjusted EBITDA, the assets being depreciated and amortized will often have to be replaced in the future and such measures do not reflect any costs for such replacements; and
- other companies may calculate Adjusted EBITDA differently than we do, limiting its usefulness as a comparative measure.
Due to these limitations, Adjusted EBITDA should not be considered as a measure of discretionary cash available to us to invest in the growth of our business. We compensate for these and other limitations by providing a reconciliation of Adjusted EBITDA to the most directly comparable IFRS financial measure, loss for the period.
The following table provides a reconciliation of loss for the period to Adjusted EBITDA for the periods indicated:
| For the three months ended | ||||||||
| March 31, | ||||||||
(€ million) | 2020 | 2021 | ||||||
Loss for the period | (42.3) | (20.6) | ||||||
Income tax expense | 0.1 | 0.2 | ||||||
Net Finance costs / (income) | (1.6 | ) | (13.3 | ) | ||||
Depreciation and amortization | 2.1 | 1.9 | ||||||
Share-based payment expense | 6.0 | 4.8 | ||||||
Adjusted EBITDA | (35.6) | (27.0) | ||||||
Certain metrics have also been presented on a constant currency basis. We use constant currency information to provide us with a picture of underlying business dynamics, excluding currency effects.
Constant currency metrics are calculated using the average monthly exchange rates for each month during 2020 and applying them to the corresponding months in 2021, so as to calculate what our results would have been had exchange rates remained stable from one year to the next. Constant currency information is not a measure calculated in accordance with IFRS. While we believe that constant currency information may be useful to investors in understanding and evaluating our results of operations in the same manner as our management, our use of constant currency metrics has limitations as an analytical tool, and you should not consider it in isolation, or as an alternative to, or a substitute for analysis of our financial results as reported under IFRS. Further, other companies, including companies in our industry, may report the impact of fluctuations in foreign currency exchange rates differently, which may reduce the value of our constant currency information as a comparative measure.
The following table sets forth the constant currency data for selected metrics.
For the three months ended March 31 | ||||||||||||||||||||||||
As reported | YoY | As reported | Constant currency | YoY | ||||||||||||||||||||
In € million, except percentages | 2020 | 2021 | Change | 2020 | 2021 | Change | ||||||||||||||||||
GMV | 189.6 | 165.0 | (13.0) | % | 189.6 | 180.0 | (5.1) | % | ||||||||||||||||
TPV | 35.5 | 42.9 | 20.9 | % | 35.5 | 47.9 | 35.1 | % | ||||||||||||||||
TPV as % of GMV | 18.7 | % | 26.0 | % | 18.7 | % | 26.6 | % | ||||||||||||||||
Gross Profit | 18.4 | 20.4 | 10.9 | % | 18.4 | 22.2 | 20.9 | % | ||||||||||||||||
Fulfillment expense | (15.9 | ) | (14.2 | ) | (10.7) | % | (15.9 | ) | (15.4 | ) | (3.0) | % | ||||||||||||
Gross Profit after Fulfillment expense | 2.5 | 6.2 | 149.5 | % | 2.5 | 6.8 | 174.6 | % | ||||||||||||||||
Sales and advertising expense | (8.9 | ) | (8.1 | ) | (9.1) | % | (8.9 | ) | (8.8 | ) | (1.3) | % | ||||||||||||
Technology and content expense | (7.2 | ) | (6.9 | ) | (4.2) | % | (7.2 | ) | (6.9 | ) | (3.7) | % | ||||||||||||
G&A expense, excluding SBC | (24.4 | ) | (20.3 | ) | (17.0) | % | (24.4 | ) | (22.4 | ) | (8.1) | % | ||||||||||||
Adjusted EBITDA | (35.6 | ) | (27.0 | ) | (24.2) | % | (35.6 | ) | (28.6 | ) | (19.6) | % | ||||||||||||
Operating Loss | (43.7 | ) | (33.7 | ) | (23.0) | % | (43.7 | ) | (35.6 | ) | (18.6) | % | ||||||||||||
For the full year ended December 31 | ||||||||||||||||||||||||
| As reported | YoY | As reported | Constant currency | YoY | ||||||||||||||||||||
In € million, except percentages | 2019 | 2020 | Change | 2019 | 2020 | Change | ||||||||||||||||||
GMV | 1,030.9 | (1) | 836.5 | (18.9) | % | 1,030.9 | 861.5 | (16.4) | % | |||||||||||||||
TPV | 124.3 | 196.4 | 58.0 | % | 124.3 | 203.6 | 63.8 | % | ||||||||||||||||
TPV as % of GMV | 12.1 | % | 23.5 | % | 12.1 | % | 23.6 | % | ||||||||||||||||
Gross Profit | 75.9 | 92.8 | 22.3 | % | 75.9 | 96.3 | 26.9 | % | ||||||||||||||||
Fulfillment expense | (77.4 | ) | (69.3 | ) | (10.4) | % | (77.4 | ) | (71.6 | ) | (7.5) | % | ||||||||||||
Gross Profit after Fulfillment expense | (1.5 | ) | 23.5 | n.m. | (1.5 | ) | 24.7 | n.m. | ||||||||||||||||
Sales and advertising expense | (56.0 | ) | (32.5 | ) | (42.0) | % | (56.0 | ) | (33.0 | ) | (41.2) | % | ||||||||||||
Technology and content expense | (27.3 | ) | (27.8 | ) | 2.0 | % | (27.3 | ) | (27.9 | ) | 2.4 | % | ||||||||||||
G&A expense, excluding SBC | (107.3 | ) | (94.0 | ) | (12.3) | % | (107.3 | ) | (97.9 | ) | (8.7) | % | ||||||||||||
Adjusted EBITDA | (182.7 | ) | (119.5 | ) | (34.6) | % | (182.7 | ) | (122.5 | ) | (32.9) | % | ||||||||||||
Operating Loss | (227.9 | ) | (149.2 | ) | (34.5) | % | (227.9 | ) | (152.5 | ) | (33.1) | % | ||||||||||||
(1) Adjusted for perimeter changes: exit of Cameroon, Rwanda, Tanzania and the travel activities and improper sales practices.
CONTACTS:
Safae Damir
Head of Investor Relations
investor-relations@jumia.com
Abdesslam Benzitouni
Head of PR and Communications
press@jumia.com
SOURCE: Jumia Technologies AG
https://www.accesswire.com/646254/Jumia-Reports-First-Quarter-2021-Results-Continued-Progress-Towards-Profitability

© 2024 Benzinga.com. Benzinga does not provide investment advice. All rights reserved.
Date | ticker | name | Actual EPS | EPS Surprise | Actual Rev | Rev Surprise |
|---|
Trade confidently with insights and alerts from analyst ratings, free reports and breaking news that affects the stocks you care about.

