


Non-recurring Acquisition Related Expenses totaled $775,000, or $0.08 per Diluted Share
Limestone Bancorp, Inc. LMST ("the Company"), parent company of Limestone Bank ("the Bank"), today reported unaudited results for the fourth quarter and full year 2019. Net income available to common shareholders for the fourth quarter of 2019 was $1.8 million, or $0.24 per basic and diluted common share, compared with $2.4 million, or $0.33 per basic and diluted share, for the fourth quarter of 2018. Net income for the year ended December 31, 2019, was $10.5 million, or $1.41 per diluted common share, compared with $8.8 million, or $1.23 per diluted share, for the year ended December 31, 2018.
This press release features multimedia. View the full release here: https://www.businesswire.com/news/home/20200122005728/en/

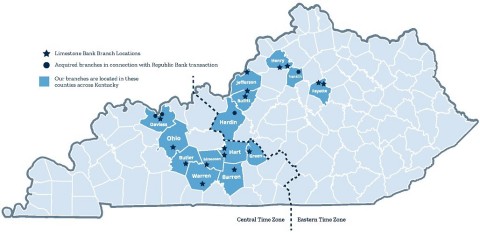
Limestone Bank Branch Locations (Graphic: Business Wire)
Net income before taxes was $11.0 million for the year ended December 31, 2019, compared with $10.8 million for the year ended December 31, 2018. Income tax expense was $480,000 for 2019 compared to $2.0 million for 2018.
Branch Acquisition – On November 15, 2019, the Bank completed the acquisition of four branch banking centers located in the Kentucky cities of Elizabethtown, Frankfort, and Owensboro. The purchase included approximately $126.8 million in performing loans and $1.5 million in premises and equipment, as well as approximately $131.8 million in customer deposits. This acquisition allows the Bank to further optimize its branch footprint regionally and solidifies its presence and ability to serve customers in Daviess, Hardin, and Franklin counties. Fourth quarter results were impacted by non-recurring acquisition related expenses of approximately $775,000, or $0.08 per common share after taxes.
Income Taxes – During the first and second quarters of 2019, the Company benefitted from the enactment of state tax legislation eliminating the Kentucky bank franchise tax which is assessed at a rate of 1.1% of average capital. The legislation implements a state income tax for the Bank at a statutory rate of 5%. The new Kentucky income tax will go into effect on January 1, 2021, and the Company will begin filing a Kentucky combined filing in 2021. The enactment resulted in a tax benefit of $341,000, or $0.05 per basic and diluted share, in the first quarter of 2019 and $1.2 million, or approximately $0.16 per basic and diluted share, in the second quarter of 2019.
Net Interest Income – On a sequential quarter basis, net interest margin was under pressure as the Federal Reserve lowered its federal funds target rate by 25 basis points on July 31, 2019, September 18, 2019, and October 30, 2019. The Company's interest rate risk profile is marginally asset sensitive as its assets generally reprice more quickly than its liabilities over a twelve-month horizon. In particular, the Fed's actions served to lower rates on the short end of the yield curve impacting yields on fed funds, certain floating rate investment securities, and loans with variable rate pricing features. As of December 31, 2019, time deposits comprise $476.5 million of the Company's liabilities with $389.3 million, or 82%, set to reprice or mature within one year of which, $179.4 million with a current average rate of 2.19% reprice or mature in the first quarter of 2020.
Net interest income was $8.9 million for the fourth quarter of 2019, compared to $8.7 million in the third quarter of 2019, and $8.7 million in the fourth quarter of 2018. Average loans increased to $846.2 million for the fourth quarter of 2019, compared to $800.2 million for the third quarter of 2019 and $765.5 million for the fourth quarter of 2018, and was positively impacted by the loans acquired in the branch purchase transaction. Net interest margin decreased to 3.23% in the fourth quarter of 2019, compared with 3.35% for the third quarter of 2019 and 3.46% for the fourth quarter of 2018.
The yield on earning assets decreased to 4.57% for the fourth quarter of 2019, compared to 4.79% for the third quarter of 2019 and 4.66% in the fourth quarter of 2018. Loan fee income can meaningfully impact net interest income, loan yields, and net interest margin. The amount of loan fee income included in total interest income was $218,000, $247,000, and $167,000 for the quarters ended December 31, 2019, September 30, 2019, and December 31, 2018, respectively. This represents eight basis points, nine basis points, and seven basis points of yield on earning assets and net interest margin for the quarters ended December 31, 2019, September 30, 2019, and December 31, 2018, respectively.
The cost of interest-bearing liabilities was 1.65% for the fourth quarter of 2019, compared to 1.75% for the third quarter of 2019 and 1.46% for the fourth quarter of 2018. Net interest income and the cost of interest-bearing liabilities for the fourth quarter of 2019 were also impacted by the subordinated debt issuance of $17.0 million at a fixed rate of 5.75% on July 23, 2019. This capital was deployed in the branch acquisition transaction.
Net interest income increased to $35.4 million for the year ended December 31, 2019, compared with $33.7 million for 2018. Average loans increased to $801.8 million for 2019, compared with $743.4 million for 2018. Net interest margin decreased to 3.40% for 2019, compared with 3.53% for 2018. The yield on earning assets increased to 4.76% for the year ended December 31, 2019, compared to 4.55% for 2018 and cost of interest-bearing liabilities was 1.66% for 2019, compared to 1.23% for 2018.
Provision and Allowance for Loan Losses – The allowance for loan losses to total loans was 0.90% at December 31, 2019, compared to 1.11% at September 30, 2019, and 1.16% at December 31, 2018. Excluding acquired loans, the allowance for loan losses to total loans was 1.04% at December 31, 2019. Loans acquired in the branch purchase transaction totaled approximately $124.7 million at December 31, 2019, and were recorded at fair value as determined by an independent third party which includes adjustments for yield and credit risk. Net loan charge-offs were $504,000 for 2019, compared to net loan recoveries of $1.2 million for 2018. Based upon historically strong trends in asset quality and management's assessment of risk in the loan portfolio, no provision for loan losses was recorded for the year ended December 31, 2019, compared to a negative provision for loan losses of $500,000 for 2018. No provision was recorded in the fourth quarter of 2019 or 2018, respectively.
Non-performing Assets – Non-performing assets, which include loans on nonaccrual, accruing troubled debt restructurings, loans past due 90 days and still accruing, and other real estate owned ("OREO"), decreased to $5.2 million, or 0.42% of total assets, at December 31, 2019, compared with $5.8 million, or 0.51% of total assets, at September 30, 2019, and decreased compared to $6.4 million, or 0.60% of total assets, at December 31, 2018. Non-performing loans decreased to $2.0 million, or 0.22% of total loans, at December 31, 2019, compared with $2.6 million, or 0.32% of total loans, at September 30, 2019, and decreased from $2.9 million, or 0.38% of total loans, at December 31, 2018.
OREO remained unchanged at $3.2 million at December 31, 2019, compared to September 30, 2019, and decreased compared to $3.5 million at December 31, 2018. Fair value write-downs arising from changing marketing strategies and new appraisals totaled $260,000 for 2019, compared to $850,000 for 2018.
Non-interest Income and Expense – Non-interest income increased $139,000 to $5.9 million for the year ended December 31, 2019, compared with $5.8 million for the year ended December 31, 2018. The increase was primarily due to an increase in bank card interchange fees of $607,000 partially offset by a decrease in other non-interest income of $468,000 related to the $150,000 one-time gain on the sale of the secondary market residential servicing rights portfolio in the third quarter of 2018 and a $632,000 gain on the sale of a subdivided lot at the Company's headquarters offset by a $392,000 impairment charge associated with the transfer of the Bank's former data processing center to Premises Held for Sale in the fourth quarter of 2018.
Non-interest expense increased $1.1 million, or 3.9% to $30.3 million, for the year ended December 31, 2019, compared with $29.1 million for the year ended December 31, 2018, primarily due to approximately $775,000 of expenses attributable to the branch acquisition. There was also an increase of $744,000 in salary and employee benefits, as the Bank added sales talent and customer facing associates during 2019, and branch staff added in connection with the branch purchase transaction. Deposit account related expense increased $401,000, which was offset by decreases in OREO expenses of $500,000, and FDIC insurance expense of $346,000.
Non-interest income for the fourth quarter of 2019 decreased $18,000 to $1.7 million, compared with $1.7 million for the fourth quarter of 2018. The decrease from the fourth quarter of 2018 was primarily due to an increase in bank card interchange fees of $138,000 offset by a decrease in other non-interest income related to gains on sales as described in the paragraph above.
Non-interest expense increased $992,000 to $8.3 million for the fourth quarter of 2019, compared with $7.3 million for the fourth quarter of 2018. The increase from the fourth quarter of 2018 was primarily due to $775,000 of expenses attributable to the branch transaction as well as an increase of $278,000 in salary and employee benefits, as the Bank added sales talent and customer facing associates during 2019 and branch staff added in connection with the branch purchase transaction. This increase was partially offset by a decrease in OREO expenses of $243,000 and FDIC insurance expense of $118,000.
Capital – At December 31, 2019, the Bank's Tier 1 leverage ratio was 9.99%, compared with 9.60% at December 31, 2018, and its Total risk-based capital ratio was 12.08% at December 31, 2019, compared with 12.88% at December 31, 2018. At December 31, 2019, the Bank's Common equity Tier 1 risk-based capital ratio was 11.25%, compared with 11.83% at December 31, 2018. At December 31, 2019, the Company's Tier 1 leverage ratio was 8.30%, compared with 9.00% at December 31, 2018, and its Total risk-based capital ratio was 11.85%, compared with 12.23% at December 31, 2018. At December 31, 2019, the Company's Common equity Tier 1 risk-based capital ratio was 8.32%, compared with 9.44% at December 31, 2018. The decrease in the ratios resulted primarily from the core deposit intangible and goodwill arising from the branch acquisitions, which closed on November 15, 2019.
The Company's capital ratios were positively impacted by the $17.0 million of subordinated notes issued during the third quarter, as the subordinated notes meet the requirements to qualify as Tier 2 capital. The Bank's capital ratios also benefitted as the Company contributed $10.0 million of the proceeds to the Bank as Common Equity Tier 1 Capital.
About Limestone Bancorp, Inc.
Limestone Bancorp, Inc. LMST is a Louisville, Kentucky-based bank holding company, which operates banking centers in 14 counties through its wholly-owned subsidiary Limestone Bank. The Bank's markets include metropolitan Louisville in Jefferson County and the surrounding counties of Bullitt and Henry and extend south along the Interstate 65 corridor. The Bank serves south central, southern, and western Kentucky from banking centers in Barren, Butler, Daviess, Edmonson, Green, Hardin, Hart, Ohio, and Warren counties. The Bank also has banking centers in Lexington, Kentucky, the second largest city in the state, and Frankfort, Kentucky, the state capital. Limestone Bank is a traditional community bank with a wide range of personal and business banking products and services.
Forward-Looking Statements
Statements in this press release relating to Limestone Bancorp's plans, objectives, expectations or future performance are forward-looking statements within the meaning of the Private Securities Litigation Reform Act of 1995. The words "believe," "may," "should," "anticipate," "estimate," "expect," "intend," "objective," "possible," "seek," "plan," "strive" or similar words, or negatives of these words, identify forward-looking statements that involve risks and uncertainties. These forward-looking statements include statements related to the expected benefits of the branch acquisition. Although the Company's management believes the assumptions underlying the forward-looking statements contained herein are reasonable, any of these assumptions could be inaccurate. Therefore, there can be no assurance the forward-looking statements included herein will prove to be accurate. Factors that could cause actual results to differ from those discussed in forward-looking statements include, but are not limited to: economic conditions both generally and more specifically in the markets in which the Company and its subsidiaries operate; competition for the Company's customers from other providers of financial services; government legislation and regulation, which change from time to time and over which the Company has no control; changes in interest rates; material unforeseen changes in liquidity, results of operations, or financial condition of the Company's customers; and other risks detailed in the Company's filings with the Securities and Exchange Commission, all of which are difficult to predict and many of which are beyond the control of the Company. See Risk Factors outlined in the Company's Form 10-K for the year ended December 31, 2018.
Additional Information
Unaudited supplemental financial information for the fourth quarter ending December 31, 2019, follows.
LIMESTONE BANCORP, INC. Unaudited Financial Information (in thousands, except share and per share data) |
|||||||||||||
|
Three |
|
Three |
|
Twelve |
|
Twelve |
|
|||||
|
Months |
|
Months |
|
Months |
|
Months |
|
|||||
|
Ended |
|
Ended |
|
Ended |
|
Ended |
|
|||||
|
12/31/19 |
|
12/31/18 |
|
12/31/19 |
|
12/31/18 |
|
|||||
|
|
|
|
|
|
|
|
|
|||||
Income Statement Data |
|
|
|
|
|
|
|
|
|
|
|
|
|
Interest income |
$ |
12,537 |
|
$ |
11,741 |
|
$ |
49,584 |
|
$ |
43,461 |
|
|
Interest expense |
|
3,676 |
|
|
3,037 |
|
|
14,234 |
|
|
9,790 |
|
|
Net interest income |
|
8,861 |
|
|
8,704 |
|
|
35,350 |
|
|
33,671 |
|
|
Provision (negative provision) for loan losses |
|
— |
|
|
— |
|
|
— |
|
|
(500 |
) |
|
Net interest income after provision |
|
8,861 |
|
|
8,704 |
|
|
35,350 |
|
|
34,171 |
|
|
|
|
|
|
|
|
|
|
|
|
|
|
|
|
Service charges on deposit accounts |
|
681 |
|
|
588 |
|
|
2,381 |
|
|
2,355 |
|
|
Bank card interchange fees |
|
711 |
|
|
573 |
|
|
2,438 |
|
|
1,831 |
|
|
Bank owned life insurance income |
|
96 |
|
|
100 |
|
|
410 |
|
|
437 |
|
|
Gain (loss) on sales and calls of securities, net |
|
— |
|
|
— |
|
|
(5 |
) |
|
(6 |
) |
|
Other |
|
166 |
|
|
411 |
|
|
694 |
|
|
1,162 |
|
|
Non-interest income |
|
1,654 |
|
|
1,672 |
|
|
5,918 |
|
|
5,779 |
|
|
|
|
|
|
|
|
|
|
|
|
|
|
|
|
Salaries & employee benefits |
|
4,201 |
|
|
3,923 |
|
|
16,233 |
|
|
15,489 |
|
|
Occupancy and equipment |
|
890 |
|
|
915 |
|
|
3,522 |
|
|
3,586 |
|
|
Professional fees |
|
171 |
|
|
201 |
|
|
769 |
|
|
814 |
|
|
Marketing expense |
|
218 |
|
|
247 |
|
|
908 |
|
|
1,114 |
|
|
FDIC insurance |
|
— |
|
|
118 |
|
|
211 |
|
|
557 |
|
|
Data processing expense |
|
316 |
|
|
280 |
|
|
1,259 |
|
|
1,192 |
|
|
State franchise and deposit tax |
|
265 |
|
|
272 |
|
|
1,210 |
|
|
1,118 |
|
|
Deposit account related expense |
|
333 |
|
|
170 |
|
|
1,224 |
|
|
823 |
|
|
Other real estate owned expense |
|
35 |
|
|
278 |
|
|
368 |
|
|
868 |
|
|
Litigation and loan collection expense |
|
77 |
|
|
83 |
|
|
189 |
|
|
245 |
|
|
Communications expense |
|
200 |
|
|
174 |
|
|
772 |
|
|
701 |
|
|
Insurance expense |
|
109 |
|
|
107 |
|
|
444 |
|
|
478 |
|
|
Postage and delivery |
|
140 |
|
|
66 |
|
|
544 |
|
|
364 |
|
|
Acquisition costs |
|
775 |
|
|
— |
|
|
775 |
|
|
— |
|
|
Other |
|
584 |
|
|
488 |
|
|
1,842 |
|
|
1,777 |
|
|
Non-interest expense |
|
8,314 |
|
|
7,322 |
|
|
30,270 |
|
|
29,126 |
|
|
|
|
|
|
|
|
|
|
|
|
|
|
|
|
Income before income taxes |
|
2,201 |
|
|
3,054 |
|
|
10,998 |
|
|
10,824 |
|
|
Income tax expense |
|
437 |
|
|
614 |
|
|
480 |
|
|
2,030 |
|
|
Net income |
$ |
1,764 |
|
$ |
2,440 |
|
$ |
10,518 |
|
$ |
8,794 |
|
|
|
|
|
|
|
|
|
|
|
|
|
|
|
|
Weighted average shares – Basic |
|
7,471,680 |
|
|
7,457,206 |
|
|
7,468,215 |
|
|
7,159,723 |
|
|
Weighted average shares – Diluted |
|
7,471,680 |
|
|
7,457,206 |
|
|
7,468,215 |
|
|
7,159,723 |
|
|
|
|
|
|
|
|
|
|
|
|
|
|
|
|
Basic earnings per common share |
$ |
0.24 |
|
$ |
0.33 |
|
$ |
1.41 |
|
$ |
1.23 |
|
|
Diluted earnings per common share |
$ |
0.24 |
|
$ |
0.33 |
|
$ |
1.41 |
|
$ |
1.23 |
|
|
Cash dividends declared per common share |
$ |
0.00 |
|
$ |
0.00 |
|
$ |
0.00 |
|
$ |
0.00 |
|
|
|
|
|
|
|
|
|
|
|
|
|
|
|
|
| LIMESTONE BANCORP, INC.
Unaudited Financial Information (in thousands, except share and per share data) |
||||||||||||||||
|
Three |
|
Three |
|
Three |
|
Three |
|
Three |
|
||||||
|
Months |
|
Months |
|
Months |
|
Months |
|
Months |
|
||||||
|
Ended |
|
Ended |
|
Ended |
|
Ended |
|
Ended |
|
||||||
|
12/31/19 |
|
9/30/19 |
|
6/30/19 |
|
3/31/19 |
|
12/31/18 |
|
||||||
|
|
|
|
|
|
|
|
|
|
|
||||||
Income Statement Data |
|
|
|
|
|
|
|
|
|
|
|
|
|
|
|
|
Interest income |
$ |
12,537 |
|
$ |
12,485 |
|
$ |
12,376 |
|
$ |
12,186 |
|
$ |
11,741 |
|
|
Interest expense |
|
3,676 |
|
|
3,755 |
|
|
3,576 |
|
|
3,227 |
|
|
3,037 |
|
|
Net interest income |
|
8,861 |
|
|
8,730 |
|
|
8,800 |
|
|
8,959 |
|
|
8,704 |
|
|
Provision (negative provision) for loan losses |
|
— |
|
|
— |
|
|
— |
|
|
— |
|
|
— |
|
|
Net interest income after provision |
|
8,861 |
|
|
8,730 |
|
|
8,800 |
|
|
8,959 |
|
|
8,704 |
|
|
|
|
|
|
|
|
|
|
|
|
|
|
|
|
|
|
|
Service charges on deposit accounts |
|
681 |
|
|
633 |
|
|
571 |
|
|
496 |
|
|
588 |
|
|
Bank card interchange fees |
|
711 |
|
|
623 |
|
|
596 |
|
|
508 |
|
|
573 |
|
|
Bank owned life insurance income |
|
96 |
|
|
97 |
|
|
118 |
|
|
99 |
|
|
100 |
|
|
Gain (loss) on sales and calls of securities, net |
|
— |
|
|
— |
|
|
(5 |
) |
|
— |
|
|
— |
|
|
Other |
|
166 |
|
|
181 |
|
|
166 |
|
|
181 |
|
|
411 |
|
|
Non-interest income |
|
1,654 |
|
|
1,534 |
|
|
1,446 |
|
|
1,284 |
|
|
1,672 |
|
|
|
|
|
|
|
|
|
|
|
|
|
|
|
|
|
|
|
Salaries & employee benefits |
|
4,201 |
|
|
4,202 |
|
|
3,915 |
|
|
3,915 |
|
|
3,923 |
|
|
Occupancy and equipment |
|
890 |
|
|
880 |
|
|
854 |
|
|
898 |
|
|
915 |
|
|
Professional fees |
|
171 |
|
|
254 |
|
|
179 |
|
|
165 |
|
|
201 |
|
|
Marketing expense |
|
218 |
|
|
251 |
|
|
212 |
|
|
227 |
|
|
247 |
|
|
FDIC insurance |
|
— |
|
|
— |
|
|
103 |
|
|
108 |
|
|
118 |
|
|
Data processing expense |
|
316 |
|
|
315 |
|
|
315 |
|
|
313 |
|
|
280 |
|
|
State franchise and deposit tax |
|
265 |
|
|
315 |
|
|
315 |
|
|
315 |
|
|
272 |
|
|
Deposit account related expense |
|
333 |
|
|
300 |
|
|
310 |
|
|
281 |
|
|
170 |
|
|
Other real estate owned expense |
|
35 |
|
|
25 |
|
|
142 |
|
|
166 |
|
|
278 |
|
|
Litigation and loan collection expense |
|
77 |
|
|
32 |
|
|
34 |
|
|
46 |
|
|
83 |
|
|
Communications expense |
|
200 |
|
|
193 |
|
|
189 |
|
|
190 |
|
|
174 |
|
|
Insurance expense |
|
109 |
|
|
109 |
|
|
112 |
|
|
114 |
|
|
107 |
|
|
Postage and delivery |
|
140 |
|
|
129 |
|
|
134 |
|
|
141 |
|
|
66 |
|
|
Acquisition costs |
|
775 |
|
|
— |
|
|
— |
|
|
— |
|
|
— |
|
|
Other |
|
584 |
|
|
446 |
|
|
410 |
|
|
402 |
|
|
488 |
|
|
Non-interest expense |
|
8,314 |
|
|
7,451 |
|
|
7,224 |
|
|
7,281 |
|
|
7,322 |
|
|
|
|
|
|
|
|
|
|
|
|
|
|
|
|
|
|
|
Income before income taxes |
|
2,201 |
|
|
2,813 |
|
|
3,022 |
|
|
2,962 |
|
|
3,054 |
|
|
Income tax expense (benefit) |
|
437 |
|
|
531 |
|
|
(611 |
) |
|
123 |
|
|
614 |
|
|
Net income |
$ |
1,764 |
|
$ |
2,282 |
|
$ |
3,633 |
|
$ |
2,839 |
|
$ |
2,440 |
|
|
|
|
|
|
|
|
|
|
|
|
|
|
|
|
|
|
|
Weighted average shares – Basic |
|
7,471,680 |
|
|
7,471,582 |
|
|
7,459,631 |
|
|
7,469,912 |
|
|
7,457,206 |
|
|
Weighted average shares – Diluted |
|
7,471,680 |
|
|
7,471,582 |
|
|
7,459,631 |
|
|
7,469,912 |
|
|
7,457,206 |
|
|
|
|
|
|
|
|
|
|
|
|
|
|
|
|
|
|
|
Basic earnings per common share |
$ |
0.24 |
|
$ |
0.31 |
|
$ |
0.49 |
|
$ |
0.38 |
|
$ |
0.33 |
|
|
Diluted earnings per common share |
$ |
0.24 |
|
$ |
0.31 |
|
$ |
0.49 |
|
$ |
0.38 |
|
$ |
0.33 |
|
|
Cash dividends declared per common share |
$ |
0.00 |
|
$ |
0.00 |
|
$ |
0.00 |
|
$ |
0.00 |
|
$ |
0.00 |
|
|
| LIMESTONE BANCORP, INC.
Unaudited Financial Information (in thousands, except share and per share data) |
|||||||||||||||||
|
|
As of |
|
||||||||||||||
|
|
12/31/19 |
|
9/30/19 |
|
6/30/19 |
|
|
3/31/19 |
|
|
12/31/18 |
|
||||
|
|
|
|
|
|
|
|
|
|
|
|
|
|
|
|
||
Assets |
|
|
|
|
|
|
|
|
|
|
|
|
|
|
|
||
Loans |
$ |
926,271 |
|
$ |
803,569 |
|
$ |
803,114 |
|
$ |
786,585 |
|
$ |
765,244 |
|
||
Allowance for loan losses |
|
(8,376 |
) |
|
(8,904 |
) |
|
(8,832 |
) |
|
(8,686 |
) |
|
(8,880 |
) |
||
Net loans |
|
917,895 |
|
|
794,665 |
|
|
794,282 |
|
|
777,899 |
|
|
756,364 |
|
||
Securities available for sale |
|
209,000 |
|
|
203,381 |
|
|
208,614 |
|
|
206,411 |
|
|
201,192 |
|
||
Federal funds sold & interest-bearing deposits |
|
21,962 |
|
|
50,327 |
|
|
40,755 |
|
|
24,029 |
|
|
28,398 |
|
||
Cash and due from financial institutions |
|
8,241 |
|
|
7,680 |
|
|
6,860 |
|
|
6,461 |
|
|
6,963 |
|
||
Premises and equipment |
|
19,658 |
|
|
15,098 |
|
|
14,827 |
|
|
14,926 |
|
|
14,655 |
|
||
Premises held for sale |
|
900 |
|
|
935 |
|
|
995 |
|
|
1,050 |
|
|
1,050 |
|
||
Bank owned life insurance |
|
16,037 |
|
|
15,946 |
|
|
15,853 |
|
|
15,739 |
|
|
15,646 |
|
||
FHLB Stock |
|
6,237 |
|
|
6,467 |
|
|
6,693 |
|
|
6,813 |
|
|
7,233 |
|
||
Other real estate owned |
|
3,225 |
|
|
3,225 |
|
|
3,225 |
|
|
3,335 |
|
|
3,485 |
|
||
Deferred taxes, net |
|
27,765 |
|
|
28,029 |
|
|
28,708 |
|
|
28,568 |
|
|
29,282 |
|
||
Goodwill |
|
6,252 |
|
|
— |
|
|
— |
|
|
— |
|
|
— |
|
||
Intangible assets |
|
2,500 |
|
|
— |
|
|
— |
|
|
— |
|
|
— |
|
||
Accrued interest receivable and other assets |
|
6,107 |
|
|
6,411 |
|
|
5,976 |
|
|
6,092 |
|
|
5,424 |
|
||
Total Assets |
$ |
1,245,779 |
|
$ |
1,132,164 |
|
$ |
1,126,788 |
|
$ |
1,091,323 |
|
$ |
1,069,692 |
|
||
|
|
|
|
|
|
|
|
|
|
|
|
|
|
|
|
||
Liabilities and Equity |
|
|
|
|
|
|
|
|
|
|
|
|
|
|
|
||
Certificates of deposit |
$ |
476,534 |
|
$ |
488,121 |
|
$ |
505,263 |
|
$ |
465,369 |
|
$ |
450,886 |
|
||
Interest checking |
|
146,038 |
|
|
95,508 |
|
|
95,296 |
|
|
96,537 |
|
|
94,269 |
|
||
Money market |
|
160,837 |
|
|
153,663 |
|
|
162,917 |
|
|
166,430 |
|
|
171,924 |
|
||
Savings |
|
56,015 |
|
|
34,618 |
|
|
33,553 |
|
|
34,066 |
|
|
34,534 |
|
||
Total interest-bearing deposits |
|
839,424 |
|
|
771,910 |
|
|
797,029 |
|
|
762,402 |
|
|
751,613 |
|
||
Demand deposits |
|
187,551 |
|
|
151,524 |
|
|
141,448 |
|
|
146,440 |
|
|
142,618 |
|
||
Total deposits |
|
1,026,975 |
|
|
923,434 |
|
|
938,477 |
|
|
908,842 |
|
|
894,231 |
|
||
FHLB advances |
|
61,389 |
|
|
56,430 |
|
|
51,470 |
|
|
51,511 |
|
|
46,549 |
|
||
Junior subordinated debentures |
|
21,000 |
|
|
21,000 |
|
|
21,000 |
|
|
21,000 |
|
|
21,000 |
|
||
Subordinated capital note |
|
17,000 |
|
|
17,000 |
|
|
— |
|
|
— |
|
|
— |
|
||
Senior debt |
|
5,000 |
|
|
5,000 |
|
|
10,000 |
|
|
10,000 |
|
|
10,000 |
|
||
Accrued interest payable and other liabilities |
|
8,665 |
|
|
4,973 |
|
|
4,419 |
|
|
3,651 |
|
|
5,815 |
|
||
Total liabilities |
|
1,140,029 |
|
|
1,027,837 |
|
|
1,025,366 |
|
|
995,004 |
|
|
977,595 |
|
||
|
|
|
|
|
|
|
|
|
|
|
|
|
|
|
|
||
Total common stockholders' equity |
|
105,750 |
|
|
104,327 |
|
|
101,422 |
|
|
96,319 |
|
|
92,097 |
|
||
Total Liabilities and Stockholders' Equity |
$ |
1,245,779 |
|
$ |
1,132,164 |
|
$ |
1,126,788 |
|
$ |
1,091,323 |
|
$ |
1,069,692 |
|
||
|
|
|
|
|
|
|
|
|
|
|
|
|
|
|
|
||
Ending shares outstanding |
|
7,471,975 |
|
|
7,471,582 |
|
|
7,457,832 |
|
|
7,460,614 |
|
|
7,462,720 |
|
||
Book value per common share |
$ |
14.15 |
|
$ |
13.96 |
|
$ |
13.60 |
|
$ |
12.91 |
|
$ |
12.34 |
|
||
Tangible book value per common share |
12.98 |
|
|
13.96 |
13.60 |
12.91 |
12.34 |
||||||||||
| LIMESTONE BANCORP, INC.
Unaudited Financial Information (in thousands, except share and per share data) |
||||||||||||||||||
|
|
As of |
||||||||||||||||
|
|
12/31/19 |
|
|
9/30/19 |
|
|
6/30/19 |
|
|
3/31/19 |
|
|
12/31/18 |
|
|||
Average Balance Sheet Data |
|
|
|
|
|
|
|
|
|
|
|
|
|
|
|
|||
Assets |
$ |
1,167,179 |
|
$ |
1,105,432 |
|
$ |
1,100,459 |
|
$ |
1,075,553 |
|
$ |
1,066,216 |
|
|||
Loans |
|
846,235 |
|
|
800,194 |
|
|
793,460 |
|
|
766,505 |
|
|
765,542 |
|
|||
Earning assets |
|
1,090,752 |
|
|
1,035,522 |
|
|
1,033,581 |
|
|
1,009,948 |
|
|
1,001,093 |
|
|||
Deposits |
|
982,991 |
|
|
933,548 |
|
|
926,730 |
|
|
900,829 |
|
|
895,377 |
|
|||
Long-term debt and advances |
|
73,695 |
|
|
63,369 |
|
|
71,989 |
|
|
76,524 |
|
|
75,339 |
|
|||
Interest bearing liabilities |
|
882,473 |
|
|
852,539 |
|
|
855,100 |
|
|
834,637 |
|
|
824,300 |
|
|||
Stockholders' equity |
|
105,295 |
|
|
103,818 |
|
|
97,730 |
|
|
93,491 |
|
|
89,836 |
|
|||
|
|
|
|
|
|
|
|
|
|
|
|
|
|
|
|
|||
Quarterly Performance Ratios |
|
|
|
|
|
|
|
|
|
|
|
|
|
|
|
|||
Return on average assets |
|
0.60 |
% |
|
0.82 |
% |
|
1.32 |
% |
|
1.07 |
% |
|
0.91 |
% |
|||
Return on average equity |
|
6.65 |
|
|
8.72 |
|
|
14.91 |
|
|
12.32 |
|
|
10.78 |
|
|||
Yield on average earning assets (tax equivalent) |
|
4.57 |
|
|
4.79 |
|
|
4.81 |
|
|
4.90 |
|
|
4.66 |
|
|||
Cost of interest-bearing liabilities |
|
1.65 |
|
|
1.75 |
|
|
1.68 |
|
|
1.57 |
|
|
1.46 |
|
|||
Net interest margin (tax equivalent) |
|
3.23 |
|
|
3.35 |
|
|
3.42 |
|
|
3.61 |
|
|
3.46 |
|
|||
Efficiency ratio |
|
71.70 |
|
|
72.59 |
|
|
70.47 |
|
|
71.08 |
|
|
70.57 |
|
|||
|
|
|
|
|
|
|
|
|
|
|
|
|
|
|
|
|||
Asset Quality Data |
|
|
|
|
|
|
|
|
|
|
|
|
|
|
|
|||
Nonaccrual loans |
$ |
1,528 |
|
$ |
2,389 |
|
$ |
2,028 |
|
$ |
1,921 |
|
$ |
1,991 |
|
|||
Troubled debt restructurings on accrual |
|
475 |
|
|
188 |
|
|
905 |
|
|
910 |
|
|
910 |
|
|||
Loan 90 days or more past due still on accrual |
|
— |
|
|
— |
|
|
— |
|
|
— |
|
|
— |
|
|||
Total non-performing loans |
|
2,003 |
|
|
2,577 |
|
|
2,933 |
|
|
2,831 |
|
|
2,901 |
|
|||
Real estate acquired through foreclosures |
|
3,225 |
|
|
3,225 |
|
|
3,225 |
|
|
3,335 |
|
|
3,485 |
|
|||
Other repossessed assets |
|
— |
|
|
— |
|
|
— |
|
|
— |
|
|
— |
|
|||
Total non-performing assets |
$ |
5,228 |
|
$ |
5,802 |
|
$ |
6,158 |
|
$ |
6,166 |
|
$ |
6,386 |
|
|||
|
|
|
|
|
|
|
|
|
|
|
|
|
|
|
|
|||
Non-performing loans to total loans |
|
0.22 |
% |
|
0.32 |
% |
|
0.37 |
% |
|
0.36 |
% |
|
0.38 |
% |
|||
Non-performing assets to total assets |
|
0.42 |
|
|
0.51 |
|
|
0.55 |
|
|
0.57 |
|
|
0.60 |
|
|||
Allowance for loan losses to non-performing loans |
|
418.17 |
|
|
345.52 |
|
|
301.13 |
|
|
306.82 |
|
|
306.10 |
|
|||
|
|
|
|
|
|
|
|
|
|
|
|
|
|
|
|
|||
Allowance for loan losses to total loans |
|
0.90 |
% |
|
1.11 |
% |
|
1.10 |
% |
|
1.10 |
% |
|
1.16 |
% |
|||
|
|
|
|
|
|
|
|
|
|
|
|
|
|
|
|
|||
Loan Charge-off Data |
|
|
|
|
|
|
|
|
|
|
|
|
|
|
|
|||
Loans charged off |
$ |
(639 |
) |
$ |
(299 |
) |
$ |
(72 |
) |
$ |
(278 |
) |
$ |
(133 |
) |
|||
Recoveries |
|
111 |
|
|
371 |
|
|
218 |
|
|
84 |
|
|
379 |
|
|||
Net recoveries (charge-offs) |
$ |
(528 |
) |
$ |
72 |
|
$ |
146 |
|
$ |
(194 |
) |
$ |
246 |
|
|||
|
|
|
|
|
|
|
|
|
|
|
|
|
|
|
|
|||
Loans by Risk Category |
|
|
|
|
|
|
|
|
|
|
|
|
|
|
|
|||
Pass |
$ |
888,707 |
|
$ |
754,050 |
|
$ |
767,662 |
|
$ |
756,493 |
|
$ |
745,604 |
|
|||
Watch |
|
27,522 |
|
|
37,537 |
|
|
22,929 |
|
|
17,412 |
|
|
13,164 |
|
|||
Special Mention |
|
— |
|
|
— |
|
|
— |
|
|
— |
|
|
113 |
|
|||
Substandard |
|
10,042 |
|
|
11,982 |
|
|
12,523 |
|
|
12,680 |
|
|
6,363 |
|
|||
Doubtful |
|
— |
|
|
— |
|
|
— |
|
|
— |
|
|
— |
|
|||
Total |
$ |
926,271 |
|
$ |
803,569 |
|
$ |
803,114 |
|
$ |
786,585 |
|
$ |
765,244 |
|
|||
|
|
|
|
|
|
|
|
|
|
|
|
|
|
|
|
|||
Loans by Past Due Status |
|
|
|
|
|
|
|
|
|
|
|
|
|
|
|
|||
Past due loans: |
|
|
|
|
|
|
|
|
|
|
|
|
|
|
|
|||
30 – 59 days |
$ |
1,747 |
|
$ |
979 |
|
$ |
858 |
|
$ |
2,001 |
|
$ |
1,593 |
|
|||
60 – 89 days |
|
670 |
|
|
557 |
|
|
1,015 |
|
|
240 |
|
|
331 |
|
|||
90 days or more |
|
— |
|
|
— |
|
|
— |
|
|
— |
|
|
— |
|
|||
Nonaccrual loans |
|
1,528 |
|
|
2,389 |
|
|
2,028 |
|
|
1,921 |
|
|
1,991 |
|
|||
Total past due and nonaccrual loans |
$ |
3,945 |
|
$ |
3,925 |
|
$ |
3,901 |
|
$ |
4,162 |
|
$ |
3,915 |
|
|||
| LIMESTONE BANCORP, INC.
Unaudited Financial Information (in thousands, except share and per share data) |
|||||||||||||||||
|
|
As of |
|||||||||||||||
|
|
12/31/19 |
|
|
9/30/19 |
|
|
6/30/19 |
|
|
3/31/19 |
|
|
12/31/18 |
|
||
Risk-based Capital Ratios - Company |
|
|
|
|
|
|
|
|
|
|
|
|
|
|
|
||
Tier I leverage ratio |
|
8.30 |
% |
|
9.66 |
% |
|
9.46 |
% |
|
9.30 |
% |
|
9.00 |
% |
||
Common equity Tier I risk-based capital ratio |
|
8.32 |
|
|
10.19 |
|
|
9.82 |
|
|
9.57 |
|
|
9.44 |
|
||
Tier I risk-based capital ratio |
|
9.32 |
|
|
11.88 |
|
|
11.56 |
|
|
11.29 |
|
|
11.08 |
|
||
Total risk-based capital ratio |
|
11.85 |
|
|
14.84 |
|
|
12.56 |
|
|
12.32 |
|
|
12.23 |
|
||
|
|
|
|
|
|
|
|
|
|
|
|
|
|
|
|
||
Risk-based Capital Ratios – Limestone Bank |
|
|
|
|
|
|
|
|
|
|
|
|
|
|
|
||
Tier I leverage ratio |
|
9.99 |
% |
|
11.25 |
% |
|
10.01 |
% |
|
9.88 |
% |
|
9.60 |
% |
||
Common equity Tier I risk-based capital ratio |
|
11.25 |
|
|
13.87 |
|
|
12.26 |
|
|
12.01 |
|
|
11.83 |
|
||
Tier I risk-based capital ratio |
|
11.25 |
|
|
13.87 |
|
|
12.26 |
|
|
12.01 |
|
|
11.83 |
|
||
Total risk-based capital ratio |
|
12.08 |
|
|
14.89 |
|
|
13.26 |
|
|
13.01 |
|
|
12.88 |
|
||
|
|
|
|
|
|
|
|
|
|
|
|
|
|
|
|
||
FTE employees |
|
244 |
|
|
226 |
|
|
219 |
|
|
207 |
|
|
214 |
|
||
Non-GAAP Financial Measures Reconciliation
Tangible book value per common share is a non-GAAP financial measure derived from GAAP based amounts. Tangible book value is calculated by excluding the balance of intangible assets from common stockholders' equity. Tangible book value per common share is calculated by dividing tangible common equity by common shares outstanding, as compared to book value per common share, which is calculated by dividing common stockholders' equity by common shares outstanding. Management believes this is consistent with bank regulatory agency treatment, which excludes tangible assets from the calculation of risk-based capital.
The efficiency ratio is a non-GAAP measure of expense control relative to revenue from net interest income and fee income. The efficiency ratio is calculated by dividing total non-interest expenses as determined under GAAP by net interest income and total non-interest income, but excluding from the calculation net gains on the sale of securities and expenses disclosed from time to time as non-recurring in nature. Management believes this provides a reasonable measure of primary banking expenses relative to primary banking revenue.
|
|
As of |
||||||||||||
|
|
12/31/19 |
|
|
9/30/19 |
|
|
6/30/19 |
|
|
3/31/19 |
|
|
12/31/18 |
Tangible Book Value Per Share |
(in thousands, except share and per share data) |
|||||||||||||
|
|
|||||||||||||
Common stockholder's equity |
$ |
105,750 |
|
$ |
104,327 |
|
$ |
101,422 |
|
$ |
96,319 |
|
$ |
92,097 |
Less: Goodwill |
|
6,252 |
|
|
— |
|
|
— |
|
|
— |
|
|
— |
Less: Intangible assets |
|
2,500 |
|
|
— |
|
|
— |
|
|
— |
|
|
— |
Tangible common equity |
|
96,998 |
|
|
104,327 |
|
|
101,422 |
|
|
96,319 |
|
|
92,097 |
|
|
|
|
|
|
|
|
|
|
|
|
|
|
|
Shares outstanding |
|
7,471,975 |
|
|
7,471,582 |
|
|
7,457,832 |
|
|
7,460,614 |
|
|
7,462,720 |
Tangible book value per common share |
$ |
12.98 |
|
$ |
13.96 |
|
$ |
13.60 |
|
$ |
12.91 |
|
$ |
12.34 |
Book value per common share |
|
14.15 |
|
|
13.96 |
|
|
13.60 |
|
|
12.91 |
|
|
12.34 |
|
|
|
|
|
|
|
|
|
|
|
|
|
|
|
|
Three Months Ended |
||||||||||||||
|
|
12/31/19 |
|
|
9/30/19 |
|
|
6/30/19 |
|
|
3/31/19 |
|
|
12/31/18 |
|
Efficiency Ratio |
(in thousands) |
|
|||||||||||||
|
|
|
|||||||||||||
Net interest income |
$ |
8,861 |
|
$ |
8,730 |
|
$ |
8,800 |
|
$ |
8,959 |
|
$ |
8,704 |
|
Non-interest income |
|
1,654 |
|
|
1,534 |
|
|
1,446 |
|
|
1,284 |
|
|
1,672 |
|
Less: Net gain (loss) on securities |
|
— |
|
|
— |
|
|
(5) |
|
|
— |
|
|
— |
|
Revenue used for efficiency ratio |
|
10,515 |
|
|
10,264 |
|
|
10,251 |
|
|
10,243 |
|
|
10,376 |
|
Non-interest expense |
|
8,314 |
|
|
7,451 |
|
|
7,224 |
|
|
7,281 |
|
|
7,322 |
|
Less: Acquisition costs |
|
775 |
|
|
— |
|
|
— |
|
|
— |
|
|
— |
|
Expenses used for efficiency ratio |
|
7,539 |
|
|
7,451 |
|
|
7,224 |
|
|
7,281 |
|
|
7,322 |
|
|
|
|
|
|
|
|
|
|
|
|
|
|
|
|
|
Efficiency ratio |
|
71.70 |
% |
|
72.59 |
% |
|
70.47 |
% |
|
71.08 |
% |
|
70.57 |
% |

View source version on businesswire.com: https://www.businesswire.com/news/home/20200122005728/en/
© 2024 Benzinga.com. Benzinga does not provide investment advice. All rights reserved.
Trade confidently with insights and alerts from analyst ratings, free reports and breaking news that affects the stocks you care about.

