


BELMONT, Mass., April 20, 2016 /PRNewswire/ -- BSB Bancorp, Inc. BLMT (the "Company"), the holding company for Belmont Savings Bank (the "Bank"), a state-chartered savings bank headquartered in Belmont, Massachusetts, today reported net income of $2.54 million or $0.28 per diluted share for the quarter ended March 31, 2016 compared to net income of $1.37 million or $0.16 per diluted share for the quarter ended March 31, 2015 or an increase in net income of 84.8%.
Robert M. Mahoney, President and Chief Executive Officer, said, "Strong asset growth coupled with disciplined expense management is a good formula for earnings. We have had 11 consecutive quarters of earnings growth and we are working hard to continue that trend. Credit quality remains good."

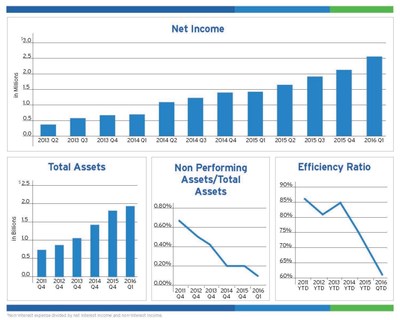
Photo - http://photos.prnewswire.com/prnh/20160419/357374
NET INTEREST AND DIVIDEND INCOME
Net interest and dividend income before provision for loan losses for the quarter ended March 31, 2016 was $11.28 million as compared to $8.76 million for the quarter ended March 31, 2015 or a 28.8% increase. The provision for loan losses for the quarter ended March 31, 2016 was $599,000 as compared to $338,000 for the quarter ended March 31, 2015 or a 77.2% increase, primarily due to loan growth. This resulted in an increase of $2.26 million or 26.9% in net interest and dividend income after provision for loan losses for the quarter ended March 31, 2016 as compared to the quarter ended March 31, 2015.
NONINTEREST INCOME
Noninterest income for the quarter ended March 31, 2016 was $660,000 as compared to $757,000 for the quarter ended March 31, 2015 or a decrease of 12.8%. This decrease was primarily driven by a decrease in other income and a decrease in loan servicing fee income due to a strategic decision to suspend indirect auto loan originations during 2015. Partially offsetting these decreases was an increase in income from bank owned life insurance due to $5 million of additional policies purchased in the second quarter of 2015.
NONINTEREST EXPENSE
Noninterest expense for the quarter ended March 31, 2016 was $7.25 million as compared to $6.94 million for the quarter ended March 31, 2015 or an increase of 4.6%. This increase was primarily driven by an increase in salaries and employee benefits costs. Our efficiency ratio improved to 60.7% during the quarter ended March 31, 2016 from 72.9% during the quarter ended March 31, 2015 as we continue to grow the balance sheet and manage costs. Improvements to our efficiency ratio were largely due to effectively managing headcount. Since going public in the fourth quarter of 2011, we've grown total assets from $669 million to $1.92 billion, or an increase of 186%, while only increasing employee headcount by 21 or 20.8% from 101 to 122.
BALANCE SHEET
At March 31, 2016, total assets were $1.92 billion, an increase of $103.3 million or 5.7% from $1.81 billion at December 31, 2015. The Company experienced net loan growth of $99.42 million or 6.5% from December 31, 2015. Residential 1-4 family real estate loans, commercial real estate loans and home equity lines of credit increased by $85.62 million, $40.87 million and $5.34 million, respectively. Partially offsetting these increases was a decrease in construction loans and commercial loans of $11.12 million and $9.40 million respectively, and a decrease in indirect auto loans of $11.79 million, driven by the suspension of new originations due to current market conditions. The asset growth was primarily funded by growth in deposits.
At March 31, 2016, deposits totaled $1.36 billion, an increase of $85.76 million or 6.8% from $1.27 billion at December 31, 2015. Core deposits, which we consider to include all deposits other than CD's and brokered CD's, increased by $51.81 million from $1.01 billion at December 31, 2015 to $1.06 billion at March 31, 2016. Hal R. Tovin, Executive Vice President and Chief Operating Officer, said, "Strong deposit growth continued in the first quarter. Our proven strategy of targeting deposit driven business opportunities, combined with the expansion of our municipal customer base and cross selling new and existing commercial real estate customers, continues to provide us a cost efficient funding source."
Total stockholders' equity increased by $3.14 million from $146.20 million as of December 31, 2015 to $149.34 million as of March 31, 2016. This increase is primarily the result of earnings of $2.54 million and a $525,000 increase in additional paid-in capital related to stock-based compensation.
ASSET QUALITY
The allowance for loan losses in total and as a percentage of total loans as of March 31, 2016 was $11.83 million and 0.72% respectively, as compared to $11.24 million and 0.73% respectively, as of December 31, 2015. For the quarter ended March 31, 2016, the Company recorded net charge offs of $8,000, as compared to net charge offs of $16,000 for the quarter ending March 31, 2015. Total non-performing assets were $1.20 million, or 0.06% of total assets, as of March 31, 2016, as compared to $3.64 million or 0.20% of total assets as of December 31, 2015.
Company Profile
BSB Bancorp, Inc. is headquartered in Belmont, Massachusetts and is the holding company for Belmont Savings Bank. The Bank provides financial services to individuals, families, municipalities and businesses through its six full-service branch offices located in Belmont, Watertown, Cambridge, Newton and Waltham in Southeast Middlesex County, Massachusetts. The Bank's primary lending market includes Essex, Middlesex, Norfolk and Suffolk Counties, Massachusetts. The Company's common stock is traded on the NASDAQ Capital Market under the symbol "BLMT." For more information, visit the Company's website at www.belmontsavings.com.
Forward-looking statements
Certain statements herein constitute "forward-looking statements" within the meaning of Section 27A of the Securities Act of 1933 and Section 21E of the Securities Exchange Act of 1934, as amended. These statements are based on the beliefs and expectations of management, as well as the assumptions made using information currently available to management. Since these statements reflect the views of management concerning future events, these statements involve risks, uncertainties and assumptions. As a result, actual results may differ from those contemplated by these statements. Forward-looking statements can be identified by the fact that they do not relate strictly to historical or current facts. They often include words like "believe," "expect," "anticipate," "estimate," and "intend" or future or conditional verbs such as "will," "would," "should," "could" or "may." Certain factors that could cause actual results to differ materially from expected results include changes in the interest rate environment, changes in general economic conditions, our ability to continue to increase loans and deposit growth, legislative and regulatory changes that adversely affect the businesses in which the Company is engaged, changes in the securities market, and other factors that are described in the Company's annual report on Form 10-K and quarterly reports on Form 10-Q as filed with the Securities and Exchange Commission. Readers are cautioned not to place undue reliance on these forward-looking statements, which speak only as of the date of this release. The Company disclaims any intent or obligation to update any forward-looking statements, whether in response to new information, future events or otherwise, except as may be required by law.
|
BSB BANCORP, INC. AND SUBSIDIARIES | |||||||
|
CONSOLIDATED BALANCE SHEETS | |||||||
|
(Dollars in thousands, except share and per share data) | |||||||
|
March 31, 2016 |
December 31, 2015 | ||||||
|
(unaudited) |
|||||||
|
ASSETS |
|||||||
|
Cash and due from banks |
$ 1,842 |
$ 1,871 | |||||
|
Interest-bearing deposits in other banks |
54,306 |
49,390 | |||||
|
Cash and cash equivalents |
56,148 |
51,261 | |||||
|
Interest-bearing time deposits with other banks |
134 |
131 | |||||
|
Investments in available-for-sale securities |
21,985 |
21,876 | |||||
|
Investments in held-to-maturity securities (fair value of $136,709 as of |
|||||||
|
March 31, 2016 and $136,728 as of December 31, 2015) |
135,204 |
137,119 | |||||
|
Federal Home Loan Bank stock, at cost |
20,611 |
18,309 | |||||
|
Loans held-for-sale |
- |
1,245 | |||||
|
Loans, net of allowance for loan losses of $11,831 as of |
|||||||
|
March 31, 2016 and $11,240 as of December 31, 2015 |
1,634,373 |
1,534,957 | |||||
|
Premises and equipment, net |
2,631 |
2,657 | |||||
|
Accrued interest receivable |
4,188 |
3,781 | |||||
|
Deferred tax asset, net |
6,416 |
6,726 | |||||
|
Bank-owned life insurance |
30,024 |
29,787 | |||||
|
Other assets |
4,509 |
5,067 | |||||
|
Total assets |
$ 1,916,223 |
$ 1,812,916 | |||||
|
LIABILITIES AND STOCKHOLDERS' EQUITY |
|||||||
|
Deposits: |
|||||||
|
Noninterest-bearing |
$ 188,824 |
$ 192,476 | |||||
|
Interest-bearing |
1,166,459 |
1,077,043 | |||||
|
Total deposits |
1,355,283 |
1,269,519 | |||||
|
Federal Home Loan Bank advances |
392,500 |
374,000 | |||||
|
Securities sold under agreements to repurchase |
2,242 |
3,695 | |||||
|
Other borrowed funds |
- |
1,020 | |||||
|
Accrued interest payable |
1,047 |
993 | |||||
|
Deferred compensation liability |
6,805 |
6,434 | |||||
|
Income taxes payable |
812 |
184 | |||||
|
Other liabilities |
8,190 |
10,868 | |||||
|
Total liabilities |
1,766,879 |
1,666,713 | |||||
|
Stockholders' Equity: |
|||||||
|
Common stock; $0.01 par value, 100,000,000 shares authorized; 9,092,007 and 9,086,639 |
|||||||
|
shares issued and outstanding at March 31, 2016 and December 31, 2015, respectively |
91 |
91 | |||||
|
Additional paid-in capital |
90,136 |
89,648 | |||||
|
Retained earnings |
63,056 |
60,517 | |||||
|
Accumulated other comprehensive loss |
(39) |
(116) | |||||
|
Unearned compensation - ESOP |
(3,900) |
(3,937) | |||||
|
Total stockholders' equity |
149,344 |
146,203 | |||||
|
Total liabilities and stockholders' equity |
$ 1,916,223 |
$ 1,812,916 | |||||
|
Asset Quality Data: |
|||||||
|
Total non-performing assets |
$ 1,198 |
$ 3,639 | |||||
|
Total non-performing loans |
$ 1,156 |
$ 3,631 | |||||
|
Non-performing loans to total loans |
0.07% |
0.24% | |||||
|
Non-performing assets to total assets |
0.06% |
0.20% | |||||
|
Allowance for loan losses to non-performing loans |
1023.44% |
309.56% | |||||
|
Allowance for loan losses to total loans |
0.72% |
0.73% | |||||
|
Share Data: |
|||||||
|
Outstanding common shares |
9,092,007 |
9,086,639 | |||||
|
Book value per share |
$ 16.43 |
$ 16.09 | |||||
|
BSB BANCORP, INC. AND SUBSIDIARIES | ||||||||
|
CONSOLIDATED STATEMENTS OF OPERATIONS | ||||||||
|
(Dollars in thousands, except per share data) | ||||||||
|
Three months ended | ||||||||
|
March 31, | ||||||||
|
2016 |
2015 | |||||||
|
(unaudited) | ||||||||
|
Interest and dividend income: |
||||||||
|
Interest and fees on loans |
$ 13,412 |
$ 10,232 | ||||||
|
Interest on taxable debt securities |
828 |
741 | ||||||
|
Dividends |
155 |
58 | ||||||
|
Other interest income |
44 |
21 | ||||||
|
Total interest and dividend income |
14,439 |
11,052 | ||||||
|
Interest expense: |
||||||||
|
Interest on deposits |
2,125 |
1,755 | ||||||
|
Interest on Federal Home Loan Bank advances |
1,027 |
531 | ||||||
|
Interest on securities sold under agreements to repurchase |
1 |
1 | ||||||
|
Interest on other borrowed funds |
5 |
7 | ||||||
|
Total interest expense |
3,158 |
2,294 | ||||||
|
Net interest and dividend income |
11,281 |
8,758 | ||||||
|
Provision for loan losses |
599 |
338 | ||||||
|
Net interest and dividend income after provision |
||||||||
|
for loan losses |
10,682 |
8,420 | ||||||
|
Noninterest income: |
||||||||
|
Customer service fees |
225 |
212 | ||||||
|
Income from bank-owned life insurance |
233 |
186 | ||||||
|
Net gain on sales of loans |
60 |
40 | ||||||
|
Loan servicing fee income |
112 |
161 | ||||||
|
Other income |
30 |
158 | ||||||
|
Total noninterest income |
660 |
757 | ||||||
|
Noninterest expense: |
||||||||
|
Salaries and employee benefits |
4,600 |
4,344 | ||||||
|
Director compensation |
234 |
277 | ||||||
|
Occupancy expense |
251 |
293 | ||||||
|
Equipment expense |
104 |
145 | ||||||
|
Deposit insurance |
280 |
218 | ||||||
|
Data processing |
882 |
755 | ||||||
|
Professional fees |
234 |
212 | ||||||
|
Marketing |
221 |
252 | ||||||
|
Other expense |
446 |
440 | ||||||
|
Total noninterest expense |
7,252 |
6,936 | ||||||
|
Income before income tax expense |
4,090 |
2,241 | ||||||
|
Income tax expense |
1,551 |
867 | ||||||
|
Net income |
$ 2,539 |
$ 1,374 | ||||||
|
Earnings per share |
||||||||
|
Basic |
$ 0.29 |
$ 0.16 | ||||||
|
Diluted |
$ 0.28 |
$ 0.16 | ||||||
|
Return on average assets |
0.56% |
0.39% | ||||||
|
Return on average equity |
6.88% |
4.02% | ||||||
|
Interest rate spread |
2.39% |
2.37% | ||||||
|
Net interest margin |
2.53% |
2.53% | ||||||
|
Efficiency ratio |
60.73% |
72.90% | ||||||
|
Contact: |
Robert M. Mahoney |
|||
|
President and Chief Executive Officer |
||||
|
Phone: |
617-484-6700 |
|||
|
Email: |

Logo - http://photos.prnewswire.com/prnh/20160113/322031LOGO
To view the original version on PR Newswire, visit:http://www.prnewswire.com/news-releases/bsb-bancorp-inc-reports-first-quarter-results--year-over-year-earnings-growth-of-85-300254713.html
SOURCE BSB Bancorp, Inc.

© 2024 Benzinga.com. Benzinga does not provide investment advice. All rights reserved.
Trade confidently with insights and alerts from analyst ratings, free reports and breaking news that affects the stocks you care about.

