


Commodity-based companies and associated ETFs are critically important as a gauge of economic health and demand, inflation and should be important additions to most investment portfolios.
Underlying commodity prices can be affected by many factors including the level of the U.S. dollar which can depress prices when strong. With inflation pressures waxing and waning many believe it’s important to have exposure to commodity oriented stocks and ETFs. Nevertheless, even if underlying commodity prices rise, commodity related common stocks and linked ETFs may or may not follow suit. This makes investment timing that much more important.
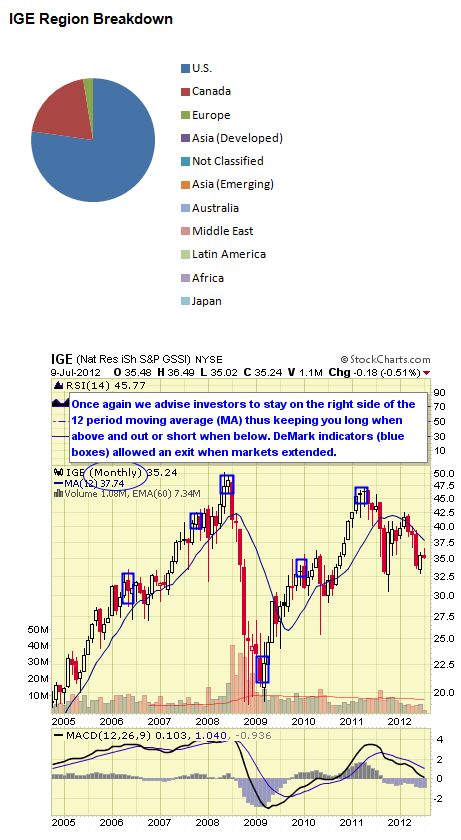
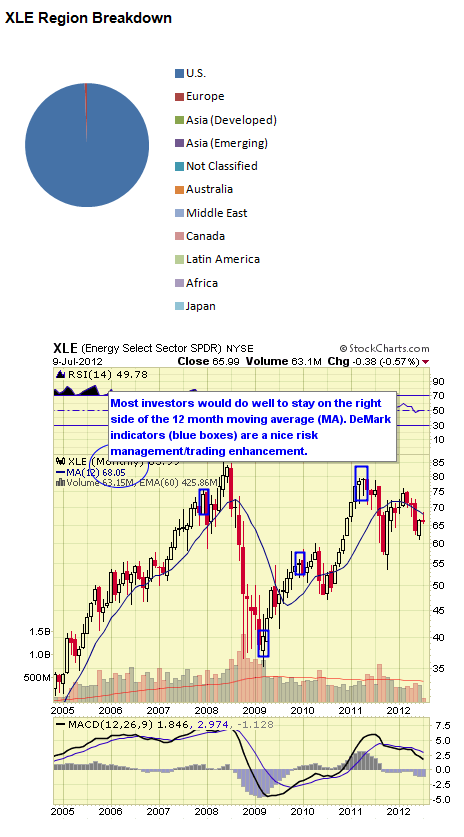
We feature a technical view of conditions from monthly chart views. Simplistically, we recommend longer-term investors stay on the right side of the 12 month simple moving average. When prices are above the moving average, stay long, and when below remain in cash or short. Some more interested in a fundamental approach may not care so much about technical issues preferring instead to buy when prices are perceived as low and sell for other reasons when high; but, this is not our approach. Members to the ETF Digest receive added signals when markets become extended such as DeMark triggers to exit overbought/oversold conditions.
For traders and investors wishing to hedge, leveraged and inverse issues are available to utilize from ProShares and Direxion and where available these are noted.


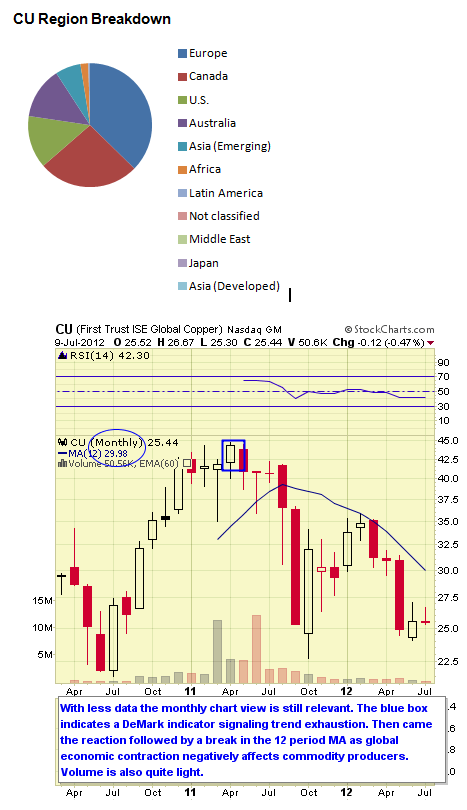
CU follows the ISE Global Copper Index which is a linear weighted index following public companies in the copper mining industry based on analysis of revenue derived from the sale of copper. The fund was launched in March 2010. The expense ratio is 0.70%.
AUM equal $43M and average daily trading volume is 18K shares. As of July 2012 the annual dividend yield was 4.04% and YTD return was -11.98%. The one year return was -38.35% which makes for a year of zero returns.
Data as of July 2012
CU Top Ten Holdings & Weightings
-
Xstrata PLC (XTA): 6.53%
-
Southern Copper Corporation (SCCO): 6.52%
-
Rio Tinto PLC ADR (RIO): 6.34%
-
Jiangxi Copper Company Limited H Shares (00358): 6.07%
-
Freeport-McMoRan Copper & Gold Class B (FCX): 6.01%
-
Antofagasta PLC (ANTO): 5.92%
-
First Quantum Minerals Ltd. (FM): 4.69%
-
KGHM Polska Miedz SA (KGH): 4.33%
-
Oz Minerals Limited (OZMLF): 4.32%
-
Inmet Mining Corp: 4.30%
#9: Guggenheim Timber ETF CUT
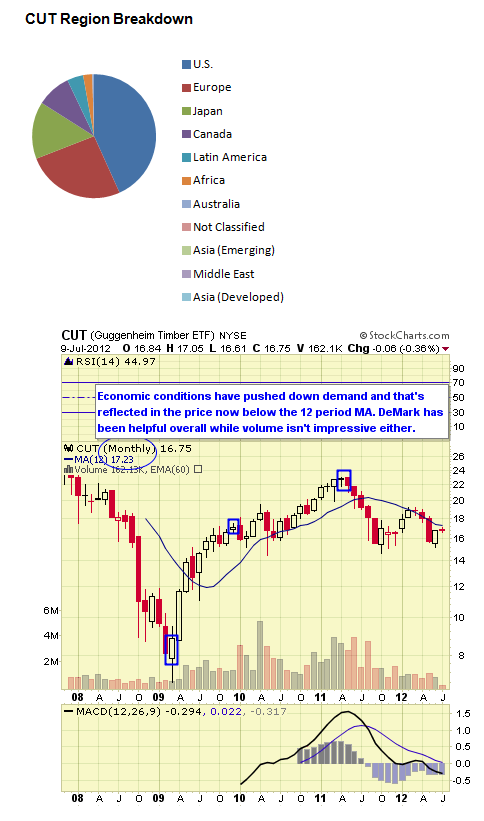
CUT which follows the Beacon Global Timber Index consisting of companies who own or lease forested land and harvest timber for commercial use of wood-based products including paper, packaging, lumber and pulp. The fund was launched in November 2009. The expense ratio is 0.65%.
AUM equal $118M and average daily trading volume is 42K shares. As of July 2012 the annual dividend yield was 2.27% and YTD return was 1.21%. The one year return was -20.37%.
Data as of June 2012
CUT Top Ten Holdings & Weightings
-
Rayonier, Inc. (RYN): 5.22%
-
Weyerhaeuser Co (WY): 5.04%
-
Plum Creek Timber Co Inc (PCL): 4.94%
-
MeadWestvaco Corporation (MWV): 4.87%
-
West Fraser Timber (WFTBF): 4.86%
-
Greif, Inc. Class A (GEF): 4.71%
-
International Paper Co. (IP): 4.49%
-
Morgan Stanley Pnote 6/23/14: 4.44%
-
Domtar Corp (UFS): 4.44%
-
Svenska Cellulosa AB (SCA B): 4.40%
#8: iShares Global Timber & Forestry ETF WOOD
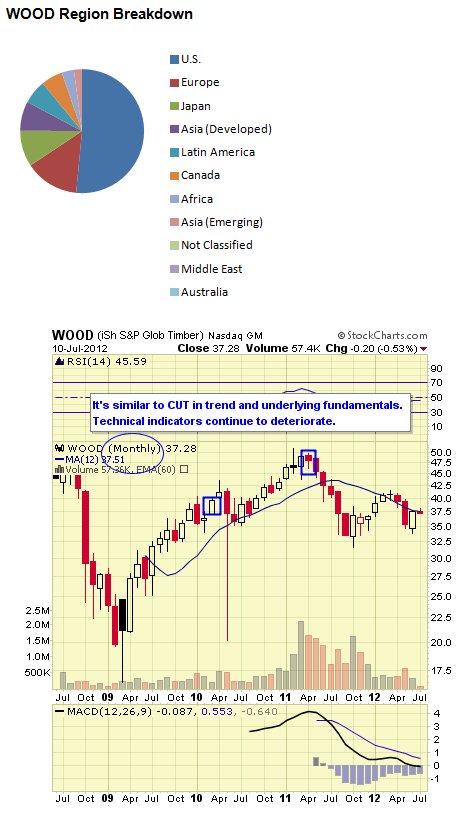
WOOD follows the S&P Global Timber & Forestry Index which includes companies primarily engaged in ownership, management or upstream supply chain of forests and timberlands. The fund was launched in June 2008. The expense ratio is 0.48%.
AUM equal $149M and average daily trading volume is 19K shares. As of July 2012 the annual dividend yield was 2.32% and YTD return was 1.96%. The one year return was -14.87%.
Data as of June 2012
WOOD Top Ten Holdings & Weightings
-
Rayonier, Inc. (RYN): 8.87%
-
Weyerhaeuser Co (WY): 8.55%
-
Plum Creek Timber Co Inc (PCL): 8.10%
-
West Fraser Timber (WFTBF): 5.46%
-
MeadWestvaco Corporation (MWV): 4.76%
-
Potlatch Corp. (PCH): 4.65%
-
Packaging Corporation of America (PKG): 4.27%
-
Sonoco Products Company (SON): 4.21%
-
Golden Agri-Resources Ltd. (E5H): 3.93%
-
International Paper Co. (IP): 3.90%
#7: Van Eck Hard Assets Producers ETF HAP
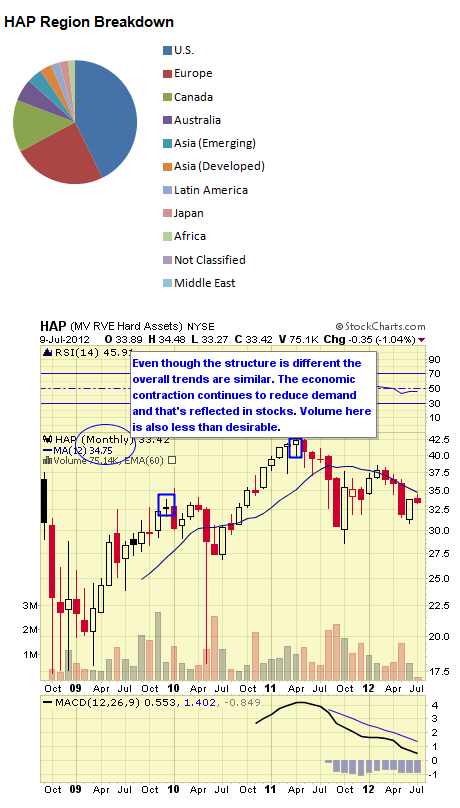
HAP follows the Van Eck Hard Assets Producers Index which consists of companies engaged in the discovery, production and distribution of hard assets and related products. The fund was launched in August 2008. The expense ratio is 0.49%.
AUM equal $138M and average daily trading volume is 41K shares. As of July 2012 the annual dividend yield was 1.93% and YTD return was -0.30%. The one year return was -16.86%.
Data as of June 2012
HAP Top Ten Holdings & Weightings
-
Exxon Mobil Corporation (XOM): 5.68%
-
Monsanto Company (MON): 4.28%
-
Potash Corporation of Saskatchewan, Inc. (POT): 3.94%
-
Deere & Co (DE): 3.51%
-
Syngenta AG (SYENF): 3.49%
-
Chevron Corp (CVX): 2.96%
-
Archer-Daniels Midland Company (ADM): 2.29%
-
BHP Billiton Ltd (BHPLF): 2.21%
-
BP PLC (BPAQF): 1.87%
-
Mosaic Co (MOS): 1.66%
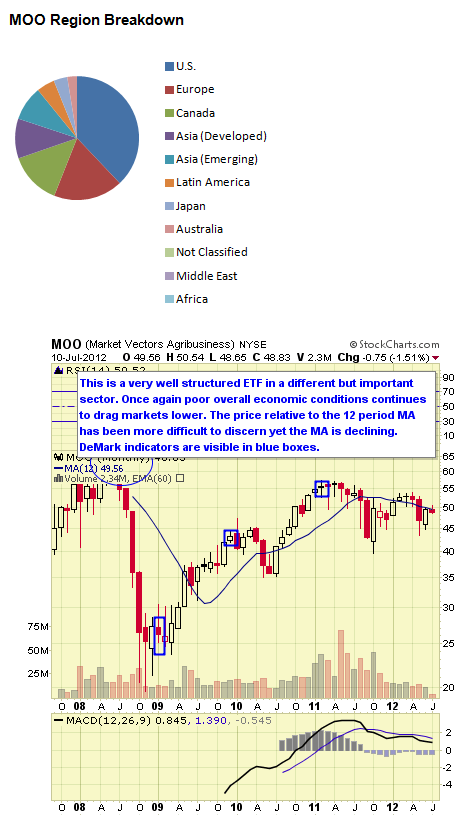
#6: Van Eck Argibusiness ETF MOO
MOO follows the DAXglobal Agribusiness Index which consists of companies that derive at least 50% of their revenues from the business of agriculture. The fund was launched in August 2007. The expense ratio is 0.59%.
AUM equal $5.4Bwith average daily trading volume of 530K shares. As of July 2012 the annual dividend yield was 0.61% and YTD return was 5.45%. The one year return was -8.43%.
Data as of June 2012
MOO Top Ten Holdings & Weightings
-
Monsanto Company (MON): 7.54%
-
Potash Corporation of Saskatchewan, Inc. (POT): 7.39%
-
Deere & Co (DE): 7.15%
-
Syngenta AG (SYENF): 7.05%
-
Wilmar International Ltd (F34): 5.89%
-
Archer-Daniels Midland Company (ADM): 5.21%
-
Mosaic Co (MOS): 4.22%
-
Yara International ASA (YRAIF): 4.10%
-
Agrium Inc (AGU): 4.03%
-
BRF - Brasil Foods SA ADR (BRFS): 3.92%
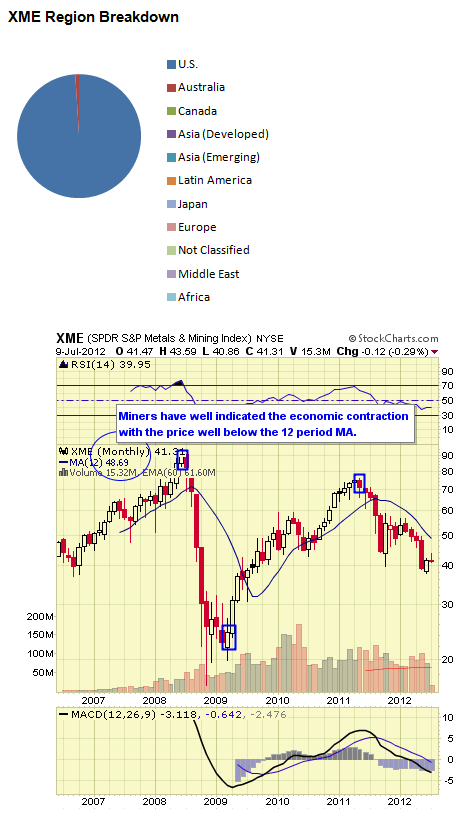
#5: SPDR Metals & Mining ETF XME
SME follows the S&P Metals & Mining Select Industry Index which includes the metals and mining sub-sector of the S&P TMI index. The fund was launched in June 2006. The expense ratio is 0.35%. AUM equal $810M and average daily trading volume is 3.8M shares. As July 2012 the annual dividend yield was 1.07% and YTD return was -14.09%. The one year return was -40.47%.
An alternative choice given similar trending characteristics is Van Eck Steel ETF XME which follows the NYSE Arca Steel Index featuring companies primarily involved in the production, manufacturing, fabrication and extraction of iron ore. The fund was launched in October 2006. The expense ratio is 0.55%. AUM equal $114M and average daily trading volume is 69K shares As of July 2012 the annual dividend yield was 2.54% and YTD return was -5.51%. The one year return was -34.70%.
Data as of June 2012
XME Top Ten Holdings & Weightings
-
Royal Gold, Inc. (RGLD): 3.67%
-
Compass Minerals International, Inc. (CMP): 3.59%
-
SunCoke Energy Inc (SXC): 3.57%
-
Cloud Peak Energy Inc (CLD): 3.28%
-
Reliance Steel and Aluminum (RS): 3.19%
-
Carpenter Technology Corporation (CRS): 3.18%
-
Alcoa Inc (AA): 3.17%
-
Commercial Metals Company (CMC): 3.16%
-
Hecla Mining Company (HL): 3.12%
-
RTI International Metals, Inc. (RTI): 3.09%


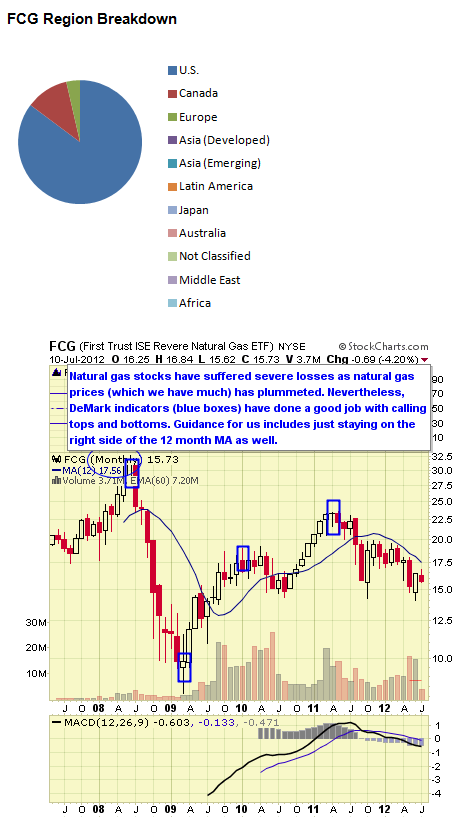
#4: First Trust Natural Gas Sector ETF FCG
FCG follows the ISE-Revere Natural Gas Index which is an equal-weighted index comprised of exchange-listed companies that derive a substantial portion of their revenues from the exploration and production of natural gas. The fund was launched in May 2007. The expense ratio is 0.60%. AUM equal $403M and average daily trading volume is 644K shares.
As of July 2012 the annual dividend yield was 0.50% and YTD return was -9.97%. The one year return was -24.87%.
Data as of June 2012
FCG Top Ten Holdings & Weightings
-
Comstock Resources, Inc. (CRK): 4.31%
-
EXCO Resources, Inc. (XCO): 3.95%
-
Encana Corp (ECA): 3.94%
-
Forest Oil Corp (FST): 3.93%
-
Range Resources Corporation (RRC): 3.93%
-
Noble Energy Inc (NBL): 3.85%
-
Newfield Exploration Company (NFX): 3.78%
-
Cabot Oil & Gas Corporation Class A (COG): 3.76%
-
Questar Corp (STR): 3.75%
-
SandRidge Energy Inc (SD): 3.65%
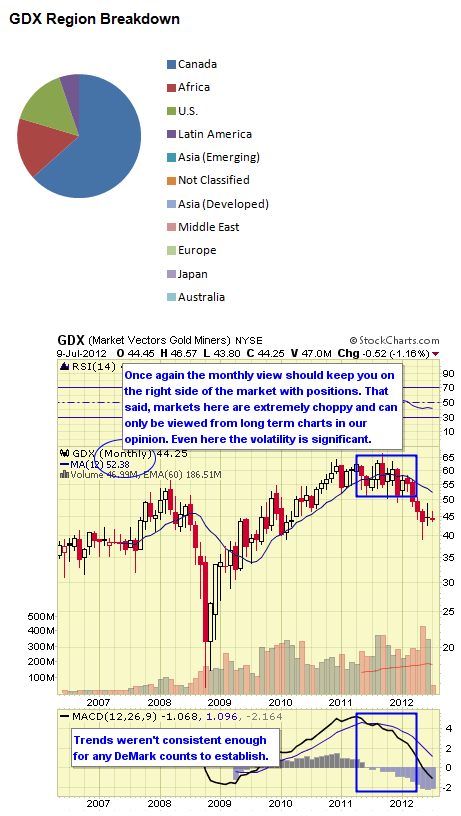
#3: Van Eck Market Vectors Gold Miners ETF GDX
GDX follows the NYSE Arca Gold Miners Index which provides exposure to publicly traded companies worldwide involved primarily in the mining for gold, representing a diversified blend of small-, mid- and large- capitalization stocks. The fund was launched in May 2006. The expense ratio is 0.53%. AUM equal $8B and average daily trading volume is 16M shares. As of July 2012 the annual dividend yield was 0.34% and YTD return was -13.61%. The one year return was -20.79%.
Newer ETFs in the sector include Van Eck Junior Miners ETF (GDXJ) and Global X Silver Miners ETF (SIL). Both are interesting but need just a little more seasoning.
Data as of June 2012
GDX Top Ten Holdings & Weightings
-
Barrick Gold Corporation (ABX): 18.10%
-
Goldcorp, Inc. (GG): 14.08%
-
Newmont Mining Corporation (NEM): 10.64%
-
Anglogold Ashanti Limited ADR (AU): 5.95%
-
Buenaventura Mining Company Inc. ADR (BVN): 5.25%
-
Eldorado Gold Corp (EGO): 4.74%
-
Yamana Gold, Inc. (AUY): 4.57%
-
Gold Fields Ltd ADR (GFI): 4.48%
-
Silver Wheaton Corporation (SLW): 4.40%
-
Kinross Gold Corporation (KGC): 4.29%
#2: iShares Natural Resources ETF IGE

IGE follows the S&P North American Natural Resources Sector Index which measures the performance of U.S.-traded natural resource related stocks. The fund was launched in October 2001. The expense ratio is 0.48%.
AUM equal $1.6B and average daily trading volume is 185K shares. As of July 2012 the annual dividend yield was 1.14% and YTD return was -6.40%. The one year return was -20.33%.
Data as of June 2012
IGE Top Ten Holdings & Weightings
-
Exxon Mobil Corporation (XOM): 8.28%
-
Chevron Corp (CVX): 8.16%
-
Schlumberger NV (SLB): 5.48%
-
ConocoPhillips (COP): 4.34%
-
Occidental Petroleum Corporation (OXY): 4.18%
-
Suncor Energy Inc (SU): 2.74%
-
Barrick Gold Corporation (ABX): 2.54%
-
Canadian Natural Resources Ltd (CNQ): 2.04%
-
Apache Corporation (APA): 2.03%
-
Anadarko Petroleum Corp (APC): 1.98%
#1: SPDR Select Sector Energy ETF XLE
XLE follows the Energy Select Sector Index which includes companies in oil, gas, consumable fuels and energy equipment and services. The fund was launched in December 1998. The expense ratio is 0.18%. AUM equal $7.4B and average daily trading volume is 15M shares. As of July 2012 the annual dividend yield was 1.27% and YTD return was -3.65%. The one year return was -13.40%.
A long list of others in this category include:
- VDE
- IXC
- OIH
- XOP
- IYE
- IEZ
- IEO
- PXI
- XES
- RYE
- PXE
Both ProShares and Direxion shares have inverse and leveraged products available.
Data as of June 2012
XLE Top Ten Holdings
-
Exxon Mobil Corporation (XOM): 19.51%
-
Chevron Corp (CVX): 15.48%
-
Schlumberger NV (SLB): 6.87%
-
Occidental Petroleum Corporation (OXY): 4.38%
-
ConocoPhillips (COP): 3.85%
-
Apache Corporation (APA): 2.81%
-
National Oilwell Varco, Inc. (NOV): 2.80%
-
Anadarko Petroleum Corp (APC): 2.76%
-
Halliburton Company (HAL): 2.59%
-
EOG Resources (EOG): 2.54%
We rank the top 10 ETF by our proprietary stars system as outlined below. However, given that we’re sorting these by both short and intermediate issues we have split the rankings as we move from one classification to another.
Strong established linked index
Excellent consistent performance and index tracking
Low fee structure
Strong portfolio suitability
Excellent liquidity

Established linked index even if “enhanced”
Good performance or more volatile if “enhanced” index
Average to higher fee structure
Good portfolio suitability or more active management if “enhanced” index
Decent liquidity


Enhanced or seasoned index
Less consistent performance and more volatile
Fees higher than average
Portfolio suitability would need more active trading
Average to below average liquidity


Index is new
Issue is new and needs seasoning
Fees are high
Portfolio suitability also needs seasoning
Liquidity below average


This sector overall responds to perceived and real economic conditions. Should investors sense an economic slowdown demand for base commodities will decline and so too will associated stocks. Conversely, should investors believe an economic expansion is underway then products and stocks should rally. Uniquely, the level of the U.S. dollar is also another important determinant as to price action given commodities overall are priced in dollars. A strong dollar in the current environment should mean a decline in commodity prices and vice versa. It’s important to remember also when the overall stock market declines so too may this sector even if commodity prices are rising.
It’s also important to remember that ETF sponsors have their own competitive business interests when issuing products which may not necessarily align with your investment needs. New ETFs from highly regarded and substantial new providers are also being issued. These may include Charles Schwab’s ETFs and Scottrade’s Focus Shares which both are issuing new ETFs with low expense ratios and commission free trading at their respective firms. These may also become popular as they become seasoned.
For further information about portfolio structures using technical indicators like DeMark and other indicators, take a free 14-day trial at ETF Digest. Follow us on Twitter and Facebook as well and join our group conversations.
You may address any feedback to: feedback@etfdigest.com
The ETF Digest has no current positions in the featured ETFs.
(Source for data is from ETF sponsors and various ETF data providers.)
Edge Rankings
Price Trend
© 2025 Benzinga.com. Benzinga does not provide investment advice. All rights reserved.
Trade confidently with insights and alerts from analyst ratings, free reports and breaking news that affects the stocks you care about.

