


NEW YORK, Nov. 7, 2018 /PRNewswire/ -- Pareteum Corporation TEUM, ("Pareteum" or the "Company"), a Global Cloud Software company, announced today its operating and financial results for the third quarter ended September 30, 2018.
Sequential Quarterly Key Metrics | ||||||||||
($000's) | Q3 2017 | Q4 2017 | Q1 2018 | Q2 2018 | Q3 2018 | |||||
REVENUE | 3,499 | 4,015 | 4,113 | 6,003 | 8,008 | |||||
YEAR-OVER-YEAR REVENUE GROWTH) | 328 | 10% | 870 | 28% | 1,318 | 47% | 2,764 | 85% | 4,509 | 129% |
GROSS MARGIN | 2,707 | 77% | 2,910 | 72% | 2,918 | 71% | 4,223 | 70% | 5,879 | 73% |
ADJUSTED EBITDA | 603 | 708 | 283 | 1,297 | 1,782 | |||||
EBITDA | (35) | (2,733) | (869) | 597 | (5,851) | |||||
CASH BALANCE | 700 | 13,538 | 15,759 | 19,205 | 18,865 | |||||
36 MONTH CONTRACTUAL REVENUE BACKLOG | 94,000 | 147,000 | 200,000 | 276,000 | 403,000 | |||||
CONNECTIONS | 1,277 | 1,310 | 2,220 | 2,714 | 2,903 | |||||
Key Financial Highlights for Third Quarter 2018 Year over Year:
- Revenues increased by 129% to $8 million
- Adjusted EBITDA improved by over $1.2 million, or 195%, to $1.8 million
- Non-GAAP Earnings Per Common Share improved to $0.01 for Q3 2018, compared to ($0.12) for Q3 2017
- Increase in total assets from $10 million to $35 million
- Cash balance of $18.9 million
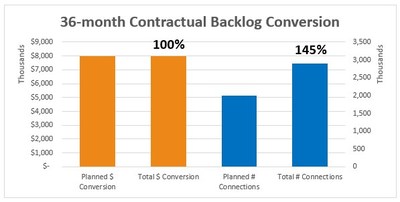
- Dollar-based expansion rate where customers of record in 2017 have grown their revenue dollar spending by 147% in the third quarter of 2018 versus the third quarter of 2017
Key Business Highlights for Third Quarter 2018:
- Awarded 19 contracts aggregating to $403 million in total contract value, which added $127 million to 36-month Contractual Revenue Backlog
- Increased 36-Month Contractual Revenue Backlog from $276 million at end of the second quarter of 2018 to $403 million; includes $72 million incremental from existing contracts
- Contractual Revenue Backlog conversion rate at 100%
- Ended the third quarter of 2018 with 2,903,000 Connections, an increase of 127% over the end of the third quarter of 2017 and 7% higher than the second quarter of 2018
"The quarter ended September 30, 2018, marks our continued evolution into a high-growth, software-based, enabling cloud services company. Surpassing $8 million in revenues in the third quarter demonstrates the efficiency of our employees in converting our Contract Revenue Backlog into revenue. Our results include growth in adjusted EBITDA, which reflects the scalability of our recurring revenue SaaS business model. Subsequent to the end of the third quarter, we closed the Artilium acquisition and have been busy integrating and streamlining the businesses and eliminating redundant expenses. We are continuing to grow our revenues, clearly seen in our results as we are driving financial performance and cash to the bottom line. Key performance indicators of Connections, Contract Revenue Backlog conversion, Connection values, revenue-per-employee and churn continue to all move in the right direction and give us confidence in our overall strategy and business execution. Our TEUM remains laser focused on converting backlog to revenue, servicing our clients, selling into new geographical markets and creating shareholder value," said Hal Turner, Pareteum's Founder, Executive Chairman and Principal Executive Officer.
Raised 2018 Outlook to > 100% Revenue Growth 2018 Outlook:
Based on our 36-month Contractual Revenue Backlog of $403 million, as of September 30, 2018, and 3,000,000 connections, we have raised our 2018 outlook. The Company now expects 2018 revenue growth greater than 100% over 2017, up from the previous provided guidance of 85%. Also, with its current cost structures, Pareteum expects positive adjusted EBITDA and cash from continuing operations for the full year 2018. As we convert Contractual Revenue Backlog to Connections, our revenue will increase and for every incremental dollar of revenue, we expect contribution to our bottom line. Our target gross margins are in the range of 70-75%.
Highlight Key Performance Indicators and Trends (as of September 30, 2018):
As of the end of the third quarter of 2018, the Company has a 36-month Contractual Revenue Backlog of $403 million. Pareteum's sales culture led by Chief Revenue Officer, Rob Mumby, continues to excel in entering new geographies and further penetrating new and existing target markets. Our sales executives were recruited because of their deep domain expertise and existing relationships with targeted customers and segments. Our software and solutions deliver great value, including creating new sources of revenue and expense reduction for our clients. We are increasingly receiving more inbound requests expanding our market opportunities. Strategic partnerships are driving more sales as proven out by the sales synergies with Artilium, which was initially an alliance and led to a strategic acquisition. The markets for our software enablement services are growing dramatically, and we have a revolutionary industry disrupter with our cloud software solutions.
Connections of 2,903,000, are up from 2,713,600 at the end of the second quarter of 2018 and 1,310,000 at the end of the year 2017; an increase of 7% over the end of the second quarter 2018, and a significant 127% increase over the end of the third quarter 2017.
Pareteum's Contractual Revenue Backlog conversion rate to revenue stood at 100%. While our experience so far has us converting at greater than 100%, we note that there may be situations where a customer delays, or doesn't onboard the number of connections initially ordered, or even goes out of business. This de-risking is highlighted in the revenue outlook we have provided and is generally less than the 100% conversion rate.


Lifetime connection value of $328 is up from $312 for the second quarter of 2018 and $191 at the end of the third quarter 2017; this shows an increase of 72% versus the end of the third quarter of 2017 and 5% over the sequential second quarter of 2018.
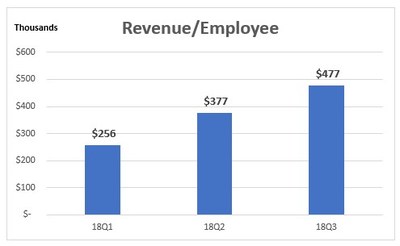
Average annualized revenue-per-employee of $477,368, is up from $377,000 at the end of the second quarter of 2018 and $222,139 at the end of the third quarter of 2017; increased 115% versus the end of the third quarter of 2017 and 27% from the sequential second quarter of 2018; increased 915% versus the end of the fourth quarter of 2015. Software-as-a-Service (SaaS) companies typically average $225,000 per employee per year.


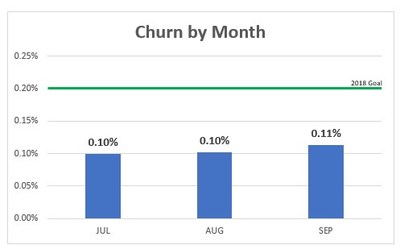
Connection Churn by month stood at an average of 0.10% for the third quarter 2018, down from 0.14% at the end of the second quarter of 2018.


Financial Results for the Third Quarter Ended September 30, 2018:
Revenue for the third quarter ended September 30, 2018 was $8.0 million, an increase of $4.5 million or 129%, compared to $3.5 million for the third quarter ended June 30, 2017. This increase was attributable mainly due to the services deployment of signed sales contracts into billable revenues (Backlog conversion) and growth in volumes of connections from our existing and growing customer base; in addition to revenues from our Managed Services Platform (MSP), we benefited from Global Cloud Services (GCSP) and Application Exchange Platform (Super API) revenues coming into service.
With GCSP and Super API playing an increasingly predominant role in our growth, Global Cloud Services revenue represented 37% of total revenue in the third quarter of 2018, showing the acceptance of our new product offerings.
It is also significant that "Connections" (our term representing devices, subscribers and their variable usage), which are a lead indicator of revenue, rose to 2,903,000 as of September 30, 2018. These connections represent growth of 127% versus the end of the third quarter 2017 and 7% from the sequential second quarter of 2018.
Gross profit for the three months ending September 30, 2018 was $5.9 million, resulting in a gross margin of 73%, compared to $2.7 million and 77% for the three months ending September 30, 2017.
Product development expenses for the three months ended September 30, 2018 and 2017 were $766,000 and $497,000, respectively, an increase of $269,000 or 54%. Product Development costs consists primarily of salaries and related expenses, including share-based expenses of employees involved in the development of the Company's services, which are expensed as incurred. Costs such as database architecture, and Pareteum B/OSS, Core Server and SuperAPI development and testing are included in this function.
Sales and Marketing expenses for the three months ended September 30, 2018 and 2017 were $843,000 and $413,000, respectively, an increase of $430,000 or 104%. This increase is a direct result of hiring new employees and allocating resources to growing our business.
Adjusted EBITDA for the three months ended September 30, 2018, was $1.8 million, an improvement of $1.2 million or 183%, compared to $0.6 million for the same period in 2017.
EBITDA for the three months ended September 30, 2018, was a loss of ($5.8) million, a decrease of $5.8 million, compared to EBITDA loss of ($34,000) for the same period in 2017.
Non-GAAP Earnings Per Common Share improved to $0.01 for Q3 2018, compared to ($0.12) for Q3 2017.
Operating loss for the three months ended September 30, 2018, was a loss of ($6.9) million, an increase of $5.4 million, compared to a loss of ($1.5) million for the same period in 2017.
Restructuring and acquisition costs for the three months ended September 30, 2018 and 2017 were $2.0 million and $0.3 million, respectively.
Of note, the following were non-cash expenses associated with the three months ended September 30, 2018 and 2017. We recognized share-based compensation expense of $5.6 million and $0.4 million, respectively, an increase of $5.2 million. Depreciation and amortization expenses for the three-month period ended September 30, 2018 was $1.0 million, a decrease of $0.4 million or 30%, compared to $1.4 million for the same period in 2017.
Net loss for the three months ended September 30, 2018, was ($7.0) million, an increase of $4.7 million as compared to a net loss of ($2.3) million, for the same period in 2017. The net loss increase was primarily due to the increase in share-based compensation and the increase in acquisition charges related to the acquisition of Artilium. The resulting EPS for the three months period ended September 30, 2018 was ($0.12), as compared to the loss of ($0.16) for the same period in 2017.
At September 30, 2018, Pareteum had $18.9 million of cash and restricted cash, $0 senior secured debt and 59.3 million shares issued and outstanding.
Financial Results for the Nine Months Ended September 30, 2018:
Revenue for the nine months ended September 30, 2018 was $18.1 million, an increase of $8.6 million or 91%, compared to $9.5 million for the nine months ended September 30, 2017. This increase was attributable mainly due to the services deployment of signed sales contracts into billable revenues (Backlog conversion) and growth in volumes of connections from our existing and growing customer base; in addition to revenues from our Managed Services Platform (MSP), we benefited from Global Cloud Services (GCSP) and Application Exchange Platform (Super API) revenues coming into service.
Gross profit for the nine months ending September 30, 2018 was $13.0 million, resulting in a gross margin of 72%, compared to $7.0 million and 73% for the nine months ending September 30, 2017.
Product development expenses for the nine months ended September 30, 2018 and 2017 were $2.2 million and $1.1 million, respectively, an increase of $1.1 million or 113%.
Sales and Marketing expenses for the nine months ended September 30, 2018 and 2017 were $2.2 million and $1.1 million, respectively, an increase of $1.1 or 98%.
Adjusted EBITDA for the nine months ended September 30, 2018, was $3.4 million, an improvement of $2.5 million or 276%, compared to $0.9 million for the same period in 2017.
EBITDA for the nine months ended September 30, 2018, was a loss of ($6.1) million, an increase of $4.6 million, compared to EBITDA loss of ($1.5) million for the same period in 2017.
Non-GAAP Earnings Per Common Share YTD was $0.02 in 2018 and ($0.21) in 2017.
Operating loss for the nine months ended September 30, 2018, was ($9.1) million, an increase of $4.5 million, compared to a loss of ($4.6) million for the same period in 2017.
Restructuring and acquisition costs for the nine months ended September 30, 2018 and 2017 were $2.1 million and $0.8 million, respectively, an increase of $1.2 million or 147%.
Of note, the following were non-cash expenses associated with the nine months ended September 30, 2018 and 2017. We recognized share-based compensation expense of $7.4 million and $1.5 million, respectively, an increase of $5.9 million or 384%. Depreciation and amortization expenses for the nine-month period ended September 30, 2018 was $3.0 million, a decrease of $0.2 million or 6%, compared to $3.1 million for the same period in 2017. Changes in derivative liabilities for the nine-month period ended September 30, 2018 was $1.3 million compared to a gain of $1.9 million for the same period in 2017.
Net loss for the nine months ended September 30, 2018, was ($7.4) million, an increase of $2.5 million as compared to a net loss of ($4.9) million, for the same period in 2017. The resulting EPS for the nine months period ended September 30, 2018 was ($0.14), as compared to the loss of ($0.41) for the same period in 2017.
Conference Call Information: | |
Date: | Wednesday, November 7, 2018 |
Time: | 4:30 PM ET |
Conference ID: | 9991184 |
Domestic Dial-in Number: | 1-866-548-4713 |
International Dial-in Number: | 1-323-794-2093 |
U.K. Toll Free: | 0800 358 6377 |
Live webcast: | |
All interested participants should dial in approximately 5 to 10 minutes prior to the 4:30 PM ET conference call and an operator will register your name and organization.
A replay of the call will be available approximately one hour after the end of the call through November 6, 2019, and can be accessed at: http://public.viavid.com/index.php?id=131747
About Pareteum Corporation:
Pareteum Corporation TEUM is a rapidly growing Global Software Defined Cloud company with a mission to connect "every person and everything." Organizations use Pareteum to energize their growth and profitability through our Global Software Defined Cloud and complete turnkey solutions featuring relevant content, applications, and connectivity worldwide. Our cloud platform services partners (technologies integrated into our cloud) include: HPE, IBM, Ribbon Communications (Sonus+GenBand), NetNumber, Oracle, Microsoft, and other world class technology providers. All of the relevant customer-acquired value is derived from Pareteum's leading Global Software Defined Cloud, delivering award-winning mobile enablement, regardless of the user's location or network. By harnessing the value of communications, Pareteum serves retail, enterprise and IoT customers. Pareteum currently has offices in New York, São Paulo, Madrid, Barcelona, Bahrain, Singapore, Indonesia, Germany, Belgium, United Kingdom and the Netherlands. For more information please visit: www.pareteum.com.
Forward Looking Statements:
Certain statements contained herein constitute "forward-looking statements" within the meaning of the Private Securities Litigation Reform Act of 1995. Such statements may include, without limitation, statements with respect to Pareteum's plans and objectives, projections, expectations and intentions. These forward-looking statements are based on current expectations, estimates and projections about Pareteum's industry, management's beliefs and certain assumptions made by management. Readers are cautioned that any such forward-looking statements are not guarantees of future performance and are subject to certain risks, uncertainties and assumptions that are difficult to predict. Because such statements involve risks and uncertainties, the actual results and performance of Pareteum may differ materially from the results expressed or implied by such forward-looking statements. Given these uncertainties, readers are cautioned not to place undue reliance on such forward-looking statements. Unless otherwise required by law, Pareteum also disclaims any obligation to update its view of any such risks or uncertainties or to announce publicly the result of any revisions to the forward-looking statements made here. Additional information concerning certain risks and uncertainties that could cause actual results to differ materially from those projected or suggested in Pareteum's filings with the Securities and Exchange Commission, copies of which are available from the SEC or may be obtained upon request from Pareteum Corporation.
Contractual Revenue Backlog Definition:
Contractual Revenue Backlog, or just Backlog, a Non-GAAP measure is measured on a forward looking 36-month snapshot view monthly, and, is generated by each of the Company's Managed Services, Global Software Defined Cloud, and Application Exchange & Developer's Platform customers. The Pareteum multi-year Software-as-a-Service agreements include service establishment and implementation fees, guaranteed minimum monthly recurring fees, as well as contractually scheduled subscribers, in some cases including subscriber usage, during the term of the agreement, and, their resulting monthly contractual revenue. There can be no assurances that we reach the total contract revenue backlog. Timing of revenue recognition may vary from actual results.
Discussion of Non-GAAP Financial Measures:
Pareteum's management believes that the non-GAAP measures of (1) "EBITDA" (2) "Adjusted EBITDA" (3) "Non-GAAP EPS (4) Cash from operating activities excluding expenditures from restructuring and acquisitions and (4) Contract Revenue Backlog enhance an investor's understanding of Pareteum's financial and operating performance by presenting (i) a focus on core operating performance and (ii) comparable financial results over various periods. Pareteum 's management uses these financial measures for strategic decision making, forecasting future financial results and operating performance. The presentation of non-GAAP ("Generally Accepted Accounting Principles") financial information is not intended to be considered in isolation or as a substitute for, or superior to, the financial information prepared and presented in accordance with GAAP.
EBITDA and Adjusted EBITDA Definition:
"EBITDA" is a non-GAAP measure defined as earnings before interest, taxes, depreciation and amortization. "Adjusted EBITDA" is a non-GAAP measure defined by Pareteum as "EBITDA" excluding stock-based compensation, restructuring costs, acquisition costs, nonrecurring expenditures and certain software and non-cash adjustments made during the 2016 restructuring that are not applicable in 2017 and 2018.
Non-GAAP Earnings and EPS Definition:
"Non-GAAP Earnings and EPS" is a non-GAAP measure defined as earnings per share excluding stock-based compensation, restructuring costs, acquisition costs and nonrecurring expenditures in 2017 and 2018.
Cash from operating activities excluding expenditures from restructuring and acquisitions:
Cash from operating activities excluding expenditures from restructuring and acquisitions is a Non-GAAP measure defined as cash flows from operating activities as adjusted for adjustments to deferred revenues, net billings in excess of revenues, restructuring costs primarily from prior periods and acquisition costs.
Pareteum Investor Relations Contacts:
Ted O'Donnell
Chief Financial Officer
+1 (212) 984-1096
InvestorRelations@pareteum.com
Stephen Hart
Hayden IR
+1 (917) 658-7878
Carrie Howes
Rayleigh Capital
European- Global IR
+1 (416) 837-0075
PARETEUM CORPORATION AND SUBSIDIARIES | |||||||
UNAUDITED CONDENSED CONSOLIDATED STATEMENT OF OPERATIONS | |||||||
(In thousands except for per share amounts) | |||||||
Three Month Period Ended | (YtD) Nine Month Period Ended | ||||||
September 30, | September 30, | September 30, | September 30, | ||||
2018 | 2017 | 2018 | 2017 | ||||
REVENUES | 8,008 | 3,499 | 18,123 | 9,533 | |||
COST AND OPERATING EXPENSES | |||||||
Cost of revenues | 2,129 | 791 | 5,103 | 2,579 | |||
Product development | 766 | 497 | 2,246 | 1,055 | |||
Sales and marketing | 843 | 413 | 2,184 | 1,103 | |||
General and administrative | 8,128 | 1,579 | 12,639 | 5,435 | |||
Restructuring and acquisition costs | 1,995 | 253 | 2,074 | 841 | |||
Depreciation and amortization | 999 | 1,433 | 2,958 | 3,149 | |||
Total cost and operating expenses | 14,858 | 4,966 | 27,205 | 14,163 | |||
LOSS FROM OPERATIONS | (6,851) | (1,467) | (9,081) | (4,630) | |||
Total other (expense) / income | (150) | (694) | 1,621 | (234) | |||
LOSS BEFORE PROVISION FOR INCOME TAXES | (7,001) | (2,162) | (7,460) | (4,864) | |||
Provision for income taxes | 20 | 148 | 38 | 81 | |||
NET LOSS | (7,020) | (2,309) | (7,498) | (4,945) | |||
OTHER COMPREHENSIVE LOSS / INCOME | |||||||
Foreign currency translation (loss) gain | (22) | 2 | 4 | (9) | |||
COMPREHENSIVE LOSS | (7,042) | (2,307) | (7,494) | (4,954) | |||
Net income/loss per common share - basic | (0.12) | (0.16) | (0.14) | (0.41) | |||
Weighted average shares - basic | 59,314,867 | 14,304,340 | 54,275,784 | 12,201,452 | |||
Non-GAAP Earnings Per Common Share | 0.01 | (0.12) | 0.02 | (0.21) | |||
Weighted average shares basic and diluted common stock equivalents | 104,437,636 | 14,304,340 | 104,437,636 | 12,201,452 | |||
Non-GAAP Reconciliation | Three Month Period Ended | (YtD) Nine Month Period Ended | |||||
September 30, | September 30, | September 30, | September 30, | ||||
2018 | 2017 | 2018 | 2017 | ||||
NET LOSS | (7,020) | (2,309) | (7,498) | (4,945) | |||
Total interest and other income (expense) | 150 | 694 | (1,621) | 234 | |||
Depreciation and amortization | 999 | 1,433 | 2,958 | 3,149 | |||
Provision for income taxes | 20 | 148 | 38 | 81 | |||
EBITDA | (5,851) | (35) | (6,123) | (1,481) | |||
Restructuring and acquisition costs | 1,995 | 253 | 2,074 | 841 | |||
Stock based compensation | 5,638 | 385 | 7,410 | 1,509 | |||
Adjusted EBITDA | 1,782 | 603 | 3,361 | 868 | |||
NET LOSS | (7,020) | (2,309) | (7,498) | (4,945) | |||
Restructuring and acquisition costs | 1,995 | 253 | 2,074 | 841 | |||
Stock based compensation | 5,638 | 409 | 7,410 | 1,509 | |||
Non-GAAP Earnings | 613 | (1,647) | 1,986 | (2,596) | |||
PARETEUM CORPORATION AND SUBSIDIARIES | ||||
UNAUDITED CONDENSED CONSOLIDATED BALANCE SHEET INFORMATION | ||||
(In thousands) | ||||
September 30, | September 30, | |||
2018 | 2017 | |||
Cash and cash equivalents | 18,435 | 13,538 | ||
Restricted cash | 430 | 200 | ||
Accounts receivable | 7,200 | 2,058 | ||
Prepaid expenses and other current assets | 943 | 900 | ||
Total current assets | 27,008 | 16,696 | ||
Total assets | 34,809 | 25,326 | ||
Total current liabilities | 6,901 | 7,538 | ||
Total liabilities | 6,996 | 9,905 | ||
Total stockholders' equity | 27,814 | 15,422 | ||
PARETEUM CORPORATION AND SUBSIDIARIES | ||||
UNAUDITED CONDENSED CONSOLIDATED CASH FLOW INFORMATION | ||||
(In thousands) | ||||
For the Nine Months Ended | ||||
September 30, | September 30, | |||
2018 | 2017 | |||
CASH FLOWS FROM OPERATING ACTIVITIES: | (3,824) | (1,410) | ||
CASH FLOWS FROM INVESTING ACTIVITIES: | (2,189) | (538) | ||
CASH FLOWS FROM FINANCING ACTIVITIES: | 11,090 | 2,047 | ||
EFFECT OF EXCHANGE RATES | 50 | (196) | ||
NET INCREASE (DECREASE) IN CASH & CASH EQUIVALENTS | 5,127 | (97) | ||
Non-GAAP OPERATING CASH FLOWS RECONCILIATION | ||||
CASH FLOWS FROM OPERATING ACTIVITIES: | (3,824) | (1,410) | ||
(Increase) decrease in prepaid expenses, deposits & other assets | (28) | 273 | ||
Increase (decrease) in Net billings in excess of revenues | (128) | (640) | ||
Increase (decrease) in accrued expenses and other payables | (2,787) | (1,076) | ||
CASH FLOWS FROM OPERATING ACTIVITIES EXCLUDING EXPENDITURES FOR RESTRUCTURING AND ACQUISITIONS | (882) | 33 | ||
![]()


SOURCE Pareteum Corporation
© 2024 Benzinga.com. Benzinga does not provide investment advice. All rights reserved.
Trade confidently with insights and alerts from analyst ratings, free reports and breaking news that affects the stocks you care about.

