


Microsoft Corp. MSFT soared to new heights on Thursday, with its shares hitting a record-breaking $369, eclipsing the company’s previous peak achieved in July.
For three consecutive weeks, the Redmond, Washington-based company has been on an upward climb, with its stock closing in the green in 13 of the past 15 sessions.
Microsoft's shares have soared by 53% year to date, propelling its market capitalization beyond the $2.7 trillion mark. This growth places Microsoft just a stride behind Apple Inc AAPL, with a gap of approximately $120 billion in market cap.
A key driver behind this recent surge is the positive news flow surrounding Microsoft’s artificial intelligence (AI) ventures. OpenAI, backed by Microsoft, recently unveiled a new version of its widely acclaimed ChatGPT, offering enhanced capabilities to GPT Plus users, including the introduction of the GPT Builder.
This feature, now accessible to all ChatGPT Plus subscribers, enables users to create personalized GPTs without needing any coding expertise.
In addition to its AI-related progress, Microsoft has also revamped its Xbox offerings. A recent update has notably improved the user experience with the Xbox Game Pass subscription service, further cementing Microsoft’s position in the gaming industry.
Wall Street analysts remain optimistic about Microsoft's potential for further growth. The average 12-month price target for Microsoft is currently pegged at $403, suggesting a potential upside of about 10% from the current levels.
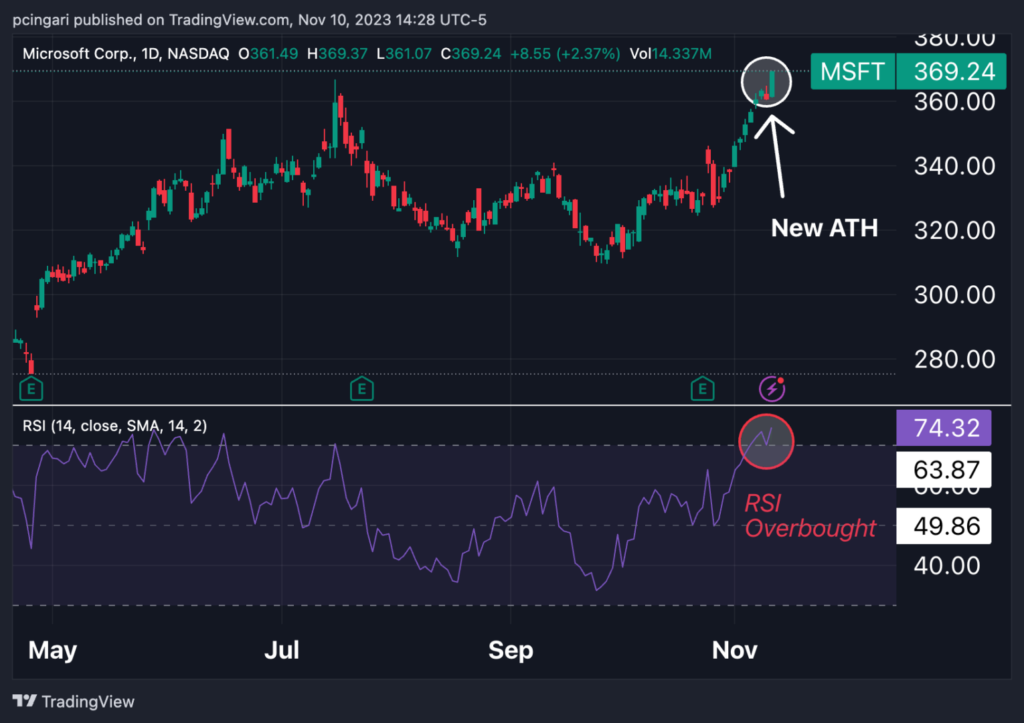
Microsoft Chart Analysis
Despite this bullish sentiment, some technical indicators suggest caution.
The recent rally has led to overbought technical conditions, as evidenced by the Relative Strength Index (RSI) exceeding the 70 threshold in both daily and weekly charts.

However, an RSI in overbought territory does not always indicate an imminent end to a Microsoft’s rally.
Even in May 2023, the tech giant’s daily and weekly charts indicated several RSI readings above 70. However, these overbought signals didn’t halt Microsoft’s upward trend, which persisted until July.
Conversely, in 2021, overbought RSI values observed in October foreshadowed Microsoft’s peak in November, arriving just a few weeks later.
Now Read: Nasdaq Jumps 250 Points; Trade Desk Issues Weak Revenue Forecast
© 2024 Benzinga.com. Benzinga does not provide investment advice. All rights reserved.
Trade confidently with insights and alerts from analyst ratings, free reports and breaking news that affects the stocks you care about.

