


The tech-heavy Nasdaq 100 Index just concluded its most challenging session of 2023, shedding 2.5% on the day.
The last time the Nasdaq 100 endured such a notably negative daily performance was in mid-December 2022 when it experienced a 3.3% dip.
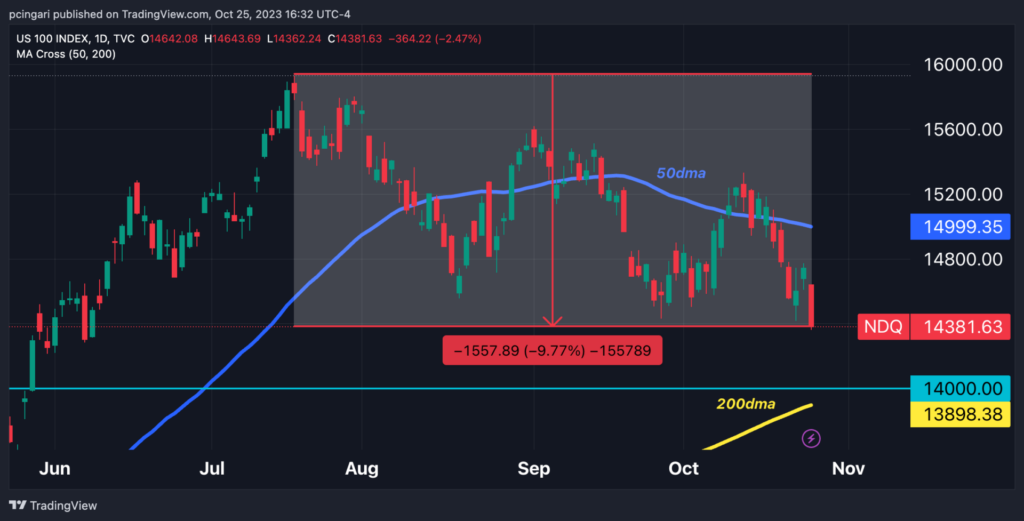
Since reaching its annual peak on July 18, the index has now plummeted by 9.8%, dangerously nearing correction territory.
What triggered this downfall in the Nasdaq was the significant contributors that had previously fueled a remarkable 30% rally since the beginning of the year.
Nevertheless, the market downturn wasn’t confined to the heavyweights, as evidenced by the 2.3% decline in the equally weighted index, tracked by the Direxion Nasdaq 100-Equal Weighted Index Shares QQQE.
Analyzing the holdings of the Invesco QQQ Trust QQQ, here are the tech sector giants that exerted the most downward pressure on the daily performance:
- Alphabet Inc. GOOGL: down by 9.5% during the session, Alphabet alone dragged down QQQ by 0.34% today.
- Amazon.com, Inc. AMZN: down by 9.6%, Amazon shaved off 0.3% from QQQ’s daily performance.
- Nvidia Corp. NVDA: down by 4.3%, Nvidia chipped away approximately 0.2% from Nasdaq’s daily performance.
- Meta Platforms Inc. META: down by 4.1%, Meta also contributed negatively, accounting for 0.2% of QQQ’s daily decline.
Nasdaq 100: Key Levels To Watch Next
The index is currently at its lowest point since June 8. Should this bearish trend persist into the next session, bears may target the psychologically significant level of 14,000, not far from the crucial support of the 200-day moving average.
It’s worth noting the S&P 500 index, tracked by the SPDR S&P 500 ETF Trust SPY, has already broken below this threshold, suggesting broader market challenges.
Chart: Nasdaq’s Next Supports Are 14,000, 200-Day Average

Read Now: S&P 500 Breaches 200-Day Average As Treasury Yields Hit 5%: Analyst Says The Primary Trend Is ‘Down’
© 2024 Benzinga.com. Benzinga does not provide investment advice. All rights reserved.
Trade confidently with insights and alerts from analyst ratings, free reports and breaking news that affects the stocks you care about.

