


- The S&P 500 breached the 200-day moving average, signaling a bearish trend, with the index falling below 4,200 points.
- Tesla, Amazon, Apple, and Berkshire Hathaway negatively impacted SPY ETF performance over the past month.
- Tim Melvin’s system has spotted 10X winners like NVIDIA and Matador—see his next 6 picks and the options strategies to multiply gains at a free July 23 event. Register Here.
The S&P 500 index has breached a critical support level — the 200-day moving average — further cementing the ongoing bearish trend.
Monday brought a negative start to the week on Wall Street, with the index representing the top 500 American companies by market capitalization, closely monitored through the SPDR S&P 500 ETF Trust SPY, plummeting below the 4,200-point threshold.
After the initial negative price movement at the market open, some buyers reemerged, propelling the index to 4,220 points as of 10:15 a.m. ET. It’s worth noting that this level still represents the index’s lowest point since June 1.
Concurrently, yields on 10-year Treasury bonds, a key barometer for assessing financial market conditions, briefly hit the concerning 5% mark, reaching levels not seen since 2007 before retreating slightly.
Should the S&P 500 index conclude Monday with another negative performance, it would signify the fourth consecutive session of declines.
In the last month, Tesla Inc. TSLA, Amazon Inc. AMZN, Apple Inc. AAPL, and Berkshire Hathaway Inc. BRK have been the biggest negative contributors to the overall performance of the SPY ETF.
S&P 500 Daily Chart: Key Moving Averages, Fibonacci Levels

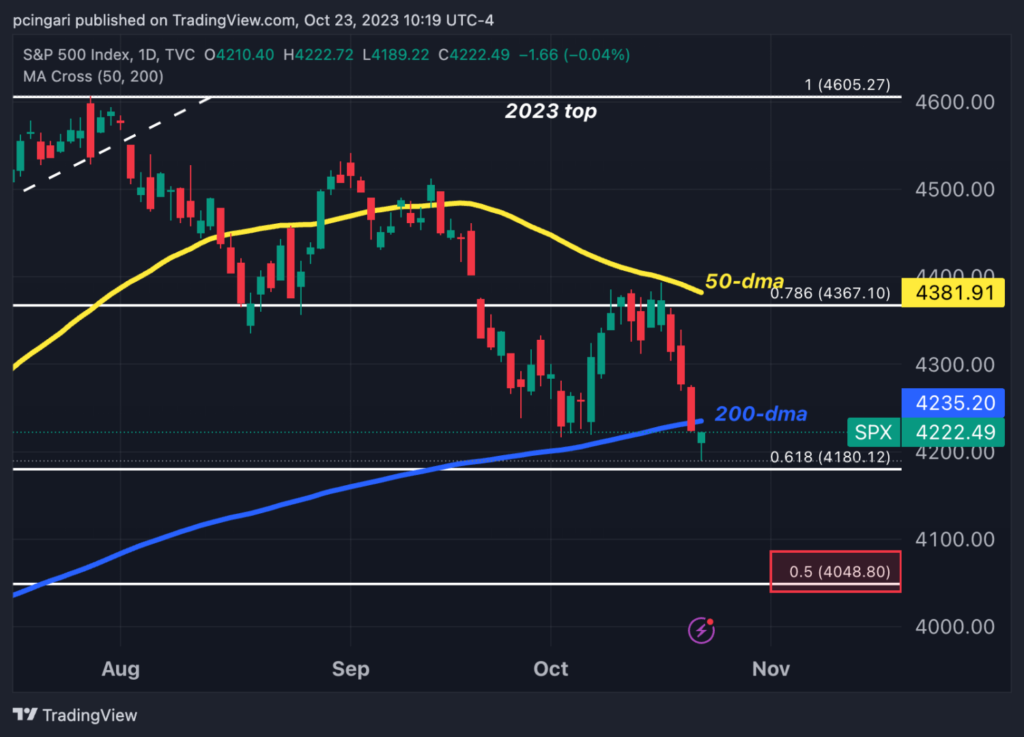
From a technical standpoint, the spotlight is squarely on the significant breach of the 200-day moving average since over the last six months. The S&P 500 had consistently traded above this critical support.
The failure to hold above the 200-day moving average represents a setback for bulls and could show the formerly bullish trend has undergone a decisive reversal.
The next noteworthy level to monitor is 4,048. This level holds significance as it represents precisely half of the bullish range between the 2022 lows and the 2023 highs.
Traders, Analysts React As S&P 500 Falls Below Key Moving Average
Jim Bianco, the head of Bianco Research LLC, said: “right now, this metric indicates that the primary trend is downward,” as stated in a social media post on X.
Wall ST Engine has also noted the SPY is hovering around a critical support level at $418. This zone could potentially serve as a stabilization point, offering the possibility of a substantial relief bounce.
Jim Colquitt, founder and president of Armor Index, Inc., said that in March, when the S&P 500 fell below the 200-day moving average, the maximum decline below this average was just 3.35%. Subsequently, the S&P 500 went on to appreciate by 20.96%, reaching its peak on July 27.
ETFs Tracking The S&P 500
In addition to the SPDR S&P 500 ETF Trust, the largest exchange-traded fund tracking the S&P 500, traders will also keep a close watch on other significant ETFs that track the major U.S. stock average.
- iShares Core S&P 500 ETF IVV
- Vanguard S&P 500 ETF VOO
- Invesco QQQ Trust QQQ – While not a direct S&P 500 tracker, this ETF tracks the NASDAQ-100, which includes many large-cap technology stocks also found in the S&P 500.
- SPDR Portfolio S&P 500 ETF SPLG
- Schwab S&P 500 Index Fund SWPPX
Read now: Bitcoin Mining Stocks Marathon Digital, Riot Platforms Are Moving Monday: What’s Going On?
Photo via Shutterstock.
Edge Rankings
Price Trend
© 2025 Benzinga.com. Benzinga does not provide investment advice. All rights reserved.
date | ticker | name | Price Target | Upside/Downside | Recommendation | Firm |
|---|
