

Etsy, Inc ETSY gapped down about 4% on Thursday in tandem with the S&P 500, which gapped down about 2.6% following news Russia had begun a full-scale invasion of Ukraine.
Etsy will print its earnings on Thursday after the markets close and analysts expect the e-commerce company to report earnings per share of 79 cents.
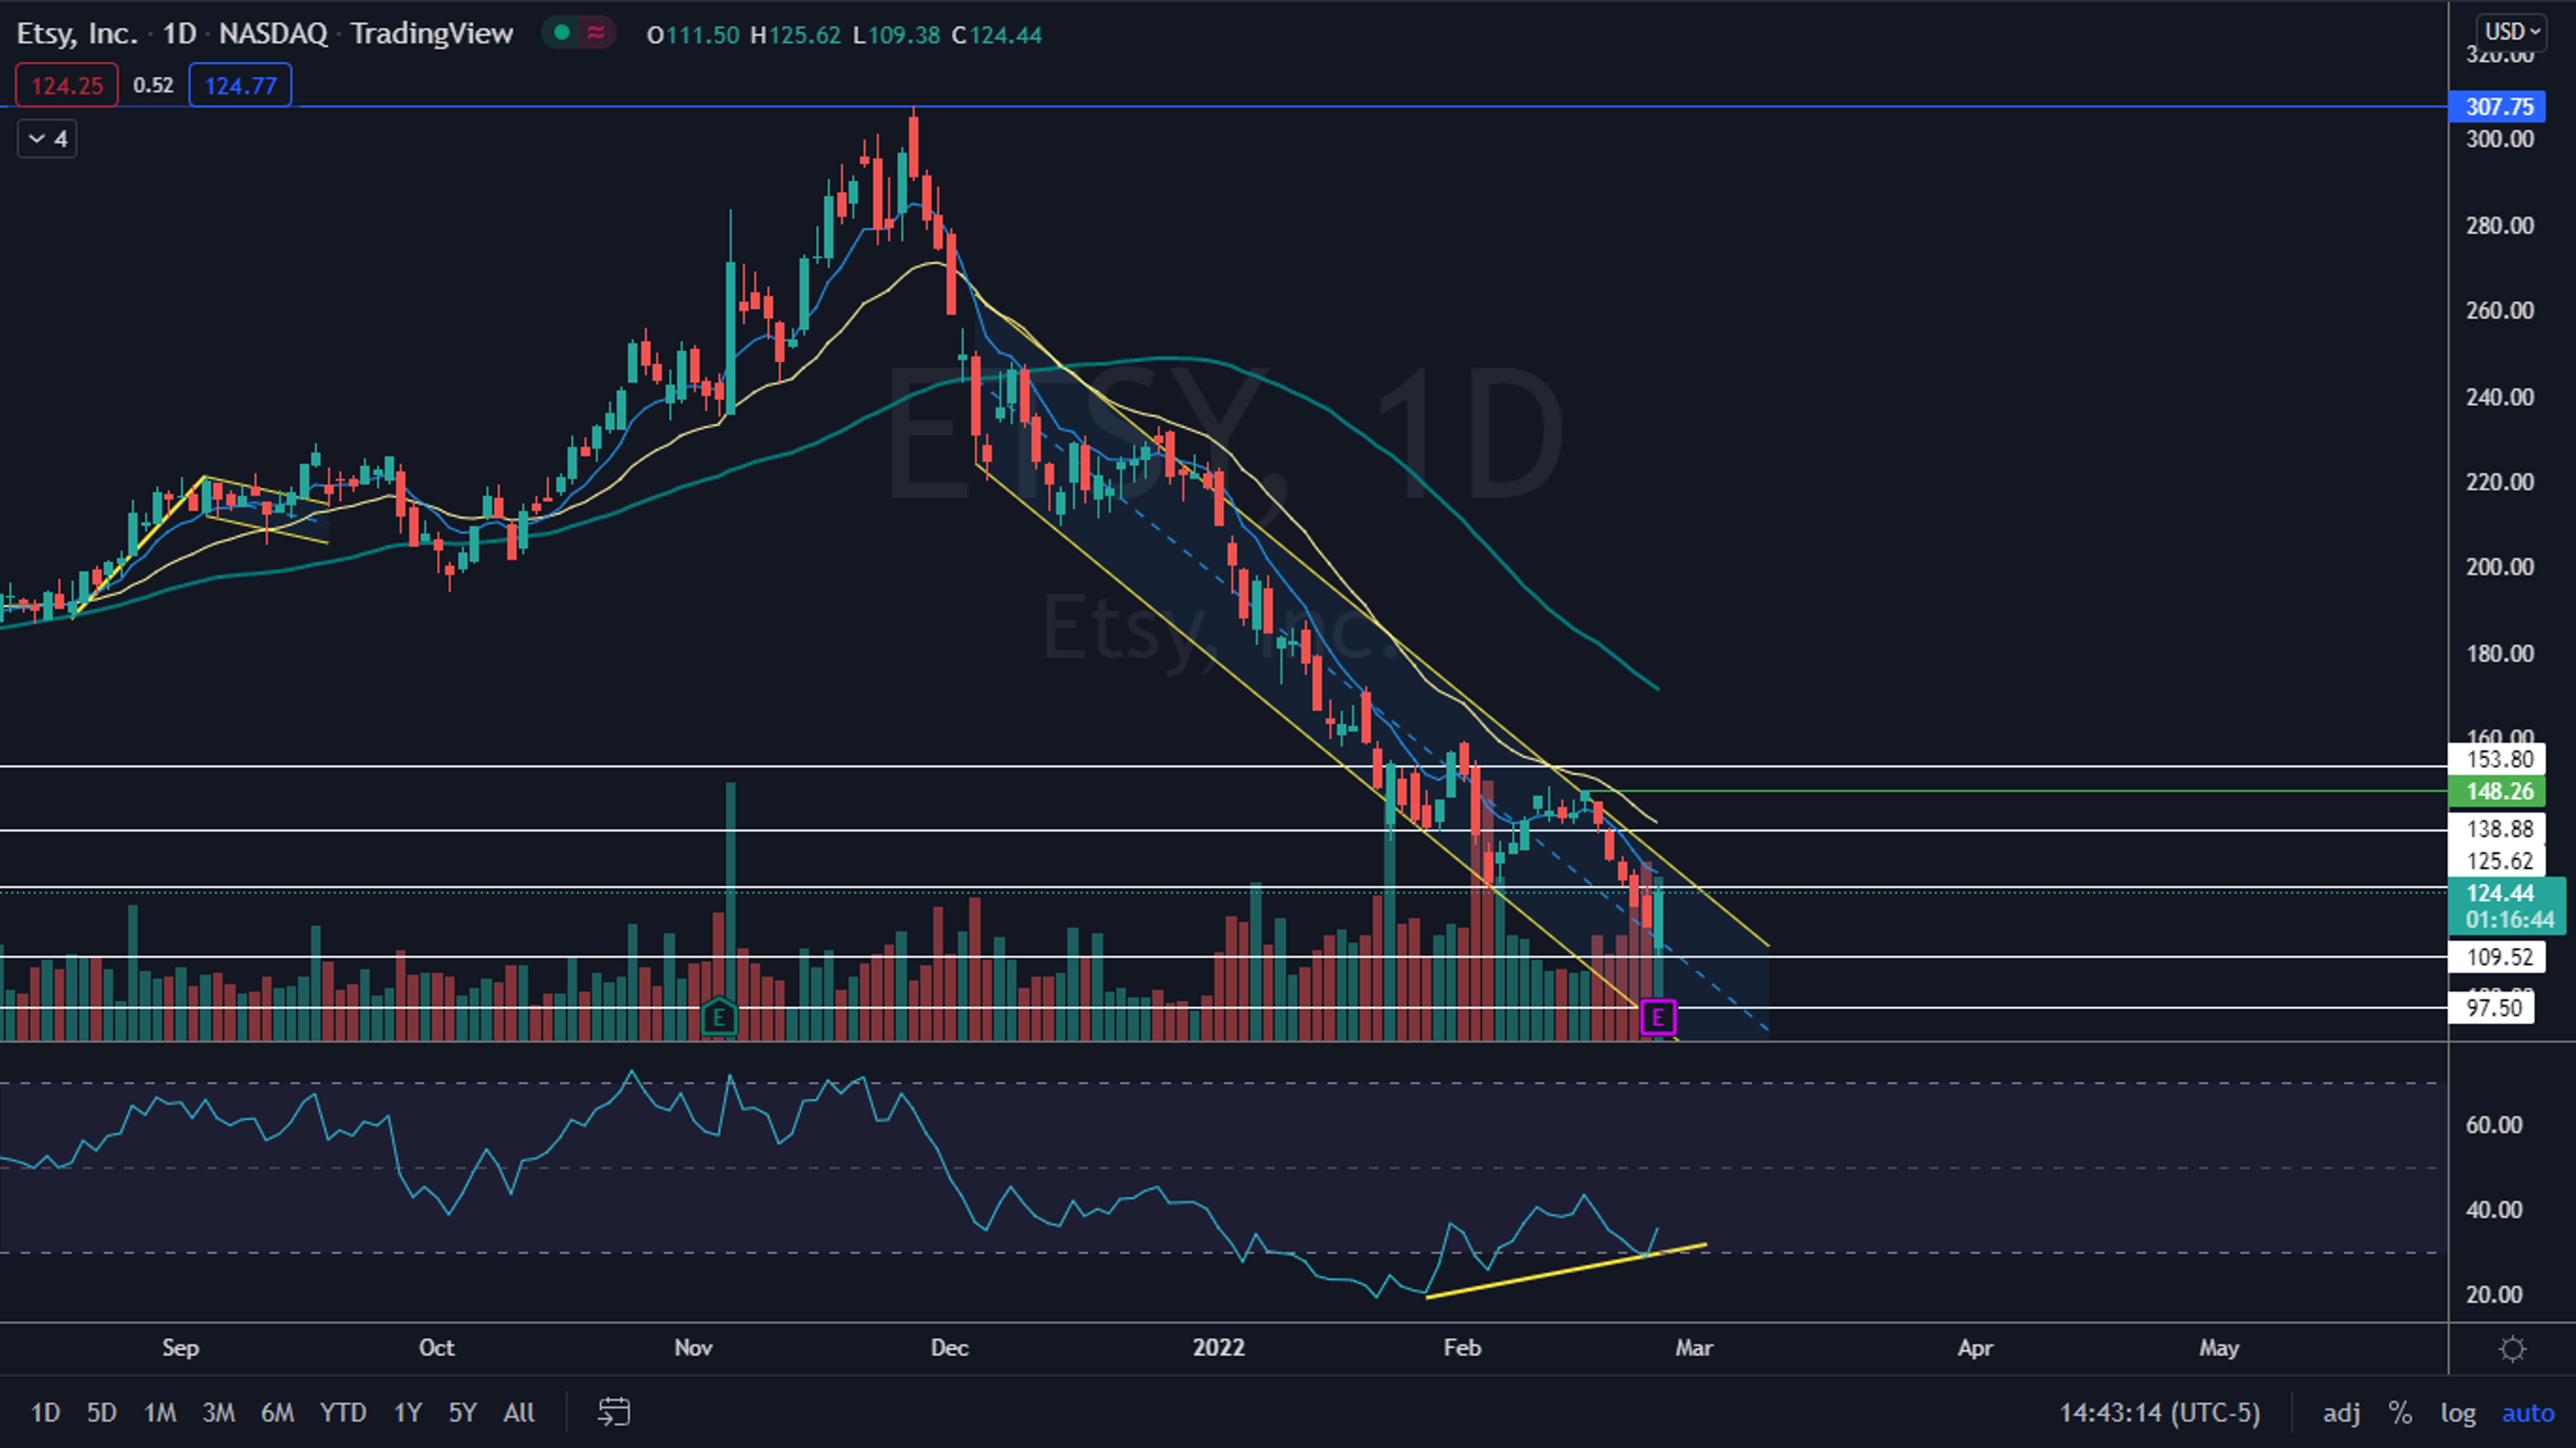
When Etsy reported its third-quarter financial results on Nov. 3, the stock rallied almost 20% the following day, which put Etsy on an upwards trajectory to a new all-time high of 307.75 on Nov. 26. For that quarter, Etsy reported earnings per share of 62 cents versus an estimate of 54 cents.
Over the past few weeks, a number of analysts have weighed price target adjustments for Etsy. On Jan. 25, Needham maintained a Buy on Etsy and lowered the price target to $280. On Feb. 2, UBS upgraded the stock to Neutral but lowered its price target to $180, and more recently on Feb. 10, Truist Securities maintained a Buy and lowers its price target to $230.
See Also: Looking for a Market To Sell Your Products? Ethair Market's Beta Is Now Open For Purchasing
The Etsy Chart: Etsy has been trading in a downtrend within a falling channel since Dec. 3, making a very consistent series of lower highs and lower lows. Etsy’s most recent lower high was printed on Feb. 15 at $148.26 and since that date, the stock has slid about 25% lower before printing a possible lower low and reversal signal at the $109.38 mark on Thursday.
Etsy has developed bullish divergence on the daily chart because the stock has made lower lows but the relative strength index has been making a series of higher lows. Bullish divergence is often found at the bottom of a downtrend and can indicate a correction to the upside is in the cards.
If the divergence corrects, Etsy may break up bullishly from the falling channel, which could indicate a strong reversal may be on the way. Traders and investors can watch for a break from the pattern on higher-than-average volume on lower timeframes to gauge whether the channel was recognized.
On Thursday, Etsy was also printing a bullish engulfing candlestick on higher-than-average volume, which indicates higher prices may come on Friday. As of midafternoon about 4.9 million shares of Etsy had exchanged hands compared to the 10-day average of 2.88 million.
Etsy is trading below the eight-day and 21-day exponential moving averages (EMAs), with the eight-day EMA trending below the 21-day, both of which are bearish indicators. The stock is also trading below the 50-day simple moving average, which indicates longer-term sentiment is bearish.
Want direct analysis? Find me in the BZ Pro lounge! Click here for a free trial.
- Bulls want to see big bullish volume come in and push Etsy up through the upper descending trendline of the falling channel, which will cause the stock to regain support at the eight-day and 21-day EMAs. Etsy has resistance above at $125.62 and $138.88.
- Bears want to see big bearish volume come in and drop Etsy down below Thursday’s low-of-day, which will indicate the downtrend is still intact. There is support below the level at $97.50 and $88.02.

Edge Rankings
Price Trend
© 2025 Benzinga.com. Benzinga does not provide investment advice. All rights reserved.
