In the midst of this year’s Russell Reconstitution, we took a look at the importance of the annual event. And now that the results of this year’s recon are in, there are some key statistics worth highlighting.
Highlights Of The Russell Recon Results
This year’s reconstitution reveals the U.S. equity market increased in size, with the total market cap of the Russell 3000 Index up 51.9% from $31.4 trillion as of last year’s rebalance, to $47.7 trillion based on this year’s rank day (May 7, 2021).
Russell 1000 Index:
Russell 2000 Index:
Breakpoints
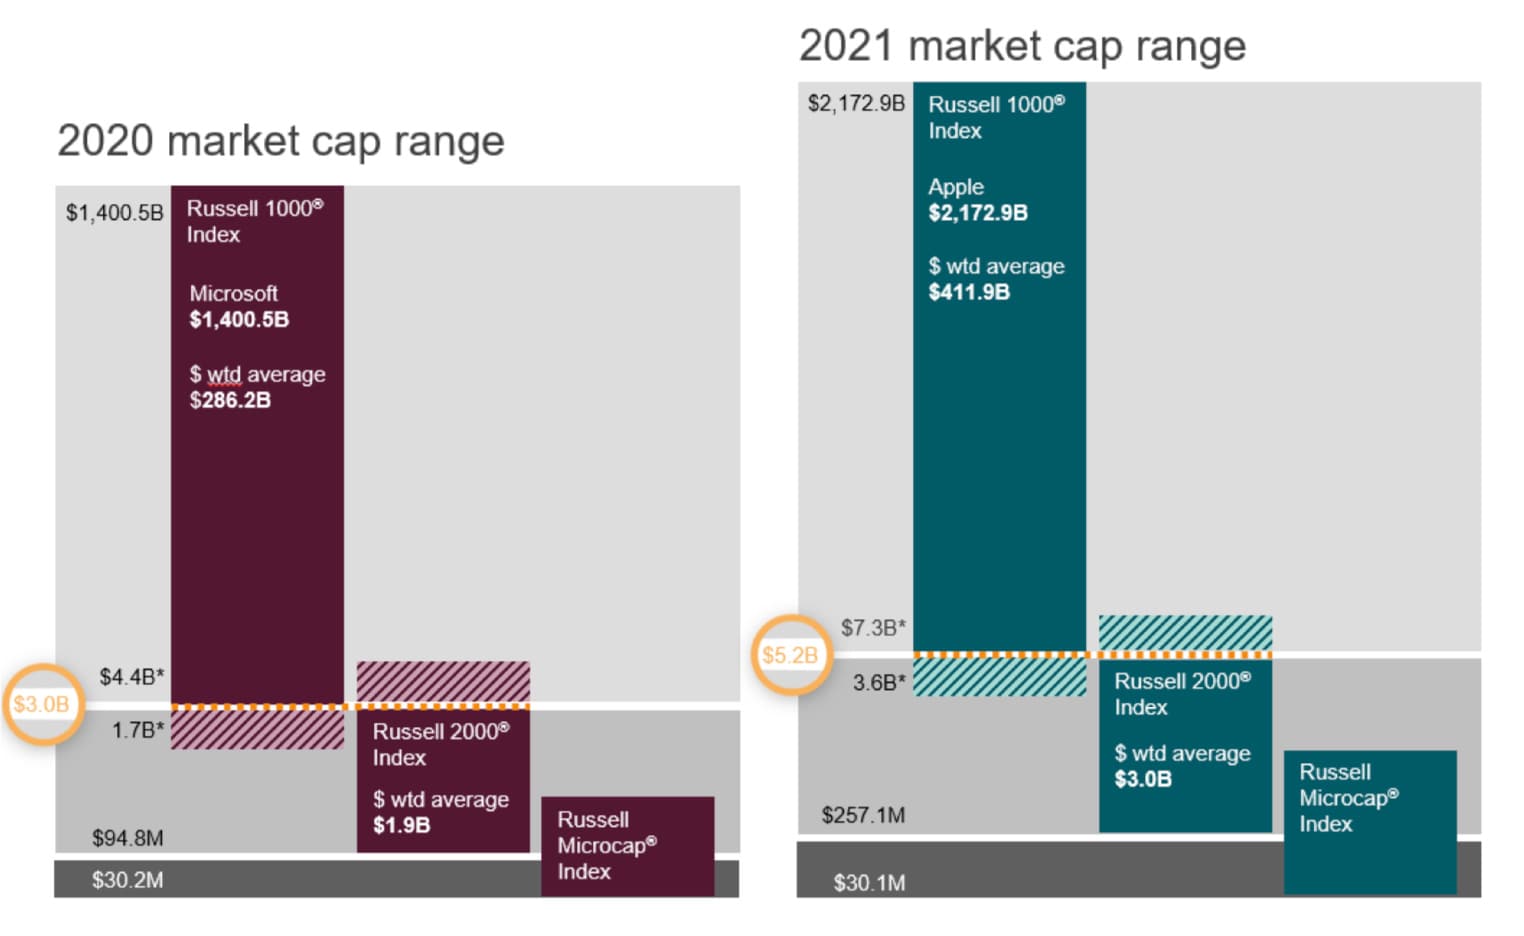
EXHIBIT 1: BREAKPOINTS BETWEEN RUSSELL 1000 AND RUSSELL 2000 INDEXES
Source: FTSE Russell. Reflects data as of May 8, 2020, and May 7, 2021, respectively.
Record Number Of Banks Removed
The surge in IPO activity in the past 12 months has been remarkable. More than 850 companies have gone public in the U.S., raising a record $173 billion, which is its highest level of activity dating back to February 1997. The market cap threshold for inclusion in the Russell 2000 has risen to $257 million, the highest since 2007.
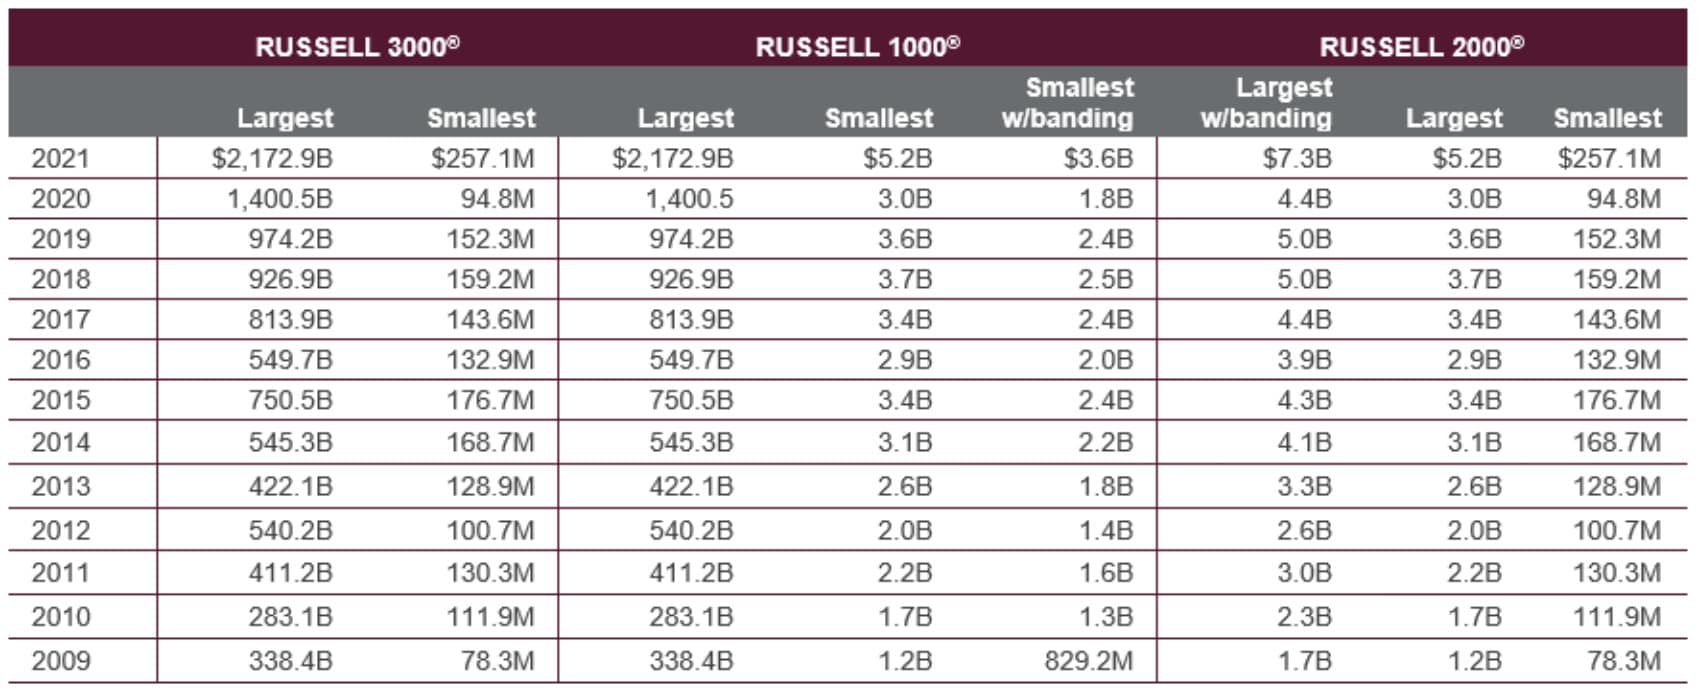
EXHIBIT 2: HISTORICAL MARKET CAP THRESHOLDS FOR RUSSELL U.S. INDEXES
Source: FTSE Russell
U.S. banks have lagged the post-pandemic market recovery, and as a result, many were dropped from the Russell 2000 this year. In fact, a record number of financial services companies were deleted from the Russell 2000 Index this year.
Small Cap Russell 2000 Outperforms
Away from the limelight given to FAANG and Nasdaq stocks, small-cap shares saw a tremendous run over the last 12 months. And for those investors looking to invest in small-cap stocks available in the U.S. stock market, the go-to index became the Russell 2000.
Comparing June 25, 2021, to the same day in 2020, the price of the Russell 2000 Index increased by 66%.
EXHIBIT 3: RUSSELL 2000 INDEX HISTORICAL PRICE
Source: Bloomberg LLC
Like most equity indices, the price of the Russell 2000 initially took a steep dive with the shutdown of the world economy as a result of COVID-19.
Small cap outperformance was a trend that began with a surge in performance in Q4 2020, while closely tracking the vaccine- and stimulus-fueled rise in long-dated U.S. Treasury yields. This macroeconomic backdrop aided the cheaper cyclical stocks that make up a bigger portion of the Russell 2000 small-cap index rather than the pricier tech stocks that dominate the larger Russell 1000 and the Nasdaq.
This rotation into cyclical stocks has slowed since mid-March with the recent stabilization of government bond yields, and release of consensus-beating quarterly earnings favoring a shift back to growth stocks. Nonetheless, the Russell 2000 has surged to a new, higher level in 2021, and when compared to its index counterparts, the performance of the Russell 2000 is unmatched.
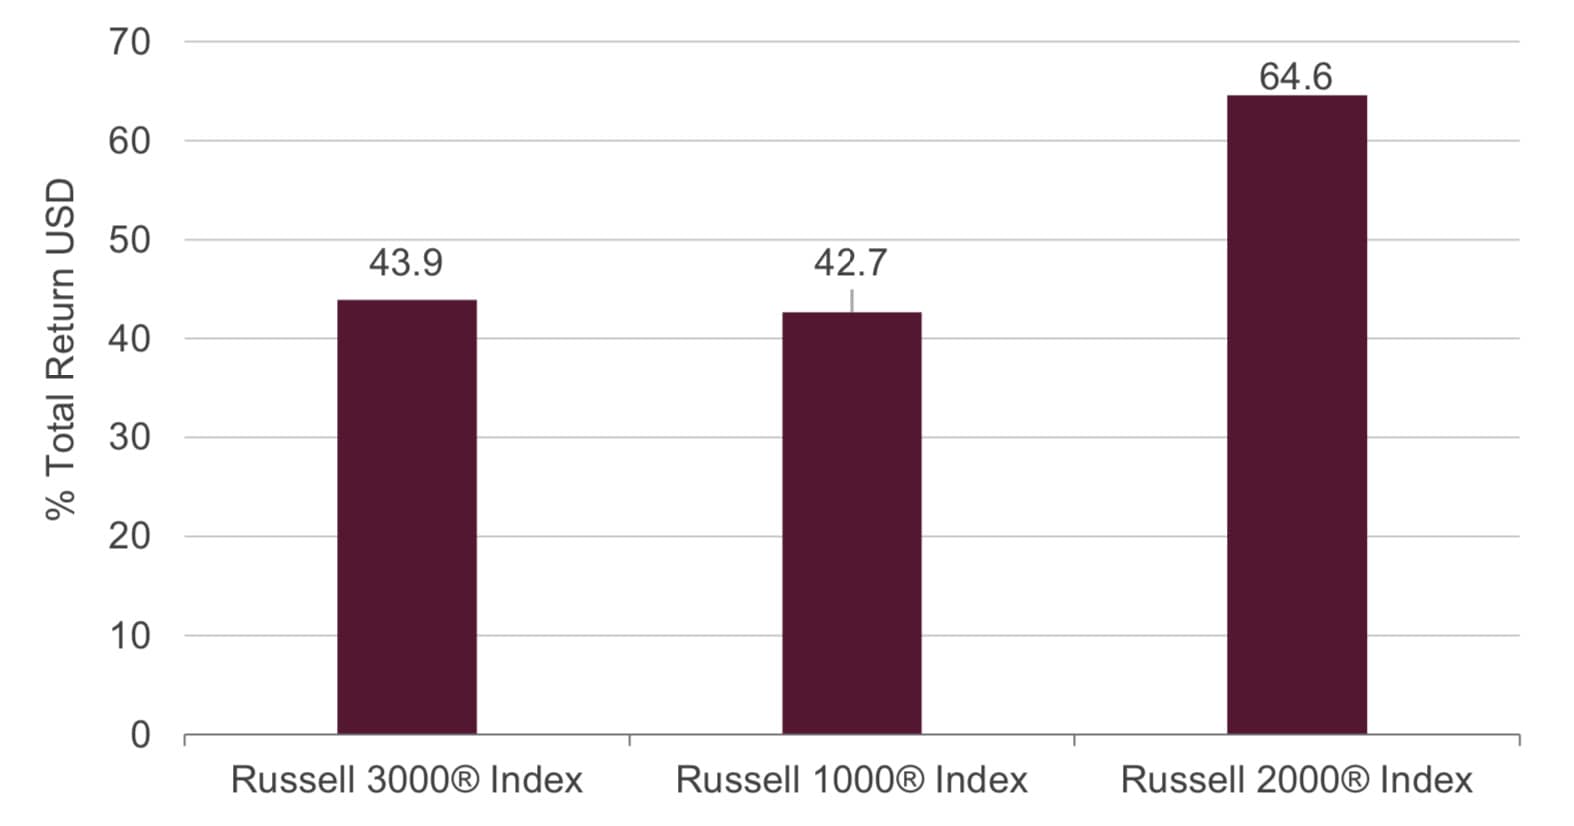
EXHIBIT 4: RUSSELL U.S. INDEXES PERFORMANCE
Source: FTSE Russell. Reflects data as of May 28, 2021.
Growth To Value Shift
The year 2021 saw a rise in both the Russell 1000 and 2000 Value Indexes, much of that driven by the healthcare industry. Specifically, the Russell 1000 Value Index saw an increase in the healthcare industry, whose weight increased from 11.8% in 2020 to 16.2% of the index in 2021. Similarly, the Russell 2000 Value Index also saw an increase in the weight of healthcare-classified stocks, from 5.6% in 2020 to 10.5% this year.
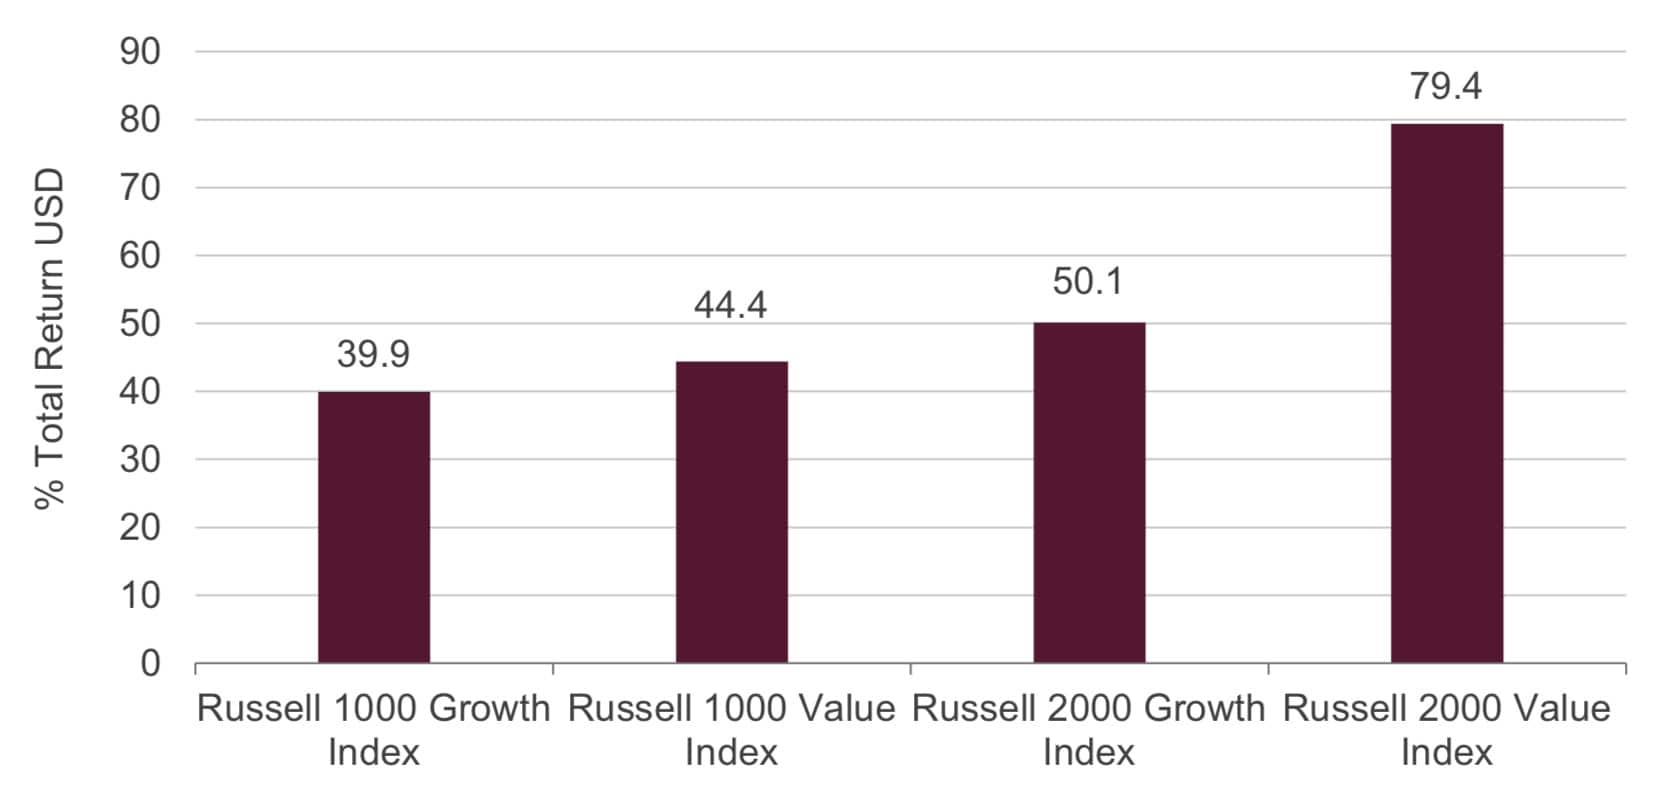
EXHIBIT 5: TOTAL RETURN OF FTSE RUSSELL GROWTH AND VALUE INDEXES
Source: FTSE Russell. Reflects data as of May 28, 2021.
There are times, especially after major market downturns, that value can be found in both the value and growth indexes. There are distinct differences in the sector weights within the two style indexes; as such, major moves in particular sectors can have an outsized influence on the relevant index performance. This is especially true when we look at these indices throughout the COVID-19 pandemic.
Also of note is that tech represents a much larger share of the Russell 1000 Growth Indexes than the Russell 2000 Growth Index. That bias also explains why large caps were outperforming in the early part of 2020 and at the start of the pandemic.
Driven by numerous fundamental factors, the interplay between growth and value stocks will continue to be a focus for U.S. investors. CME Group’s E-mini Russell Index futures can be used as a risk management tool to hedge the shifts in the Growth and Value Indexes. Russell 1000 Value futures have shown tremendous growth since the 2020 reconstitution, with open interest reaching a record high of 43,302 on June 17, 2021.
EXHIBIT 6: E-MINI RUSSELL 1000 VALUE FUTURES
Source: CME Group
Russell 2000 As An Economic Indicator
The performance of the Russell 2000 in 2021 paves the way for its inclusion as one of the major U.S. equity indices, alongside the Nasdaq-100, the S&P 500, and the Dow Jones Industrial Average.
EXHIBIT 7: MAJOR U.S. EQUITY INDICES PRICES, MARCH 2020 - PRESENT
Source: Bloomberg LLC
Investors look to equity markets for signs of the health of the U.S. economy. The close correlation of the Russell 2000 to these counterparts, particularly the Nasdaq-100, strengthens its role as an economic indicator.
The annual Russell Reconstitution provides numerous opportunities for market participants to trade and state their opinion about US. .equity markets, and CME Group’s suite of Russell Index futures provides convenient and cost-efficient tools for hedging that exposure.
Amid these historical swings, investors have been utilizing the small cap futures market at record levels, seeking vehicles to enhance portfolio performance and manage market risk. Since the start of the year, we have seen notable increases in volume on Russell 2000 Index-based futures (RTY) as market participants have used our markets to manage small-cap equity market price risk amid significant levels of volatility and continued uncertainty.
© 2026 Benzinga.com. Benzinga does not provide investment advice. All rights reserved.
To add Benzinga News as your preferred source on Google, click here.