


The more things change, the more they stay the same.
That old saying definitely applies to Tesla Inc TSLA and Apple Inc. AAPL this morning. Both finished their splits and now have much lower prices on paper, though the value of the companies hasn’t changed. Checking out their trading early today, you might blink when you see TSLA at $442 and AAPL at $124. Gee, we haven’t seen a quote that low on TSLA since when—last March?
While the changes are only cosmetic, history shows that retail investors often use stock splits as trading opportunities, accessing popular names that may have gotten too expensive pre-split. If that happens, it might help reinforce the mega-cap rally. The keyword is “if.” We’ll find out now if the people at AAPL and TSLA who planned these things had the right idea.
You might notice another change, too, as we approach the end of August. The Dow Jones Industrial Average ($DJI) gained three new names and lost three old ones. Typically, we don’t focus much on the $DJI despite its fame, because it’s such a narrow index of only 30 stocks.
However, seeing 10% of it transform overnight even as another big name in the index (AAPL) completes a split isn’t something that occurs every day, so we’ll see what happens with the $DJI here.
Shares of Amgen, Inc. AMGN, salesforce.com, inc. CRM, and Honeywell International Inc. HON have a new spotlight on them thanks to their inclusion, though it’s hard to say if they’ll get much of a boost today just from that. It doesn’t look like it so far. That being said, when an index shuffles its lineup, sometimes the market reaction happens before the actual change. CRM, for example, saw its shares shoot up 30% last week on solid earnings and its addition to $DJI.
Major indices have a firmer feeling this morning, but walked back most of their earlier overnight gains. With the S&P 500 Index (SPX) up around 7% so far in August, don’t rule out some last-minute shuffling causing pressure. Normally, you’d see that today since it’s the last day of the month. However, some of that might get pushed out later into the week this time because next weekend is a three-day holiday and we have the jobs report Friday.
The SPX is up an amazing 60% from its March low, and some analysts said recently they’re surprised there wasn’t some consolidation along the way. We had a brief hiccup back in June, but not much of that since. This could be the best August for the market since the 1980s and the best month since April if we hold these gains today.
Scattered Earnings Take Backseat To Jobs Data This Week
You might think major earnings would be a bit scarce the week before Labor Day weekend, and you’d mainly be right. That doesn’t mean no one’s out there. Macy’s Inc M, Campbell Soup Company CPB, Broadcom Inc AVGO and Five Below Inc FIVE are all expected to share results between now and Friday.
Still, earnings probably take a backseat to employment data. The entire week builds up to Friday’s August payrolls report, and early forecasts indicate lower expectations compared with the last few months. Consensus is for job growth of 1.4 million, according to Briefing.com, compared with July’s 1.76 million and June’s 4.79 million.
The thing worrying some people is that the monthly data got collected at a point in mid-August when weekly initial jobless claims briefly swelled. We’ll talk more about employment and its potential impact as the week continues.
Economic data today is a bit thin, but maybe investors are still basking in the positive numbers out last Friday. Those included a strong personal income reading and improved consumer sentiment. These data may have provided support Friday to “reopening” stocks like casinos, cruise lines, and airlines. It would be good to see this trend continue.
Be on the lookout tomorrow morning for the August ISM manufacturing index, which can influence trading. Consensus is for a reading of 54.5%, Briefing.com said, up just a bit from 54.2% in July. Anything above 50% indicates expansion.
Optimism Creates Valuation Concerns
There’s a lot of positive sentiment right now, and the way things have gone—with August likely to be the fifth-straight higher month for major indices— a skeptic might wonder exactly how firm many of the long positions are.
Sometimes you get a build-up of so-called “weak longs” who jump in without much conviction on the way up and quickly bail if things get rough. Weak longs exiting in bulk can cause what might otherwise be a short market pullback to build on itself.
The other thing that’s a little worrisome is seeing major indices so far above their key support levels. As of Friday’s close, the SPX rested about 14% above the 200-day moving average of 3071.
When you look back at other recent times when the SPX got way above its 200-day (aside from earlier this year when COVID-19 was a huge black swan no one expected), the wide gaps often preceded sharp market declines (see chart below).
For instance, in September 2018, the SPX had a nearly 7% premium to its 200-day and fell almost 20% by late December. Before that, in late January 2018, the SPX had about the same premium to its 200-day as it does now and proceeded to fall 10% in just over two months.
In both cases, volatility quickly ramped up as nerves flared.
No one’s saying the same thing is on tap, because history isn’t a forecast. It only reminds us what’s sometimes happened at times like these in the past. Investors shouldn’t ignore the chance for a potential 5% to 10% pullback in coming weeks, especially with stress building ahead of the election.
That’s why now might not be the best time to go “all-in.” Instead, it could be a good time to check your portfolio and make sure your asset allocation and sector balances still fit your long-term plans.
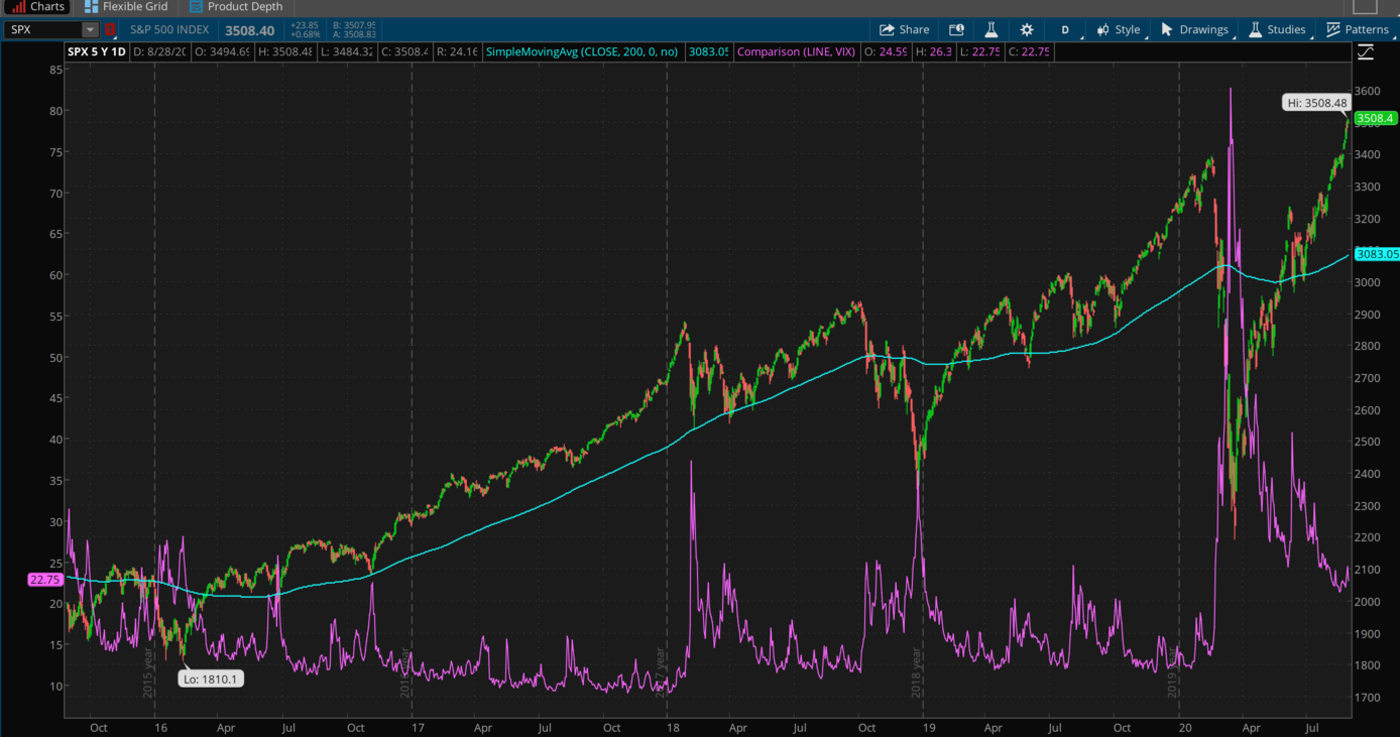
CHART OF THE DAY: FROM PEAKS TO VALLEYS: This five-year chart of the S&P 500 Index (SPX—candlestick) also tracks the 200-day moving average (blue line) and the Cboe Volatility Index (VIX—purple line). You can see toward the middle of the “x” axis that twice during 2018, a heavy SPX premium to the 200-day was quickly followed by a sharp selloff and huge gains in the VIX. The SPX now is as high above its 200-day as it was back in early 2018, raising concerns about possible overbought conditions. Data Sources; S&P Dow Jones Indices, Cboe Global Markets. Chart source: The thinkorswim® platform from TD Ameritrade. For illustrative purposes only. Past performance does not guarantee future results.
Dollar Hits Two-Year Low: The dollar continued losing ground late last week after the Fed’s pivot on inflation policy, and that’s not necessarily great news in the long-term for stocks. Sure, the dollar’s recent weakness probably helped “growth stocks” by signaling a “risk-on” environment (dollar strength often coincides with times when investors are more risk-averse like when they piled into the greenback during the pandemic downturn). Also, a softer dollar can help earnings at multinational companies like Deere & Company DE, Caterpillar Inc. CAT, and mega-cap Tech firms by raising overseas demand for their products.
On the other hand, the dollar has been pretty strong over the last half-decade coinciding with the rally that’s nearly doubled the SPX since early 2016. Dollar strength—also evident during the long stock market rallies of the 1980s and 1990s—can tell the world the U.S. has healthy consumers with spending power and companies looking to invest. When the dollar starts to wilt, money sometimes starts gravitating to other places—Europe and Asia, for instance. Some analysts say that with U.S. stock indices at record highs and the dollar taking a hit (the dollar index fell below 93 recently for the first time in more than two years), overseas markets might find more of a bid. That said, Europe’s stock market looks pretty lackluster compared with the SPX this summer, and Shanghai stocks have leveled off since the fierce rally of early July. Let’s say the jury is still out.
Tech Isn’t Everything: You might have read the Forbes article last week warning investors not to interpret the SPX rally as emblematic of a strong U.S. market picture. The article noted that without a small handful of Tech and Communication Services stocks like Apple Inc. AAPL, Amazon.com, Inc. AMZN, NVIDIA Corporation NVDA, and PayPal Holdings Inc PYPL, the SPX would actually still be down nearly 9% year-to-date. Sixty-three percent of SPX stocks are lower for the year, Forbes noted.
We’ve spent plenty of time talking about a top-heavy SPX, so there’s nothing wrong with Forbes pointing out that seven of the 10 best SPX performers this year are Tech stocks and that Tech makes up 37% of the SPX. The counter-argument is that the rally is a bit broader than some give it credit for. Evidence isn’t hard to find. Just check the Russell 2000 Index (RUT). While RUT is down about 5% for the year, that reflects a dominance of Financial stocks hard hit by low-interest rates. Despite that handicap, RUT actually outpaced the SPX for a while this summer, and basically kept up with it in August. The RUT’s a more domestic-weighted index than the SPX and arguably could better reflect the underlying U.S. economy.
Beyond that, the Russell 1,000 Index (RUI), which includes the 1,000 biggest U.S. companies and many mid-cap names, is up nearly 9% year-to-date, outpacing 8.6% for the SPX. Obviously, some of the RUI strength reflects the amazing Tech rally, because it includes those mega-caps. That said, it’s less Tech-centric and has twice as many companies as the SPX. None of this means throw out the top-heavy argument, but it hopefully provides perspective.
A House Made of Sticks: In these tough times when many people just want the security of a roof over their heads, lumber continues to shine. Futures prices recently surged off the charts to above $800 per thousand board feet, easily taking out the all-time highs set in 2018. Anyone who’s interested in trading homebuilder stocks might want to keep an eye on the commodity, which can often give a sense of where housing demand stands. Lumber dropped well below $300 earlier this year when it looked like the economy was going into hibernation, but now it’s a different story as the trend points toward city people moving out to the suburbs for social distancing and demand for new homes has soared.
Lumber’s strength—and possibly strength in some other commodities like copper—could also be tracked back to the Fed’s incredibly dovish interest rate policy. “At its core, the lumber rally reflects that the accommodative policy implemented by the Federal Reserve is having a meaningfully positive impact on the economy,” wrote BCA Research in a note earlier this month. “Construction activity drives lumber prices, and residential investment is one of the most interest-sensitive sectors of the economy. Moreover, residential investment is a leading indicator of overall economic growth.”
TD Ameritrade® commentary for educational purposes only. Member SIPC.
Photo by David von Diemar on Unsplash
© 2024 Benzinga.com. Benzinga does not provide investment advice. All rights reserved.
Date | ticker | name | Actual EPS | EPS Surprise | Actual Rev | Rev Surprise |
|---|
Trade confidently with insights and alerts from analyst ratings, free reports and breaking news that affects the stocks you care about.

