


Even though it’s been a tough stretch for the Nasdaq (COMP) and Info Tech, we may have our third-straight week higher on the S&P 500 Index (SPX). That’s pretty amazing when you consider all that’s going on in terms of bad news.
Everyone’s trying to balance the fact that we’re seeing more virus cases, but states are taking action to lock things down. What’s that going to mean and how badly will it delay things getting back to normal? Those are questions we just don’t have answers to at the moment.
What’s interesting ahead of the opening bell is that stock indices are higher but bonds are also moving up. The 10-year Treasury yield is barely holding above 0.6%, near the low end of its month-long range (see chart below). Crude prices are also down a little bit. These are signs of possible caution, and maybe could signal tough sledding for stocks as they try to maintain these early gains.
The disappointing guidance from Netflix Inc NFLX late Thursday is dragging shares of that “FAANG” name down more than 8% in pre-market trading. Other earnings news is a bit light today. On the data watch, June housing starts and building permits out early this morning were kind of mixed. Starts just edged out analyst expectations while permits fell short.
Netflix Interrupts A Quiet Thursday
Yesterday was packed with data and earnings but not much action in the market. At 8:45 a.m. Thursday, the S&P 500 Index (SPX) was at 3206. By 2:15, it was at 3210. Four points in six hours won’t exactly keep anyone on the edge of their seat.
On the plus side, things did pick up in the final half-hour, and the SPX managed to close well off its lows. That was before the unpleasant NFLX news that showed up right after the final bell.
By now you’ve probably seen the news about NFLX missing analysts’ Q2 earnings projections and providing softer than expected Q3 guidance. The rest of the story, and what’s interesting, is that NFLX did beat on Q2 subscriber adds with a very solid 10.09 million. That was well above the Street’s expectations and the company’s own guidance on what it feels like everyone sees as the most important measure.
Looking at analyst reports this morning, it sounds like some are discounting the big subscriber adds last quarter. They’re saying a lot of these subscribers may be subject to “churn,” meaning they could be “lockdown” subscribers who NFLX has a hard time keeping when things get back to normal. These analysts believe NFLX has reached the point of diminishing returns on subscriber numbers. That’s a theory that only time can test.
What seemed to also bother investors and analysts was NFLX’s forecast for the Q3 subscriber adds, which led some analysts to wonder if NFLX has collected all the low-hanging fruit in these troubled times. The 2.5 million new subscribers that NFLX forecasts could mean that analysts who predicted the company would “pull forward” future demand—basically poaching on future subscriber growth—were correct.
That’s not too surprising when you think about it. We could even see the same type of formula play out later this quarter with many of the big-box stores that did so well early in the pandemic when people prepared to be shut-in. After all, there are only so many cans of tuna fish and cat litter people can buy, just like there are only so many people who will subscribe to watch movies. Big-box earnings are a ways down the road, but maybe that’s something to keep in mind.
Getting back to the overall market, things keep churning along between days when people seem optimistic about reopening the economy and days like yesterday when they don’t. Also, the rotation out of Information Technology that began early this week doesn’t seem to be losing much steam, pressing the COMP pretty hard. It’s been the worst-performing index the last few days.
It wouldn’t be a good idea to count out the COMP, however. The mega-cap Techs and chip stocks—most of which lost ground yesterday—have a way of surprising you, and a lot of resilience (which you kind of saw yesterday with AMZN regaining most of its steep early losses). Still, with the incredible dichotomy in valuations between the Tech sector and some of the more cyclical ones like Financials and Industrials (see more below), it’s not hard to see why some rotation might be happening.
Check Ahead
Since this week is almost a wrap, let’s take a look at what’s ahead on the earnings front after the weekend. Things start off a bit light on Monday, then accelerate as the days pass. Tuesday brings some of the venerable companies many associate with American consumer power, like United Airlines Holdings Inc UAL, Philip Morris International Inc. PM, and Coca-Cola Co KO. Together, these three could help investors get a really well-rounded understanding about how consumers felt during Q2, both here and abroad.
Wednesday delivers freight powerhouse CSX Corporation CSX for a view from the tracks, along with Microsoft Corporation MSFT for a look at cloud demand. Las Vegas Sands Corp. LVS and Chipotle Mexican Grill, Inc. CMG could be worth scrutiny as the economy opens up.
Other major companies slated to report as the week advances include Honeywell International Inc. HON, American Airlines Group Inc AAL, Union Pacific Corporation UNP, and early word from the microchip market with Texas Instruments Incorporated TXN. If there’s any one takeaway for the coming days, maybe it’s to closely watch the Dow Jones Transportation Average (INDEXDJX:$DJT), because it feels like we’ll have more than our fair share of shipping and passenger travel companies on the front page.
Speaking of which, cruise lines took it on the chin yesterday as the Centers for Disease Control and Prevention (CDC) banned cruises in U.S. waters through September. We’ve said it before and will say it again: If you’re not prepared for a wild ride, it’s probably not a good idea to embark on a cruise or airline stock at this juncture. If you do, consider not putting in more than you’re comfortable losing, because these stocks can change directions a lot faster than actual ships and planes.
While next week is packed on the earnings front, it’s kind of like watching paint dry when it comes to data. There’s a bit of a lag in the numbers at this point in the quarter. The only ones that really stick out next week are June existing and new home sales. Otherwise, investors are probably going to continue closely monitoring initial jobless claims, which just aren’t budging. It’s been 17-straight weeks of one million or more, and last week’s 1.3 million was about even with the week before.
Another couple of things to think about next week: The “fiscal cliff” is what analysts are calling the end of government stimulus measures looming at the end of July. Congress still seems pretty divided about any new checks for people hurt by the pandemic, with Republicans and Democrats far apart. Will there be any new developments in the days ahead? The market could trade on this.
Also, China has been a frequent focus lately. A sharp rally there earlier this week followed by a heavy selloff Thursday apparently influenced market action here in the U.S. Tensions between Beijing and Washington continue to wax and wane, with more news almost every day. Don’t be surprised if the market keeps being headline-sensitive on this particular topic.
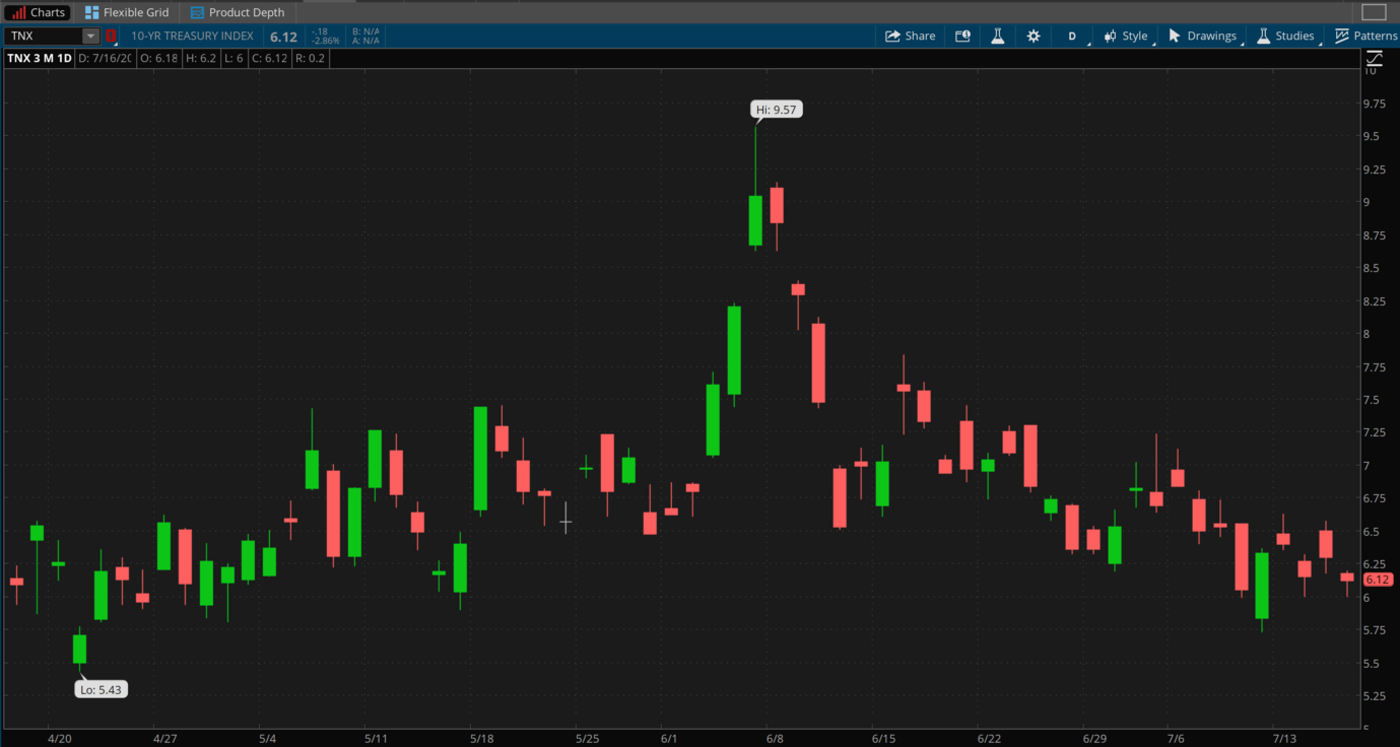
CHART OF THE DAY: 10-YEAR STUCK IN THE SIX’s: Yep - the 10-year yield (TNX—candlestick) finished yet another day yesterday hanging out between 0.6% and 0.7%. That was the 16th-straight session of closing in this particular range, and yields have ended in the 0.6% to 0.7% range in 41 of the last 57 sessions going back to late April, as this three-month chart shows. Data Source: Cboe Global Markets. Chart source: The thinkorswim® platform from TD Ameritrade. For illustrative purposes only. Past performance does not guarantee future results.
Bargain Hunting? Though the impact on the overall market is unclear, it wouldn’t be all that surprising to see some sector rotation considering valuations. Keep in mind that the average historic forward price-to-earnings (P/E) multiple of the SPX is around 16, and then look at the current P/E for Information Technology of 27.3, and you can see why some investors might wonder if the sector has gotten a bit overbought. On the other side of the coin, the forward multiples for Financials and Health Care are just 15.6 and 17.4, respectively, according to data from CFRA and S&P Global. Those P/Es are below the current 25.1 for the overall SPX, and are among the sectors where some of the money has been going this week. Overall, the P/E for growth sectors and value sectors are 30.9 and 19.5.
While low interest rates and “fear of missing out” (FOMO) can help explain why many investors and fund managers keep piling into growth (especially Tech), you could argue that value has been unfairly overlooked and maybe now that’s being rectified a bit. It doesn’t hurt that both the big banks and regional banks have mostly had a good start to earnings season. We’ve focused a lot on the huge mega-banks with trading businesses, but the regional banks reporting so far haven’t been too bad, either. They did raise more credit reserves to guard against bad loans, but overall, the rise wasn’t as big as some analysts had expected. Strength in the regionals could be helping the Russell 2000 Index (RUT), where regional banks are heavily concentrated.
How’s the Consumer Doing? We’ll know more a little later this morning with the latest reading on consumer sentiment from the University of Michigan. Back in June, when reopening was in full swing, the headline number rose nicely from the depths of April and May, reaching 78.1—up from May’s 72.3 (the lowest in more than five years). Is the rise in virus cases since then affecting consumers’ moods, and, if so, how might that affect the retail economy? Analysts expect a slight dip in the preliminary July headline reading to 77.6, according to Briefing.com. It’s never a bad idea to check the press release on these reports, which typically includes some insightful comments from the survey’s chief economist. Last month’s release noted that sentiment slipped in the second half of June, already reflecting an uptick in virus numbers.
Watching Rates/Volatility for Clues: Anyone hoping the Treasury market might provide direction is likely to be disappointed. The 10-year yield keeps bouncing around between 0.6% and 0.7% like one of those robot vacuum cleaners caught in a corner. Moves above and below that range lately have been quickly erased. We were sitting at 0.61% by the end of Thursday, near the low end and not anywhere near reflecting improvement in economic hopes.
Maybe volatility could provide a better sense of the sentiment. The Cboe Volatility Index (VIX) has mainly stayed below 30 lately and did that again Thursday, which could partly reflect easing tensions between the U.S. and China as well as the general stock market strength. However, any run back above 30 might get a fish eye from stock traders, because lately rallies in the VIX have sometimes preceded selloffs in equities.
TD Ameritrade® commentary for educational purposes only. Member SIPC.
Photo by freestocks on Unsplash
© 2024 Benzinga.com. Benzinga does not provide investment advice. All rights reserved.
Date | ticker | name | Actual EPS | EPS Surprise | Actual Rev | Rev Surprise |
|---|
Trade confidently with insights and alerts from analyst ratings, free reports and breaking news that affects the stocks you care about.

