


It’s an old adage that investors don’t like uncertainty. When California declares a state of emergency and the coronavirus spreads in other states, that definitely makes things feel uncertain and helps explain Thursday’s market plunge.
It was another ugly, ugly day that stripped away most of Wednesday’s gains. It looks like we’re still in a mode where people are stepping in to sell rallies and stay away from risk as much as possible, though there are some positive signs from a technical aspect (see more below).
Concerns about consumer and business demand showed up in the Dow Jones Transportation Average ($DJT), which skidded more than 5% Thursday and is down about 17% over the last month. Seasoned traders often look at the $DJT as a barometer of the broader economy, so when you see it lagging the major indices by this much, it isn’t too pretty.
Risk-Appetite Switch Flips To Off
Stocks fell dramatically at times Thursday but major indices ended a bit off their lows and the S&P 500 Index (SPX) closed above the psychological 3000 level. That’s a small victory, but doesn’t seem like much to celebrate when you consider the close was more than 3.3% below Wednesday’s. Major indices have finished up or down 3% or more in six of the last 10 sessions, and bond yields hit new lows as investors appeared to avoid snapping up more risky cyclical stocks.
Also, looking back, stocks closed with some positive energy Wednesday but that didn’t seem to bleed into Thursday’s session. So the brief move upward late today may not mean anything by tomorrow morning. We’ll have to wait and see.
Risk-off sentiment bled into oil, which declined despite the possibility of OPEC cutting production if Russia agrees. The risk-off mood apparently prompted safe-haven buying in gold and U.S. government debt, with the yield on the 10-year Treasury staying under 1% and even hitting an all-time low south of 0.9%. The bond market seems overbought, but its extreme moves also could be an indication that we might have more pain to slog through before things improve.
In addition to the news from California, market participants seemed to focus on the International Monetary Fund’s (IMF) announcement that global growth this year will be below last year’s 2.9% and the International Air Transport Association’s prediction that global airlines could lose $113 billion if the outbreak continues to spread.
Meanwhile, Apple Inc AAPL joined other high-profile companies in canceling its plans to attend the South by Southwest music and tech festival. Southwest Airlines Co LUV said it expects a Q1 revenue hit from the virus. Hotel and airline stocks continue getting hit. All this is leading to a snowball effect amid worries that the U.S. consumer—who almost single-handedly kept the rally going much of last year through the long trade war—might pull back.
Taking Precaution
As we noted earlier today, all this doesn’t mean people should panic. Instead, traders might want to consider precautions like tweaking order strategy measures—such as by widening out stop orders amid the volatility, and trading in smaller batches of shares.
For example, if you normally trade in blocks of 300 shares, consider scaling back to 100 shares. Reducing the size of your trade can be kind of like an umbrella from volatility (though nothing can completely protect you, of course), and if we have another downward move it potentially allows you to buy some more at a better price. That said, it could raise your trading costs, so that’s something to keep in mind, too.
This isn’t necessarily the new normal because it’s not likely to last forever, but in the meantime investors might want to stay on their toes and continue to expect wide ranges every day. Anyone who thinks volatility is going away in the next few weeks is probably kidding themselves.
While investors and traders focused on the negative, there were some bright spots to consider this week. These include governments working to help contain the economic fallout from the outbreak, the Fed’s surprise rate cut, an IMF announcement of a $50 billion aid package, and news that the U.S. Senate has the votes to pass an $8.3 billion emergency spending package to combat the spread of the virus.
Another positive sign is the Cboe Volatility Index (VIX) staying around 40 this week after testing two-year highs near 50 last week. VIX rose sharply Thursday to a high of slightly more than 41 (see chart below) . While the VIX doesn’t seem likely to go down much as long as the virus situation is fluid, the fact that it’s not retesting last month’s high near 50 could be a positive sign.
That said, don’t be surprised if VIX stays above 30 for a while to come. It might take a month or two to get things back to a more normal kind of market, if patterns from history hold.
A Little Shine In The Charts
From a technical standpoint, it was a good sign last week that the market held the level around 2870, which marked the 50% retracement from the February high of 3393 in the SPX to the December 2018 low near 2350. However, when we’ve had situations like this in the past, the SPX has often come back to test the initial lows a month or two later. And if you look at the Dow Jones Industrial Average ($DJI), there are some signs of the index trying to consolidate at the 26,500 level, moving above and below it.
In the meantime, another supportive technical factor is that we’ve been seeing higher highs on the rallies and higher lows on the pullback. This is something technicians monitor for possible improved investor sentiment. That said, it’s not a good sign that the “defensive” sectors like Utilities and Real Estate have been leading rallies while cyclicals, especially Financials, lead things lower on days like today. It’s going to be very hard to have a sustained rally if Financials—the second largest SPX sector—keeps getting pounded.
Financials are probably going to stay under pressure as long as the yield picture doesn’t start to improve. Right now, there’s a lot of red in yields as investors continue piling into the bond market. This is despite signs of improvement in the epicenter of the virus—China— where pollution monitors show factories might be operating at higher volume than earlier this week. It’s kind of a crazy way to measure things, but it could mean something if China is getting back to work.
Also, stocks in Shanghai are up 3.5% for the month even while stocks here continue to have ugly days like today and remain about 11% below recent all-time highs. As bad as things look, we seem to be three weeks to a month behind Asia.
Anyone expecting the kind of “V-shaped” recovery of stocks like last May after a sharp dip on bad trade war news or after the December 2018 plunge is likely to be disappointed. Things look different this time, partly because the market’s moved from euphoria to uncertainty and pessimism so quickly. If you remember the recovery of January 2019, it came after three months of pretty steady losses. A lot of the sellers had basically gotten out over that time, so rallies had a better chance of holding on.
In this environment, there’s technical resistance in the 3170–3220 level of the SPX, and it’s likely that at some point we could see the market grind toward that area. For now, a close this week above Wednesday’s low of 3034 would possibly make things feel a little better from a technical standpoint, and so would any rally above the 200-day moving average of 3050. For now, we might have to just cling to a little hope from the SPX managing to close slightly above the psychological 3000 point today.
It’s also good that we continue to see orderly selling. Things have been incredibly orderly almost all of the last two weeks, with the possible exceptions of last Thursday and last Friday’s closes.
Jobs Data Tomorrow Get Overshadowed
Normally on a day like this, everyone would be getting geared up for Friday’s monthly payrolls report. The report is still worth watching, but because of the backward nature of the numbers, it might not get as much attention as usual. Analysts expect the report to show 170,000 jobs created in February, according to Briefing.com, but coronavirus didn’t really become a major scare until the last week of the month, so we may not see this weigh heavy on the February report.
Sectors like hospitality and travel, which took a hit because of travel cancellations might start cutting jobs because of the virus outbreak. It’s unclear if that’s underway, and, if it did happen, whether it happened early enough in February to be reflected in tomorrow’s numbers. Either way, the March report could end up ultimately being more relevant, but we have to wait four weeks.
For a better sense of real-time virus impact, maybe wait for the sentiment number next Friday from the University of Michigan. Sentiment numbers lately have been pretty good, actually, but with so many events canceled and airlines cutting back flight schedules, sentiment could start taking it on the chin.
Apparently many investors continue to think the market can force the Fed’s hand to ease policy further. Remember, the Fed meets the week after next and makes its decision on March 18 after lowering rates 50 basis points earlier this week. Futures at the CME Group now price in an 80% chance of the Fed taking rates down another 50 basis points at that meeting. Still, a lot can happen between now and then, so maybe it’s too early to see this as a done deal.
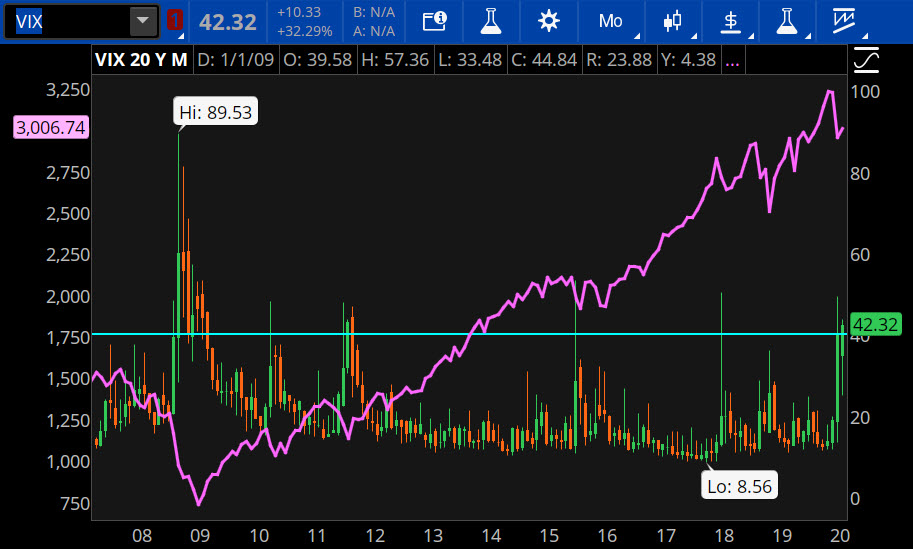
FIGURE 1: NOT QUITE THE ‘09 VOL SPIKE. Investors looking at this week's market and drawing parallels to the financial crisis of 2008–09 might be interested in this 20-year chart of the Cboe Volatility Index (VIX—candlestick). This week's move in the VIX above 40 is the fifth such move since 2008. Each one has been short-lived and topped out around 50, whereas in October 2008 VIX climbed to 89—and stayed above 40 for several months. And when looked at in the context of the move in the S&P 500 Index (SPX—purple line) it's clear that this week's action seems orderly compared to the financial crisis. Data source: Cboe Global Markets. The Cboe Volatility Index (VIX) is once again Chart source: The thinkorswim® platform from TD Ameritrade. For illustrative purposes only. Past performance does not guarantee future results.
Information from TDA is not intended to be investment advice or construed as a recommendation or endorsement of any particular investment or investment strategy, and is for illustrative purposes only. Be sure to understand all risks involved with each strategy.
Image Sourced from Pixabay
© 2024 Benzinga.com. Benzinga does not provide investment advice. All rights reserved.
Date | ticker | name | Actual EPS | EPS Surprise | Actual Rev | Rev Surprise |
|---|
Trade confidently with insights and alerts from analyst ratings, free reports and breaking news that affects the stocks you care about.

