


EUR/USD Current Price: 1.1255
- EU Consumer Confidence improved to -14.7 in June, according to preliminary estimates.
- Wall Street advanced and weighed on the dollar, despite rising concerns rising coronavirus cases in the US.
- EUR/USD is trading between Fibonacci levels, bullish potential slowly increasing.

The greenback edged lower this Monday, with the EUR/USD pair hitting a daily high of 1.1269 during the American afternoon. The American dollar found some favor at the beginning of the day amid the dismal mood that kept Asian equities trading in the red throughout the session. European ones followed the lead, but the focus shifted to a continued increase in coronavirus cases in the US across the South, West, and Midwest. Wall Street, however, managed to grind higher, adding to the dollar’s weakness.
The shared currency found support in the preliminary estimate of June Consumer Confidence as it improved to -14.7 from -18.8. US data, on the other hand, was mixed, as the Chicago Fed National Activity Index for May improved to 2.61 from -17.89 in the previous month, but New Home sales plunged 9.7% in the same month.
This Tuesday, Markit will release the preliminary estimates of its June PMIs for the EU and the US. Manufacturing activity and services output is expected to have continued to recover over the month, although in all cases, the numbers are expected within contraction levels. Nevertheless, recoveries in-line with the market’s expectations will be seen as good news. The US will also publish the June Richmond Fed Manufacturing Index and May New Home Sales.
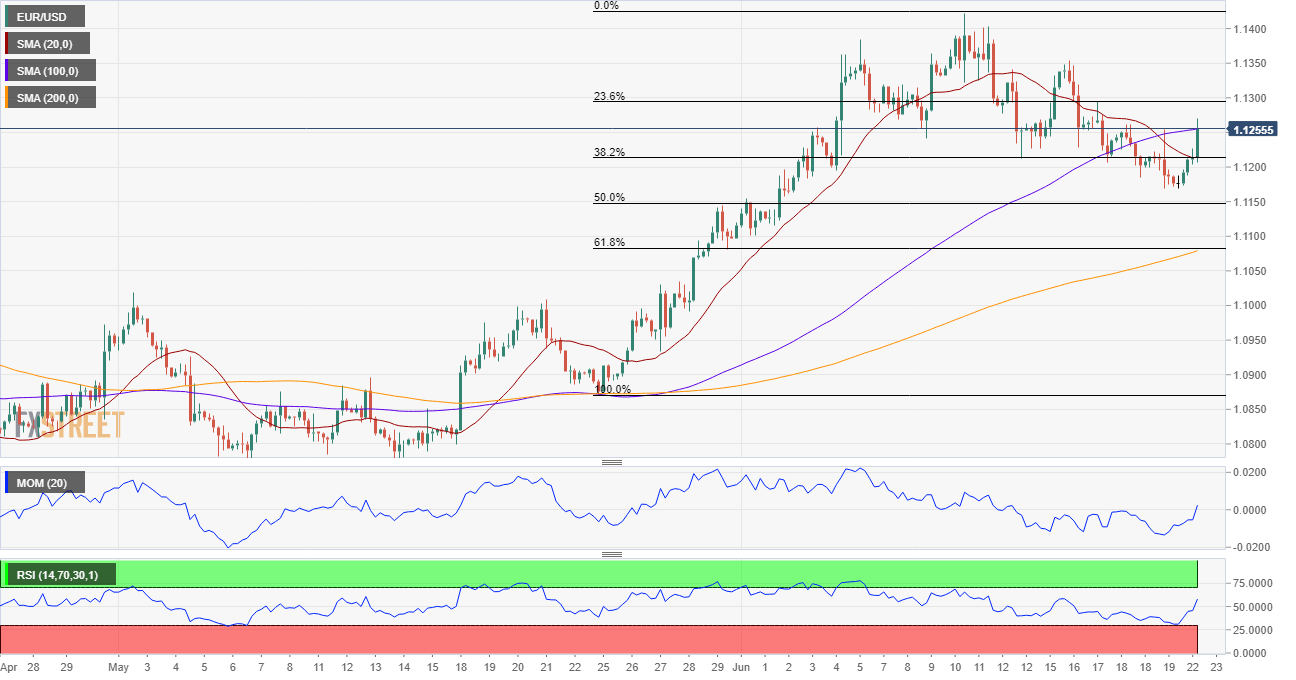
EUR/USD Short-Term Technical Outlook
The EUR/USD pair has been trading between Fibonacci levels, finding support at around the 38.2% retracement of its latest daily advance, but unable to move beyond the 23.6% retracement of the same rally at 1.1270. The short-term picture skews the risk to the upside, as, in the 4-hour chart, the pair has managed to recover beyond its 20 SMA, although moving averages continue to lack directional strength. Technical indicators, in the meantime, re-entered positive ground with a limited bullish momentum. The bullish case will be firmer on a clear break above the immediate Fibonacci resistance level.
Support levels: 1.1225 1.1170 1.1120
Resistance levels: 1.1270 1.1310 1.1350
Image sourced from Pixabay
© 2024 Benzinga.com. Benzinga does not provide investment advice. All rights reserved.
Trade confidently with insights and alerts from analyst ratings, free reports and breaking news that affects the stocks you care about.

