


Camber Energy, Inc CEI, Clover Health Investments Corp CLOV and Globalstar, Inc GSAT are all trading higher in strong downtrends. A downtrend occurs when a stock consistently makes a series of lower lows and lower highs on the chart.
The lower lows indicate the bears are in control while the intermittent lower highs indicate consolidation periods. Traders can use moving averages to help identify an uptrend with descending lower timeframe moving averages (such as the eight-day or 21-day exponential moving averages) indicating the stock is in a steep shorter-term downtrend and descending longer-term moving averages (such as the 200-day simple moving average) indicating a long-term downtrend.
A stock often signals when the lower low is in by printing a reversal candlestick such as a doji, bullish engulfing or hammer candlestick. Likewise, the lower high could be signaled when a doji, gravestone or dragonfly candlestick is printed. Moreover, the lower lows and lower highs often take place at resistance and support levels.
In a downtrend the "trend is your friend" until it’s not and in a downtrend, there are ways for both bullish and bearish traders to participate in the stock:
- Bearish traders who are already holding a position in a stock can feel confident the downtrend will continue unless the stock makes a higher high. Traders looking to take a position in a stock trading in a downtrend can usually find the safest entry on the lower high.
- Bullish traders can enter the trade on the lower low and exit on the lower high. These traders can also enter when the downtrend breaks and the stock makes a higher high indicating a reversal into an uptrend may be in the cards.
Want direct analysis? Find me in the BZ Pro lounge! Click here for a free trial.
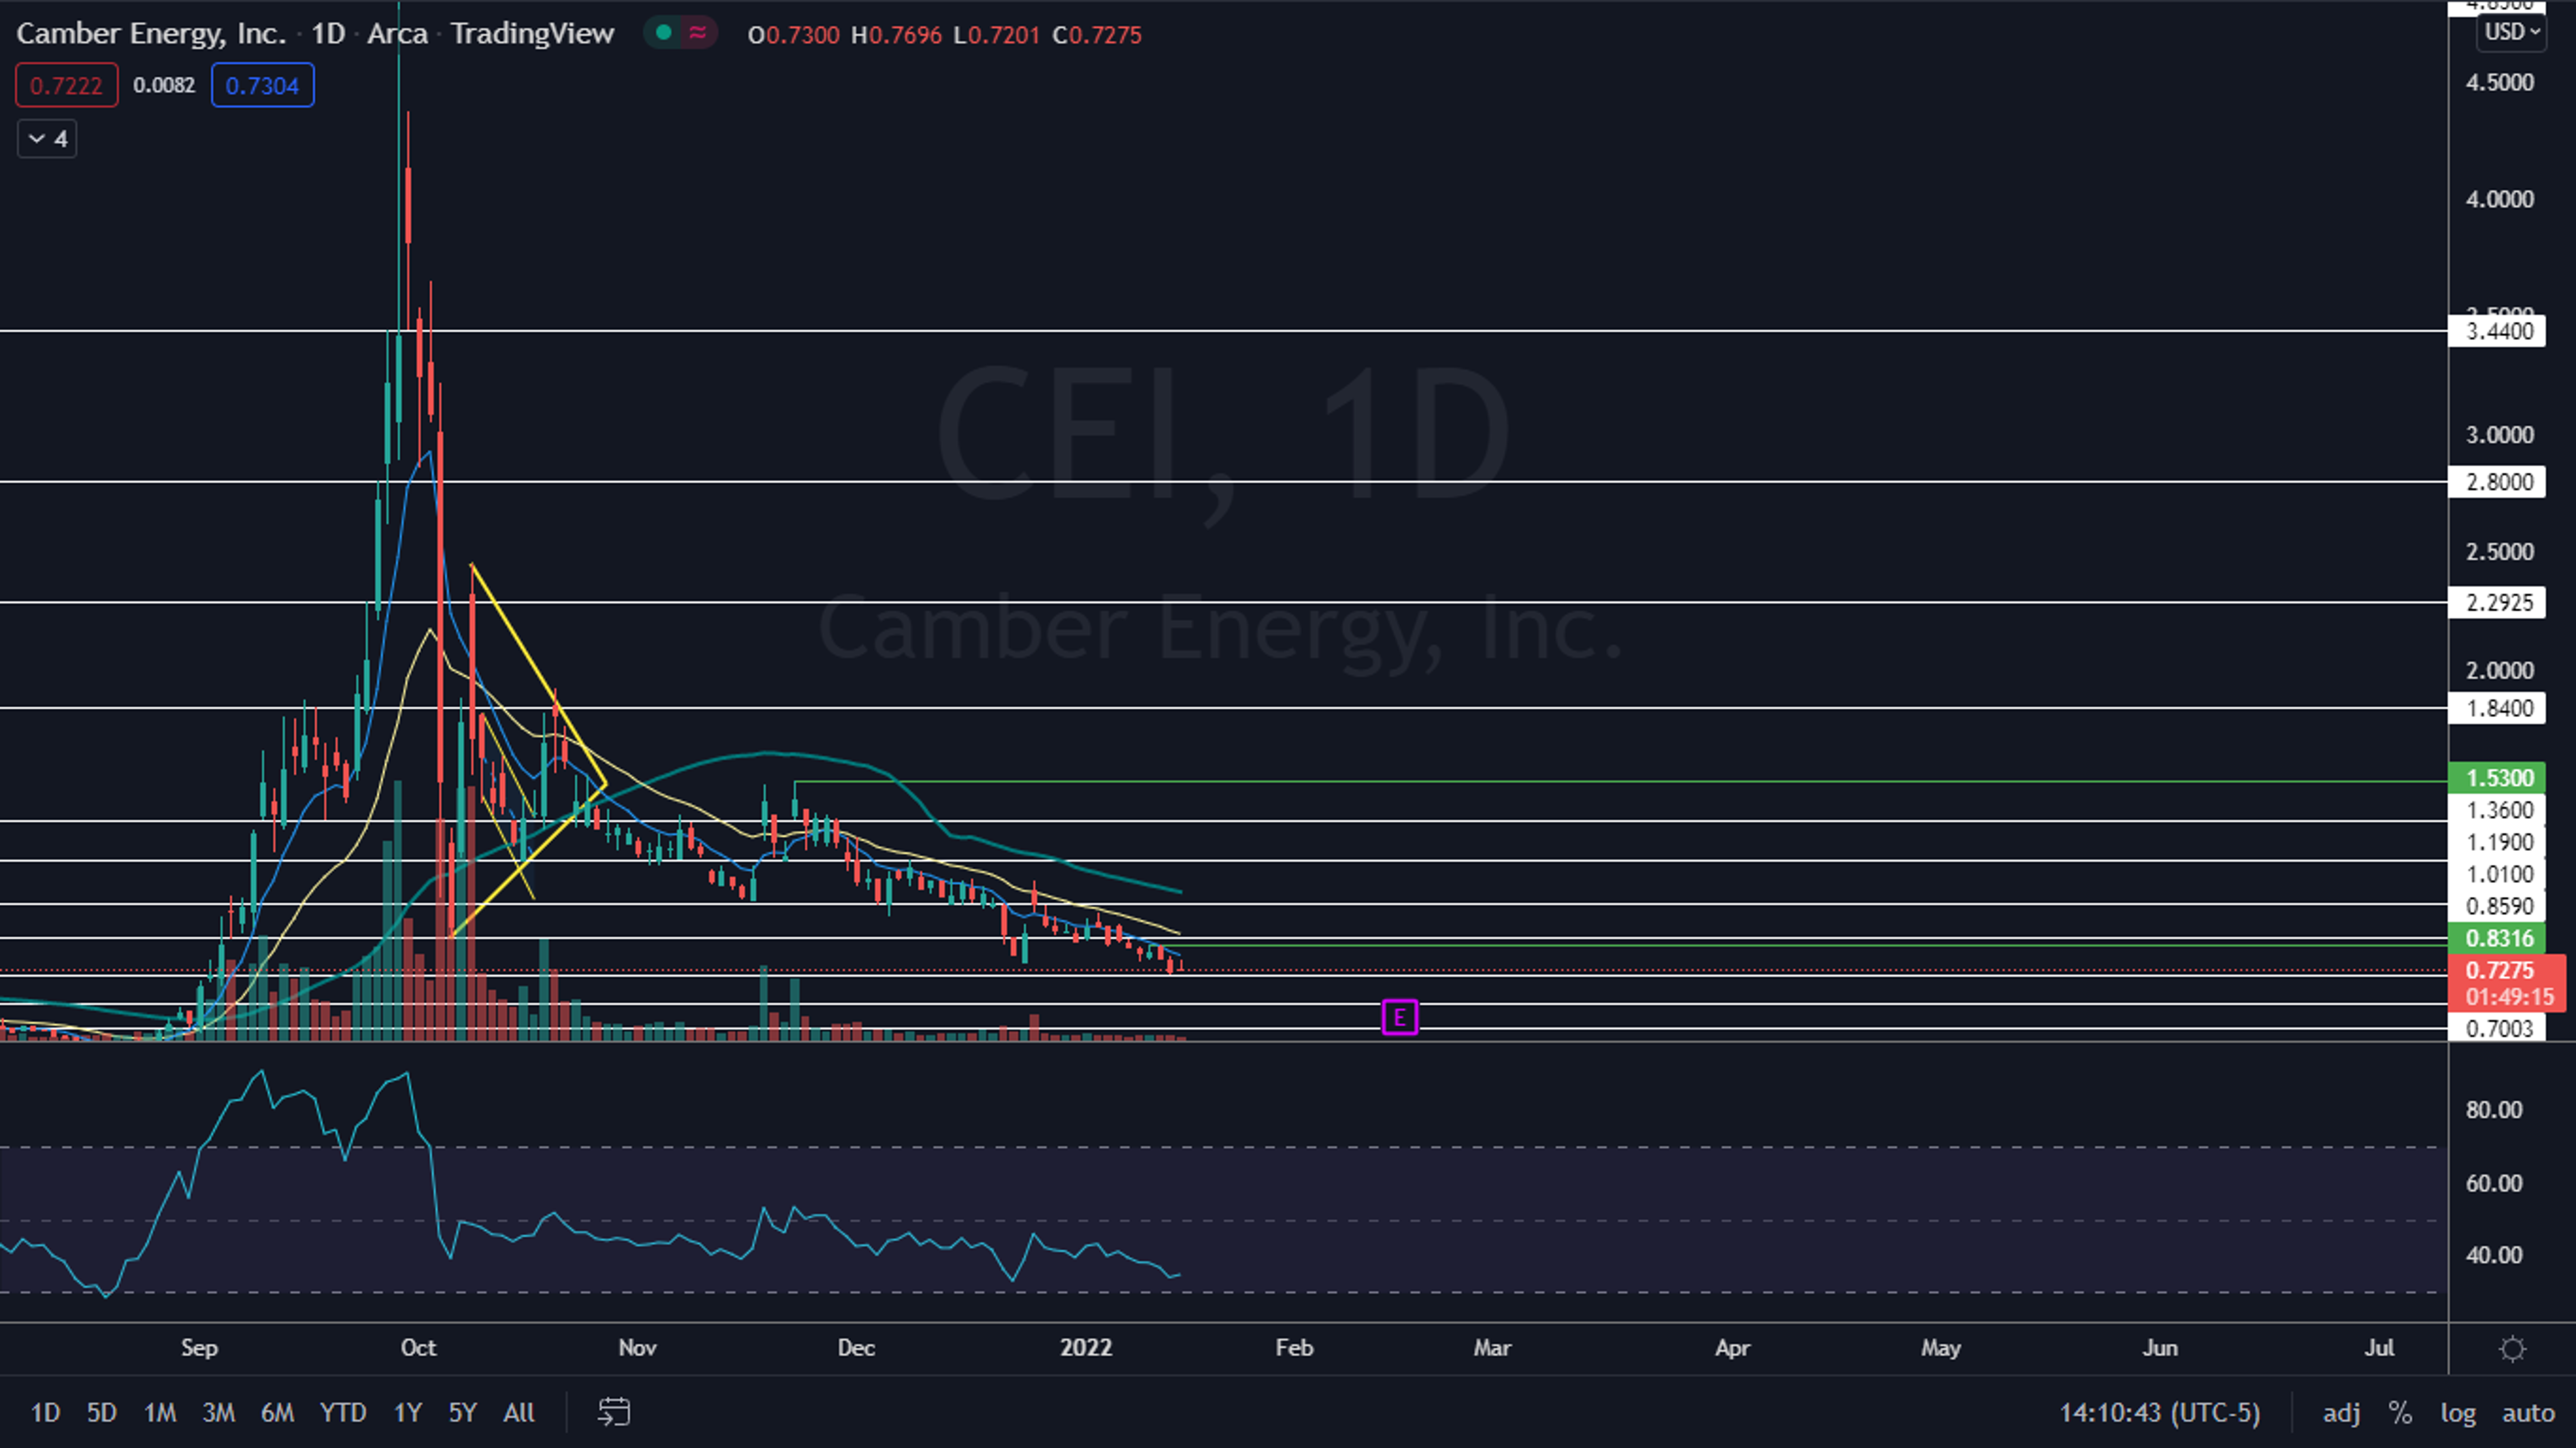
The Camber Energy Chart: Camber Energy has been trading in a fairly consistent downtrend since Nov. 22 when the stock briefly popped up to make a high of $1.53. The most recent lower high was printed on Jan. 11 at $83 cents and the most recent lower low of 70 cents was created on Thursday.
- On Friday, Camber Energy was trading slightly higher and creating an inside bar pattern, which leans bearish because the stock was trading lower before printing the pattern.
- Camber Energy is being guided lower by the daily eight-day exponential moving average (EMA) and when the stock eventually breaks up above the level it could indicate a trend reversal, although Camber Energy will also need to confirm an uptrend with a higher high and subsequent higher low.
- The stock has resistance above at 85 cents and $1.01 and support below at 70 cents and the 58-cent mark.

The Clover Health Chart: On Friday, Clover Health printed an all-time low of $2.93, which also stands as the most recent lower low of its long-term downtrend, which has caused the stock to decline about 90% since reaching a June 10 all-time high of $28.85.
- Clover Health was attempting to print a doji candlestick at the all-time low, which indicates a bounce to create its next lower high may be in the cards for Monday.
- The stock will need to pop up above the $3.37 level to immediate negate the downtrend or trade sideways while not making another lower low.
- Like Camber Energy, Clover Health is being guided lower by the eight-day EMA.
- There is resistance above at $3.37 and $3.68 but there is no support below in terms of price history.

The Globalstar Chart: Globalstar has been trading in a consistent downtrend since Nov. 9 when the stock printed a high of $1.75 and has since lost 41% of its value.
- The most recent lower high was printed on Jan. 12 at the $1.13 level and the most recent lower low was printed Friday at $1.
- The $1 level may mark the temporary bottom because it is both psychological support and because paired with the price action of Thursday Globalstar may have printed a bullish double bottom pattern near the level.
- Globalstar has resistance above at $1.19 and $1.35 and support below at $1 and 82 cents.

© 2024 Benzinga.com. Benzinga does not provide investment advice. All rights reserved.
Trade confidently with insights and alerts from analyst ratings, free reports and breaking news that affects the stocks you care about.

