


The cryptocurrency Worldcoin WLD/USD has surged by 10% in the last 24-hour period, overtaking both Bitcoin BTC/USD and Ethereum ETH/USD in gains on Christmas Day.
What Happened: Cryptocurrency analyst Ali Martinez said on Worldcoin’s bullish movement, “Worldcoin shows signs of a breakout from a bull flag on its 4-hour chart! If confirmed, this could pave the way for WLD to enter an 80% rally, targeting $6.30.”
In operational news, Worldcoin has made a strategic move to “temporarily scale back” the deployment of its offline orb verification feature for users in India, reported Moneycontrol. The service, which relies on a five-pound chromatic helmet-like device called the Orb that scans people’s eyeballs for identity verification, is expected to be re-launched in 2024. The Orb system is designed to onboard individuals in areas where conventional identification methods are scarce or non-existent.
See More: Dogecoin HODLERs Are Beating Shiba Inu With 57% Landing In Profits, IntoTheBlock Data Reveals
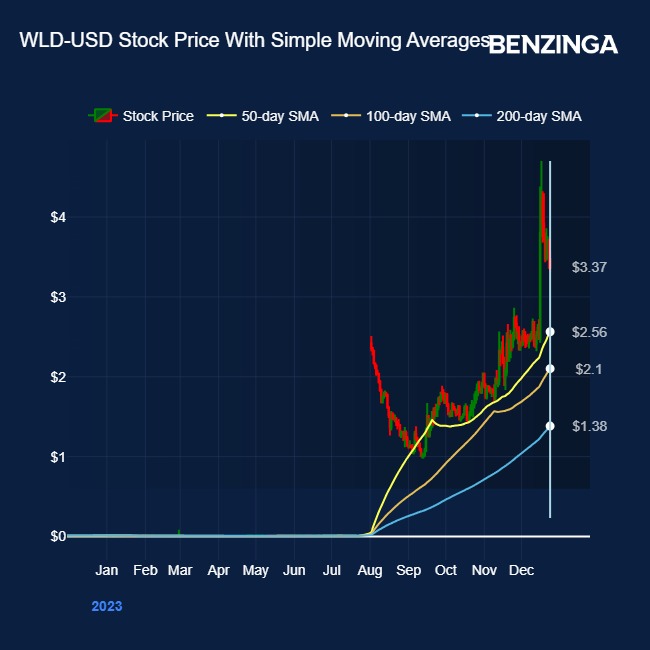
Why It Matters: The technical indicators for Worldcoin present a positive picture, with key indicators such as the Simple Moving Averages (SMA), On-Balance Volume (OBV), and Relative Strength Index (RSI) all pointing toward a bullish trend.
SMA Trends: The trending lines for the 50-day, 100-day, and 200-day SMAs are all moving upward, indicating that WLD may be on an uptrend. The fact that WLD’s price is currently above these SMA lines shows this bullish sentiment. The positioning of the 50-day SMA over both the 100-day and 200-day SMAs, along with the 100-day SMA’s rise above the 200-day, is known as a golden cross — a strong sign of building short-term and potentially long-term momentum.

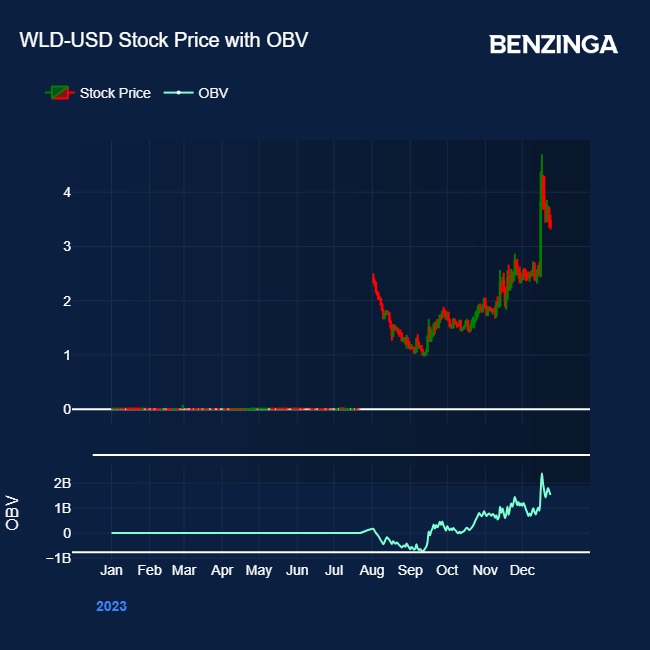
OBV Insights: The OBV indicator is on an upward swing, showing that trading volume is increasing with the price—an encouraging sign of healthy market interest in WLD.
RSI Observations: Although the RSI has tipped over the 70 level multiple times, suggesting periods of being overbought which could lead to a correction if traders start to profit, the RSI is currently not in an overbought state.
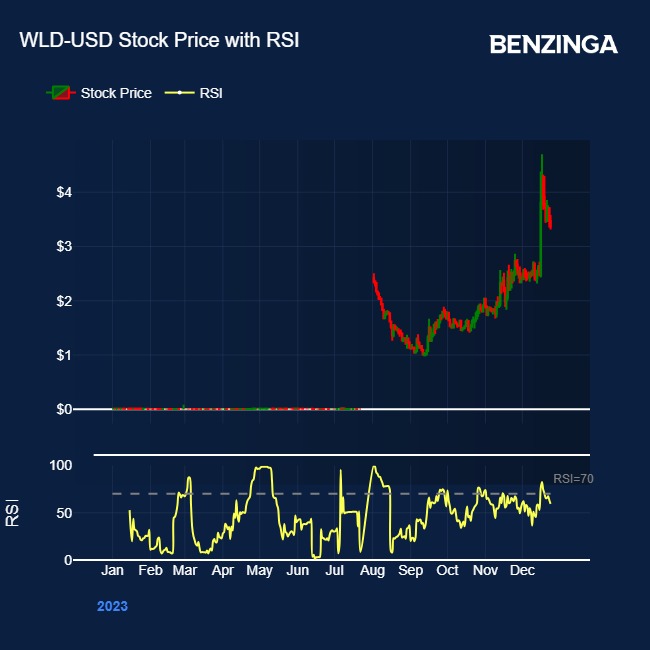
Image by CryptoFX on Shutterstock
Price Action: At the time of writing, WLD was trading at $0.0086, according to Benzinga Pro.
Read Next: Here’s How Much You Should Invest In Shiba Inu Today For A $1M Payday If SHIB Hits 1 Cent?
© 2024 Benzinga.com. Benzinga does not provide investment advice. All rights reserved.
Trade confidently with insights and alerts from analyst ratings, free reports and breaking news that affects the stocks you care about.

